| Param | Original file | Final file |
|---|---|---|
| Filename | modeM0/AS1G06_033T01_9000000760_05870cztM0_level2.evt | modeM0/AS1G06_033T01_9000000760_05870cztM0_level2_quad_clean.evt |
| Size (bytes) | 1,161,417,600 | 191,185,920 |
| Size | 1.1 GB | 182.3 MB |
| Events in quadrant A | 7,867,511 | 1,166,862 |
| Events in quadrant B | 8,276,882 | 1,164,842 |
| Events in quadrant C | 7,706,875 | 1,167,488 |
| Events in quadrant D | 10,138,390 | 1,085,056 |
| Mode SS | |||
|---|---|---|---|
| Quadrant | BADHDUFLAG | Total packets | Discarded packets |
| A | 0 | 362 | 2 |
| B | 0 | 362 | 14 |
| C | 0 | 362 | 6 |
| D | 0 | 362 | 6 |
| Mode M0 | |||
|---|---|---|---|
| Quadrant | BADHDUFLAG | Total packets | Discarded packets |
| A | 0 | 36560 | 670 |
| B | 0 | 37128 | 727 |
| C | 0 | 36264 | 688 |
| D | 0 | 43616 | 1424 |
| Mode M9 | |||
|---|---|---|---|
| Quadrant | BADHDUFLAG | Total packets | Discarded packets |
| A | 0 | 18 | 0 |
| B | 0 | 18 | 1 |
| C | 0 | 18 | 0 |
| D | 0 | 18 | 0 |
| Quadrant | Total seconds | Saturated seconds | Saturation percentage |
|---|---|---|---|
| A | 17520 | 84 | 0.479452% |
| B | 17515 | 119 | 0.679418% |
| C | 17511 | 21 | 0.119925% |
| D | 17405 | 517 | 2.970411% |
Noise dominated data is calculated using 1-second bins in cleaned event files. If a bin has >2000 counts, and if more than 50% of those come from <1% of pixels, then it is considered to be noise-dominated and hence unusable.
| Quadrant | # 1 sec bins | Bins with >0 counts | Bins with >2000 counts | High rate bins dominated by noise | Noise dominated (total time) | Noise dominated (detector-on time) | Marked lightcurve |
|---|---|---|---|---|---|---|---|
| A | 19566 | 17807 | 4 | 4 | 0.02% | 0.02% | 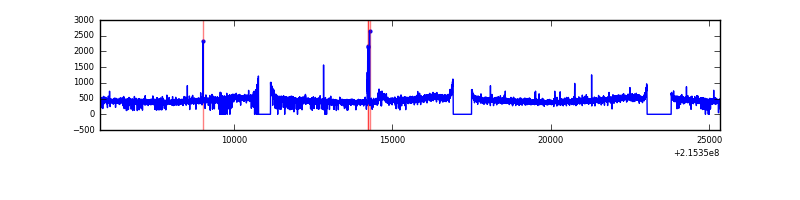 |
| B | 19566 | 17792 | 8 | 8 | 0.04% | 0.04% | 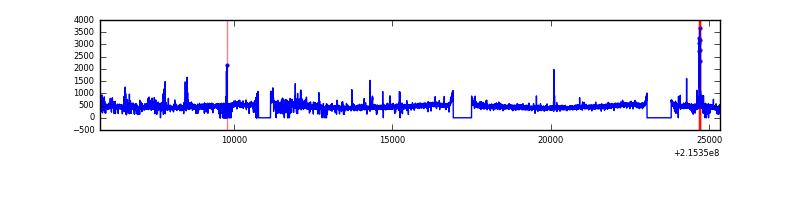 |
| C | 19566 | 17797 | 0 | 0 | 0.00% | 0.00% | 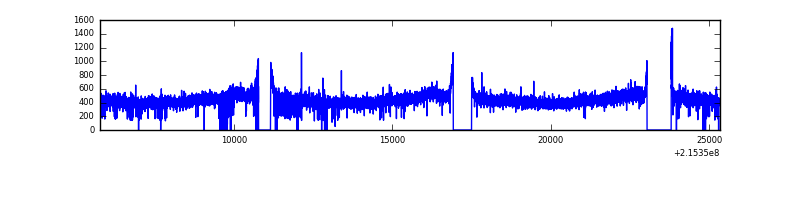 |
| D | 19566 | 17766 | 346 | 346 | 1.77% | 1.95% | 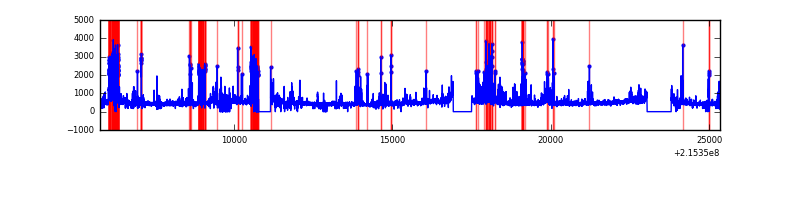 |
Top three noisy pixels from each quadrant. If the there are fewer than three noisy pixels in the level2.evt file, extra rows are filled as -1
| Pixel properties | Quadrant properties | ||||||
|---|---|---|---|---|---|---|---|
| Quadrant | DetID | PixID | Counts | Sigma | Mean | Median | Sigma |
| A | 15 | 236 | 88997 | 211.15 | 2016 | 1975 | 412.1 |
| A | 0 | 226 | 19712 | 43.04 | 2016 | 1975 | 412.1 |
| A | 12 | 194 | 19447 | 42.39 | 2016 | 1975 | 412.1 |
| B | 15 | 204 | 98853 | 249.34 | 2034 | 1986 | 388.5 |
| B | 0 | 214 | 85656 | 215.37 | 2034 | 1986 | 388.5 |
| B | 10 | 245 | 53942 | 133.74 | 2034 | 1986 | 388.5 |
| C | 9 | 16 | 24531 | 48.95 | 1966 | 1975 | 460.8 |
| C | 13 | 61 | 15794 | 29.99 | 1966 | 1975 | 460.8 |
| C | 8 | 222 | 6368 | 9.53 | 1966 | 1975 | 460.8 |
| D | 2 | 152 | 1375143 | 2920.82 | 1927 | 1873 | 470.2 |
| D | 1 | 20 | 643158 | 1363.95 | 1927 | 1873 | 470.2 |
| D | 2 | 136 | 271795 | 574.1 | 1927 | 1873 | 470.2 |
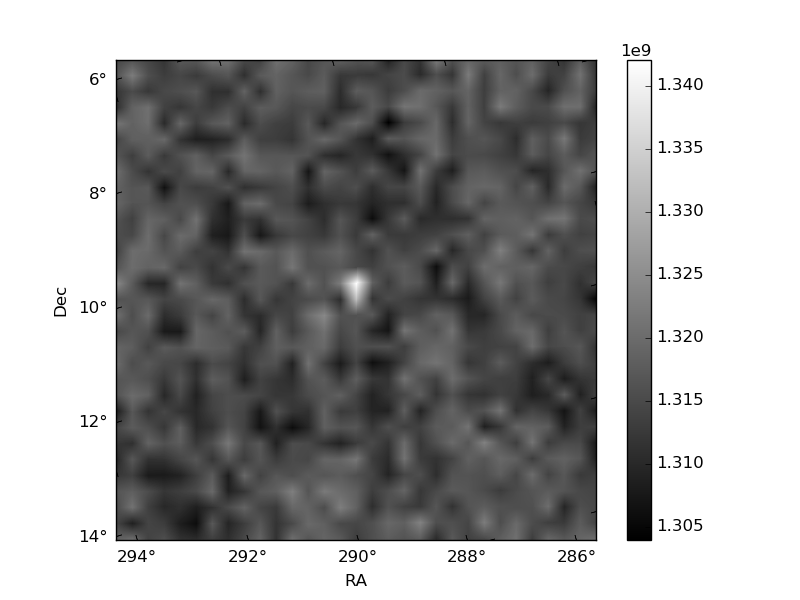
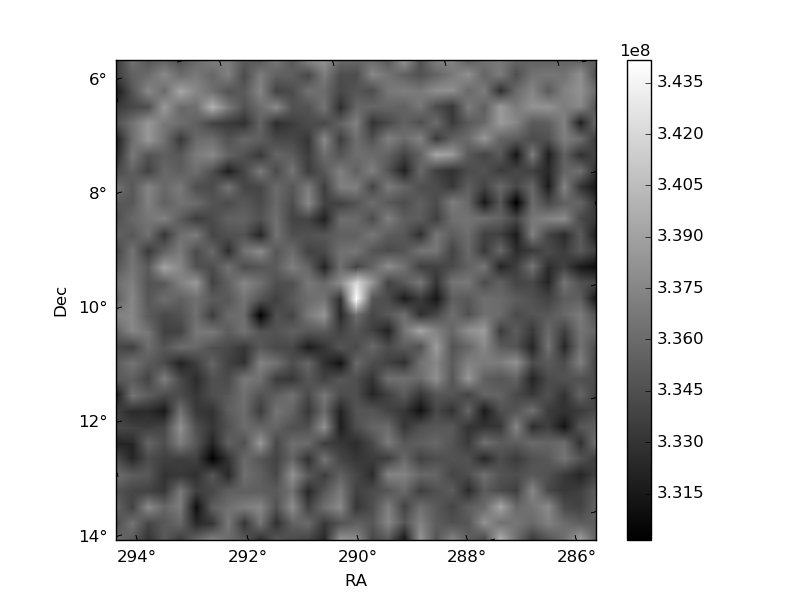
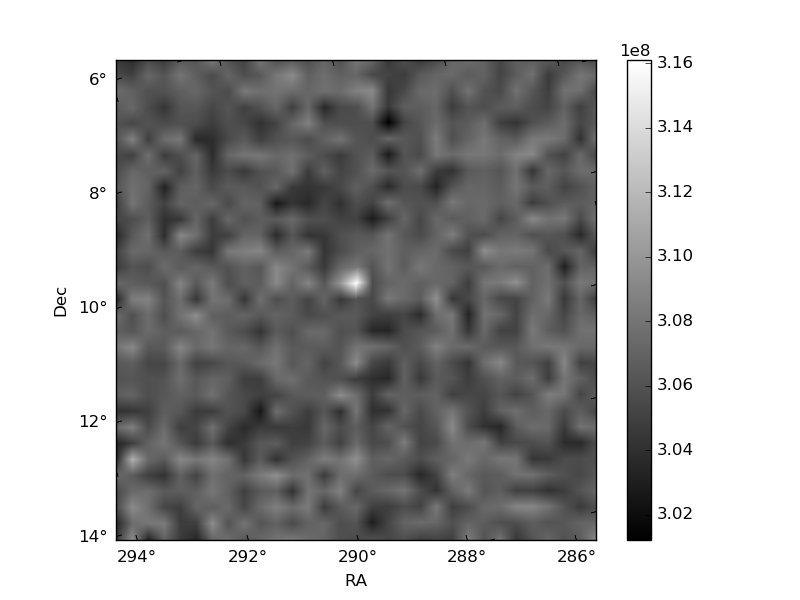
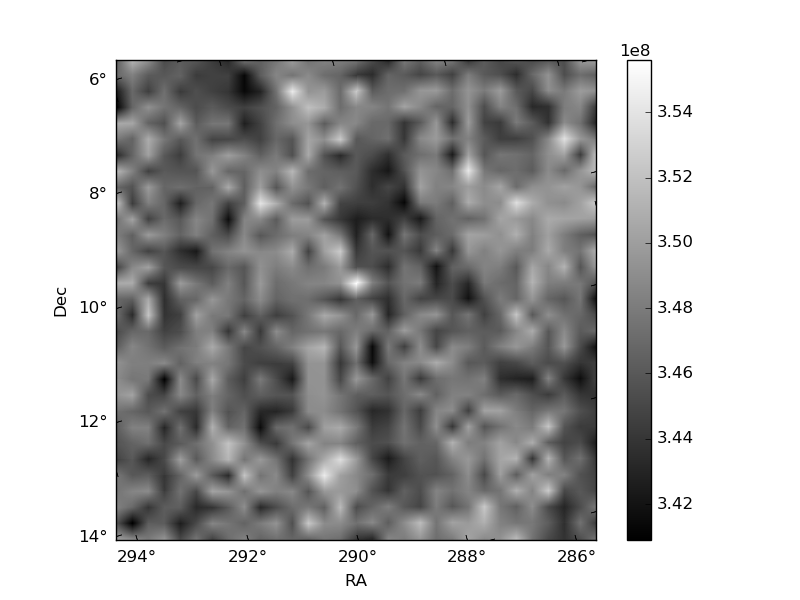
Histogram calculated using DETX and DETY for each event in the final _common_clean file
| Quadrant A | 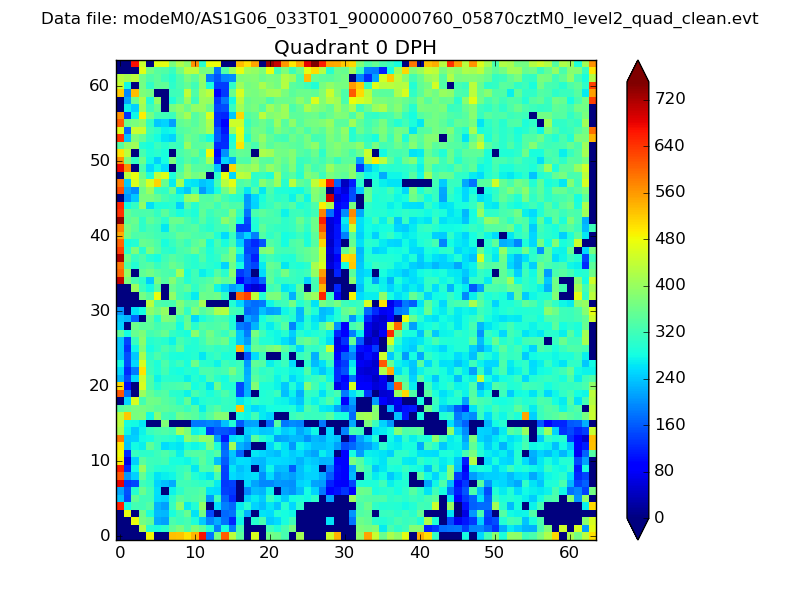 |
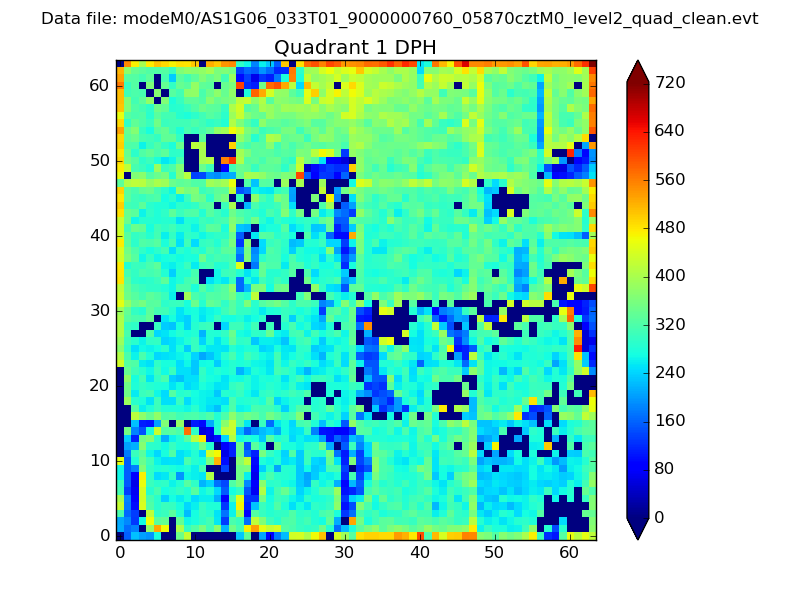 |
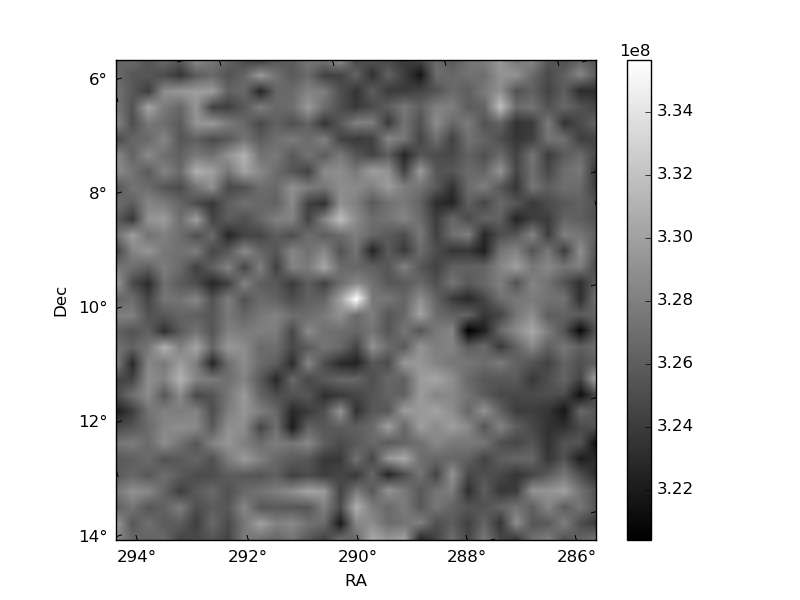
Quadrant B |
|---|---|---|---|
| Quadrant D | 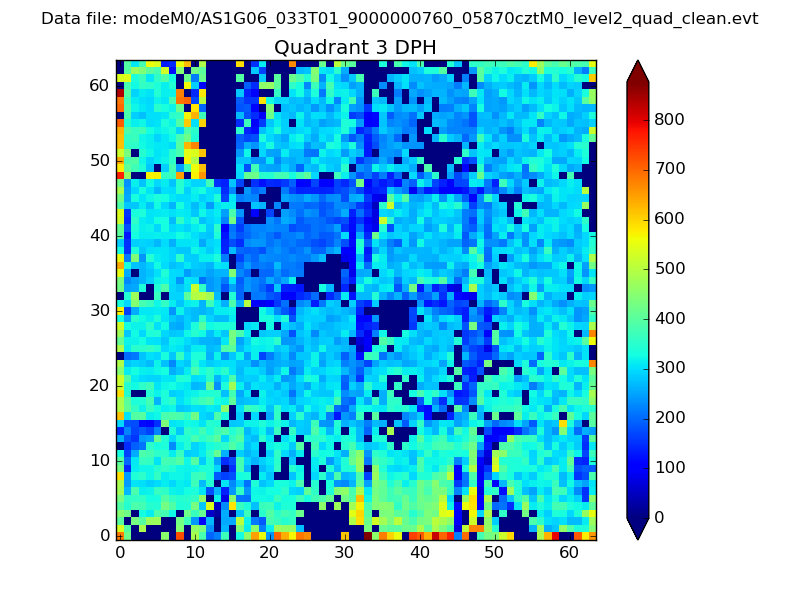 |
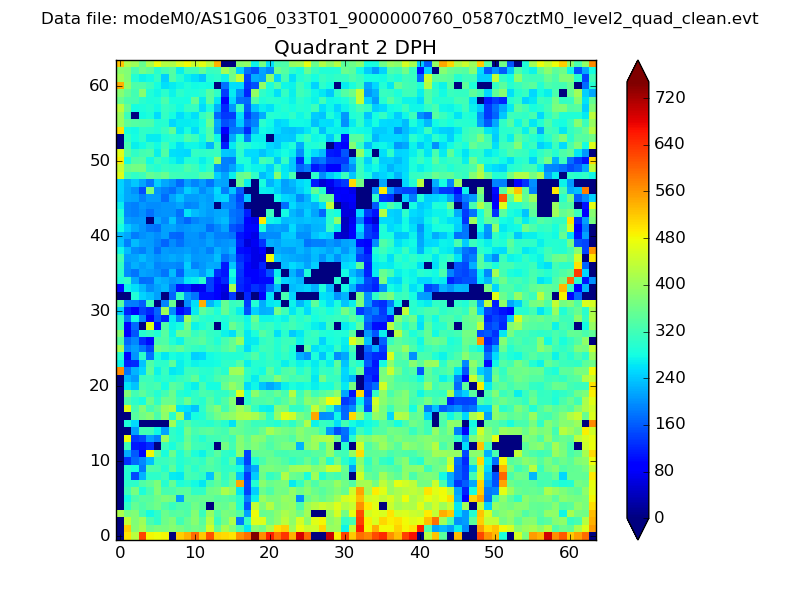 |
Quadrant C |
| Plot type | Count rate plots | Images |
|---|---|---|
| Comparison with Poisson distribution Blue bars denote a histogram of data divided into 1 sec bins. Red curve is a Poisson curve with rate = median count rate of data. |
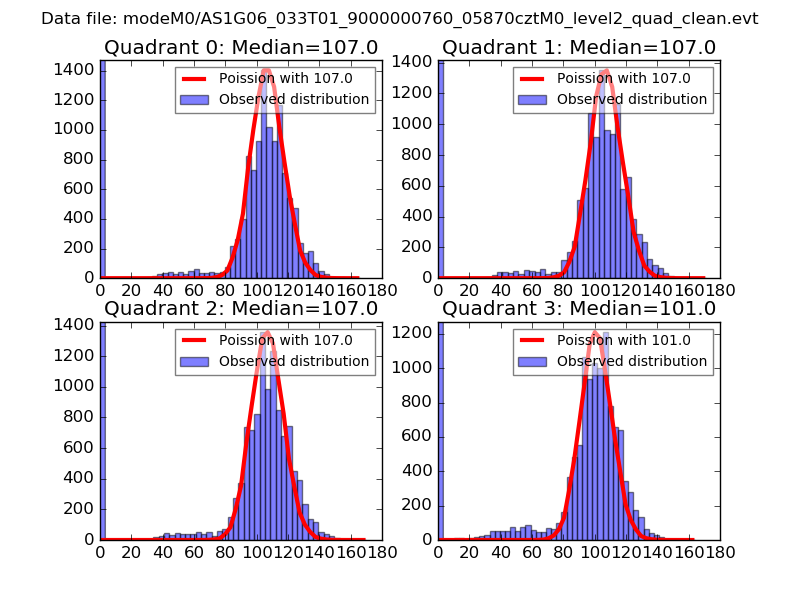 |
 |
| Quadrant-wise count rates Data is divided into 100 sec bins |
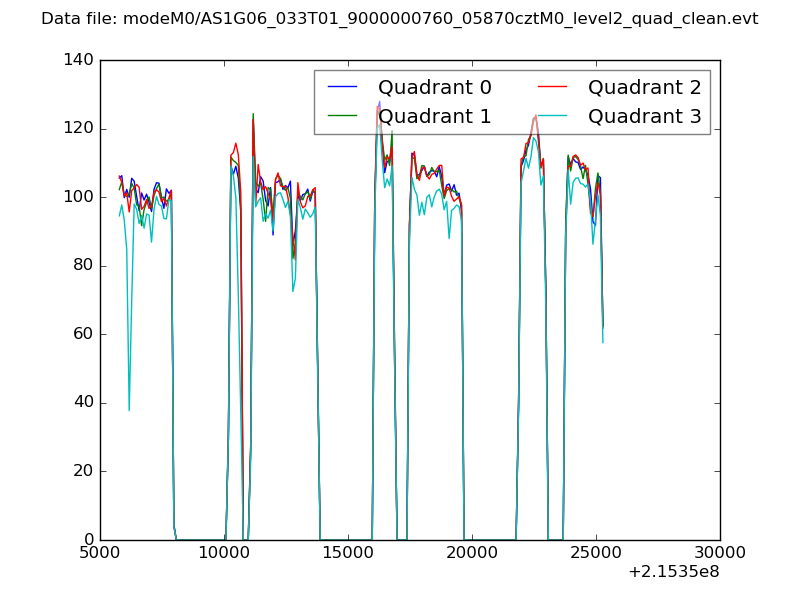 |
|
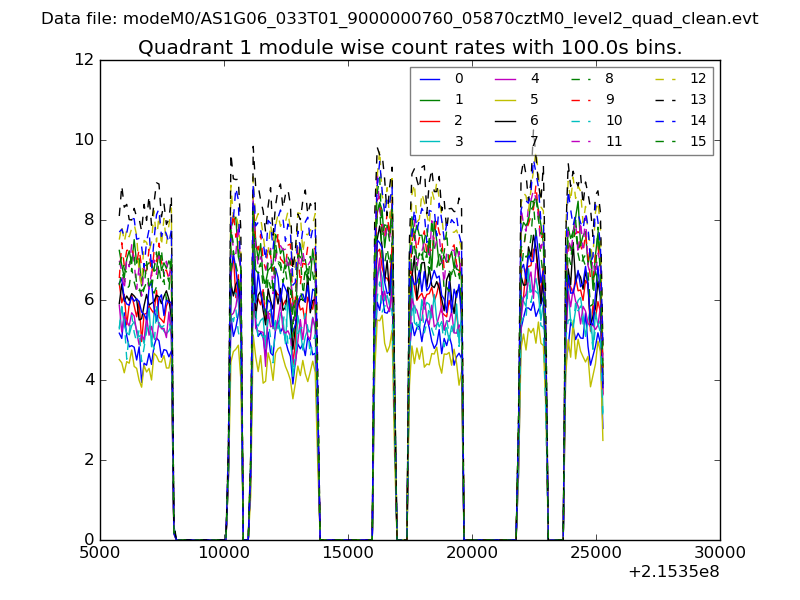
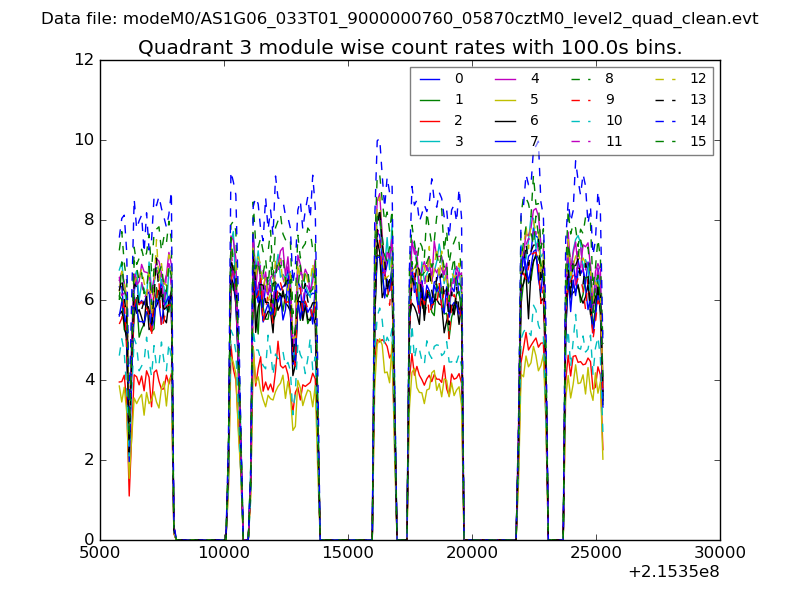
| Module-wise count rates for Quadrant A Data is divided into 100 sec bins |
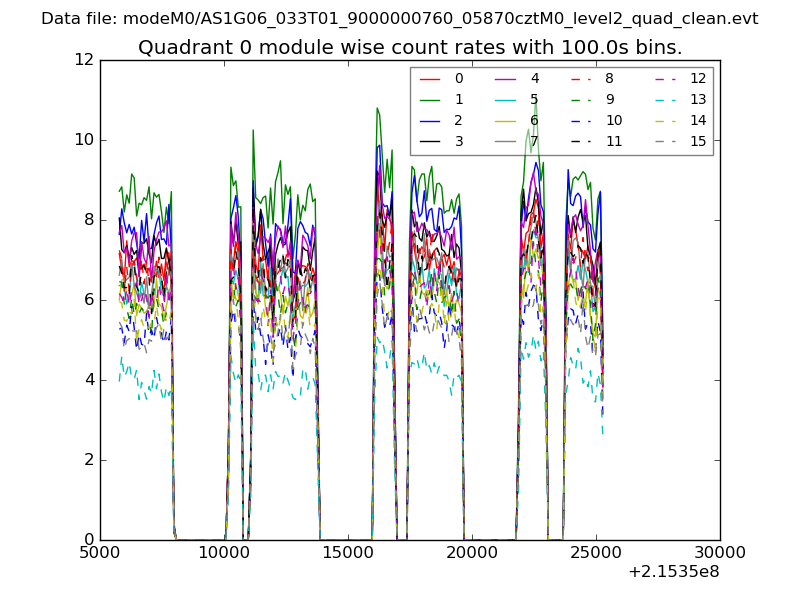 |
 |
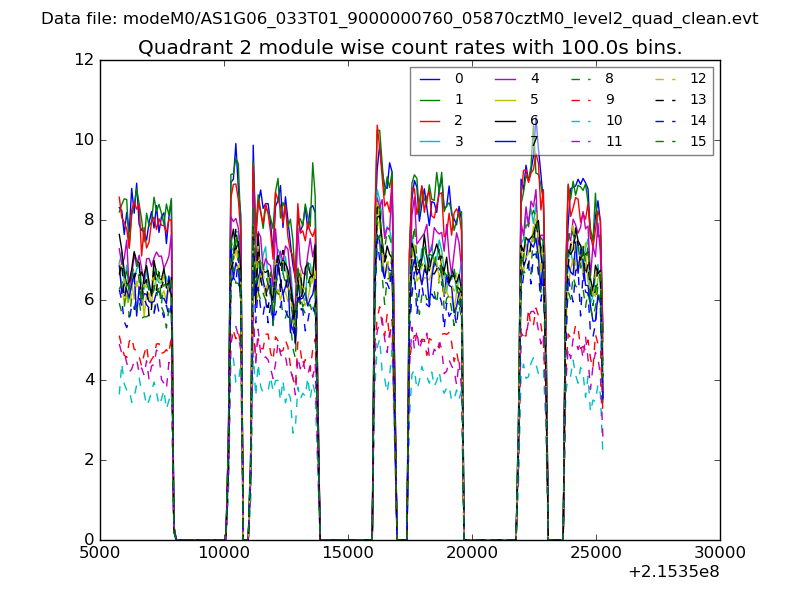
| Module-wise count rates for Quadrant B Data is divided into 100 sec bins |
 |
 |
| Module-wise count rates for Quadrant C Data is divided into 100 sec bins |
 |
 |
| Module-wise count rates for Quadrant D Data is divided into 100 sec bins |
 |
 |
| Parameter | Plot |
|---|---|
| CZT HV Monitor | 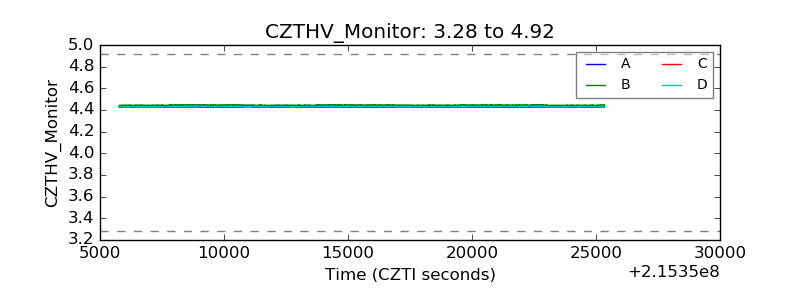 |
| D_VDD | 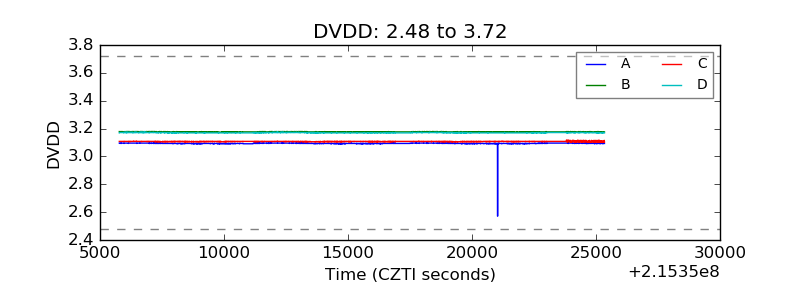 |
| Temperature 1 | 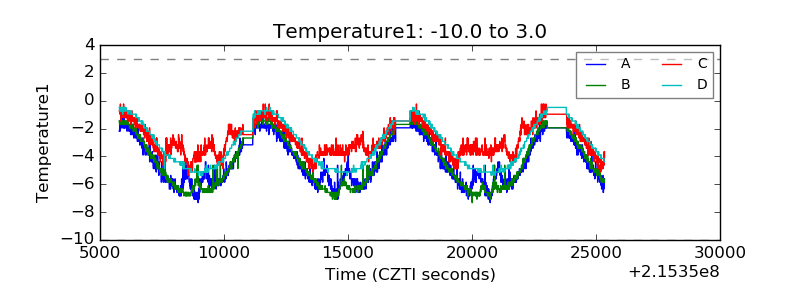 |
| Veto HV Monitor | 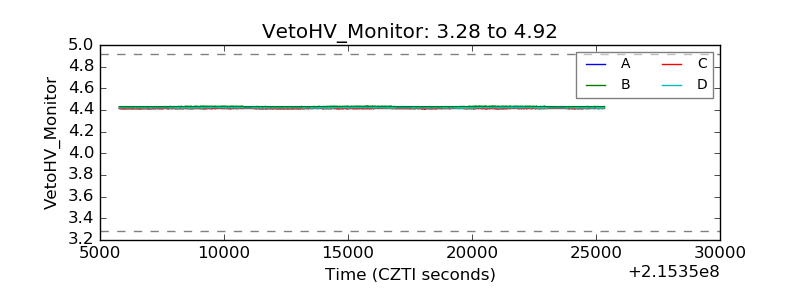 |
| Veto LLD | 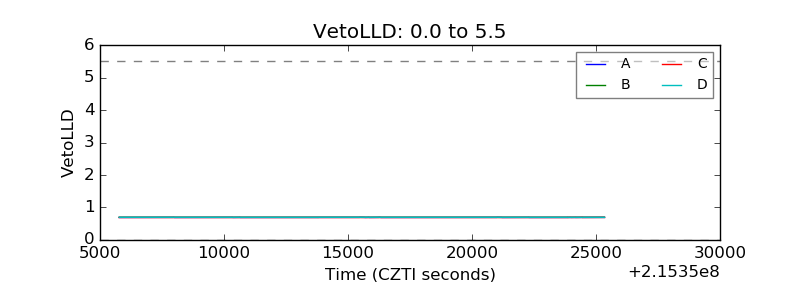 |
| Alpha Counter | 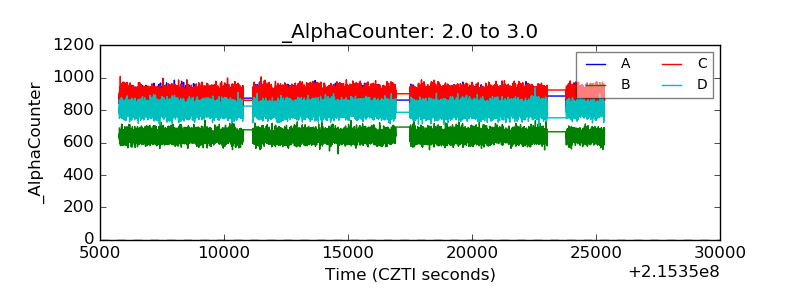 |
| _CPM_Rate | 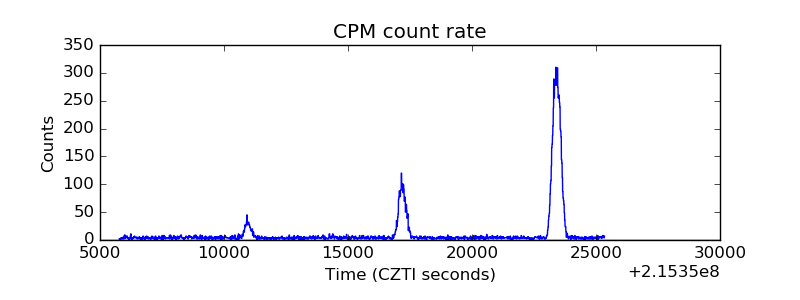 |
| CZT Counter | 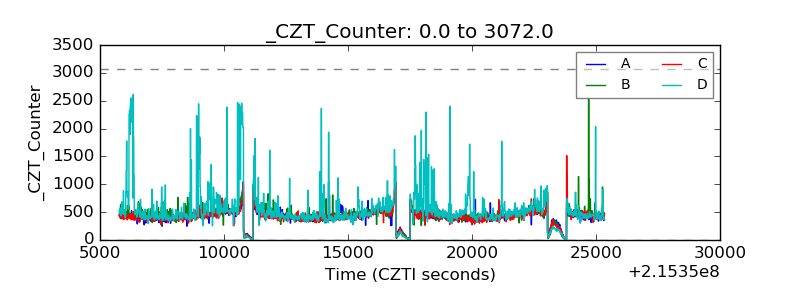 |
| +2.5 Volts monitor | 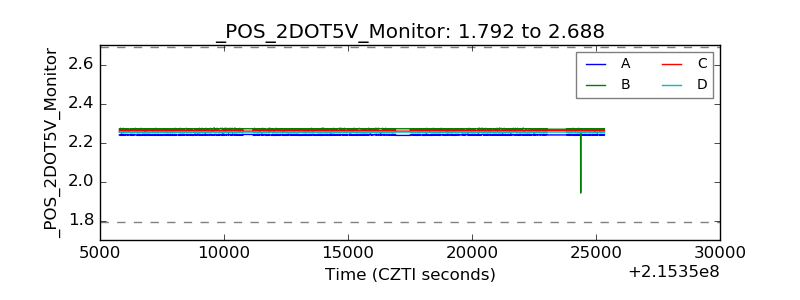 |
| +5 Volts monitor |  |
| _ROLL_ROT | 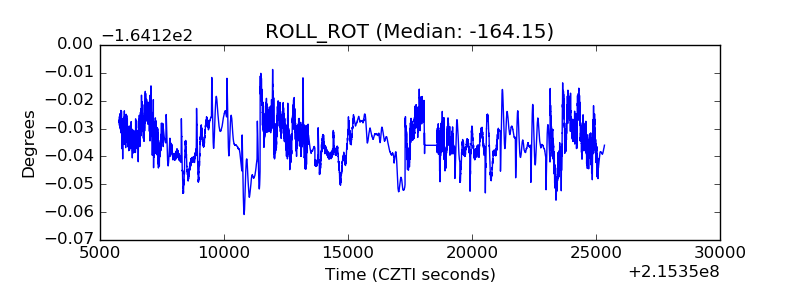 |
| _Roll_DEC | 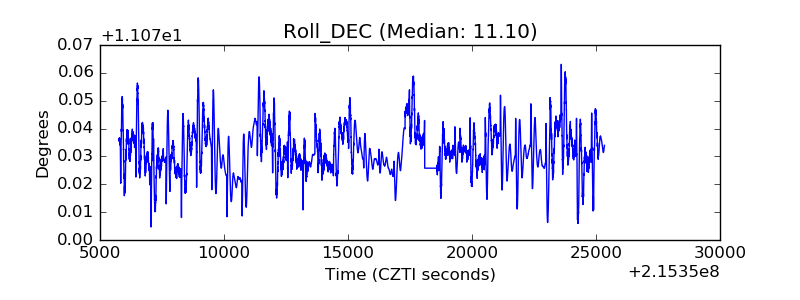 |
| _Roll_RA | 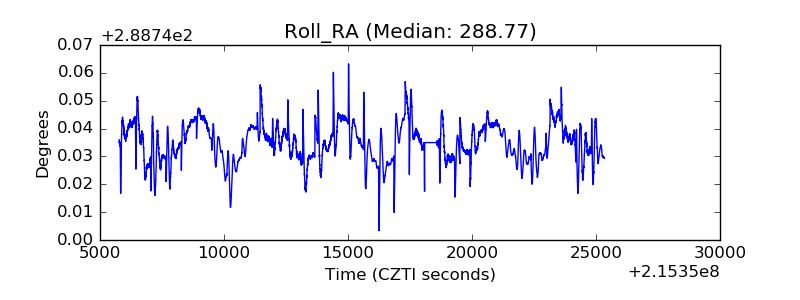 |
| Veto Counter | 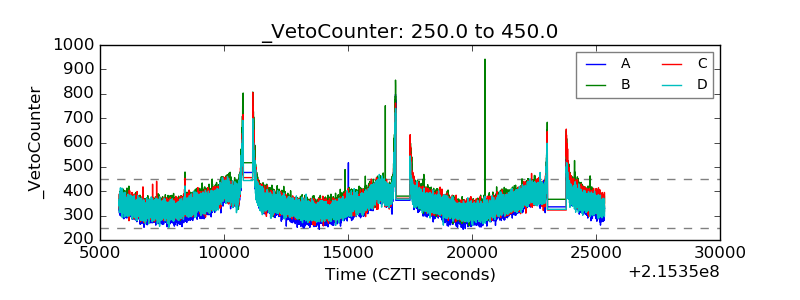 |