| Param | Original file | Final file |
|---|---|---|
| Filename | modeM0/AS1G06_033T01_9000000760_05871cztM0_level2.evt | modeM0/AS1G06_033T01_9000000760_05871cztM0_level2_quad_clean.evt |
| Size (bytes) | 388,964,160 | 63,645,120 |
| Size | 370.9 MB | 60.7 MB |
| Events in quadrant A | 2,588,604 | 385,628 |
| Events in quadrant B | 2,709,231 | 386,117 |
| Events in quadrant C | 2,575,761 | 386,110 |
| Events in quadrant D | 3,507,758 | 360,104 |
| Mode SS | |||
|---|---|---|---|
| Quadrant | BADHDUFLAG | Total packets | Discarded packets |
| A | 0 | 118 | 0 |
| B | 0 | 118 | 0 |
| C | 0 | 118 | 0 |
| D | 0 | 118 | 0 |
| Mode M0 | |||
|---|---|---|---|
| Quadrant | BADHDUFLAG | Total packets | Discarded packets |
| A | 0 | 11839 | 2 |
| B | 0 | 12006 | 1 |
| C | 0 | 11802 | 1 |
| D | 0 | 14564 | 1 |
| Mode M9 | |||
|---|---|---|---|
| Quadrant | BADHDUFLAG | Total packets | Discarded packets |
| A | 0 | 10 | 0 |
| B | 0 | 10 | 0 |
| C | 0 | 10 | 0 |
| D | 0 | 10 | 0 |
| Quadrant | Total seconds | Saturated seconds | Saturation percentage |
|---|---|---|---|
| A | 5855 | 14 | 0.239112% |
| B | 5855 | 16 | 0.273271% |
| C | 5855 | 6 | 0.102477% |
| D | 5855 | 137 | 2.339880% |
Noise dominated data is calculated using 1-second bins in cleaned event files. If a bin has >2000 counts, and if more than 50% of those come from <1% of pixels, then it is considered to be noise-dominated and hence unusable.
| Quadrant | # 1 sec bins | Bins with >0 counts | Bins with >2000 counts | High rate bins dominated by noise | Noise dominated (total time) | Noise dominated (detector-on time) | Marked lightcurve |
|---|---|---|---|---|---|---|---|
| A | 6785 | 5856 | 0 | 0 | 0.00% | 0.00% | 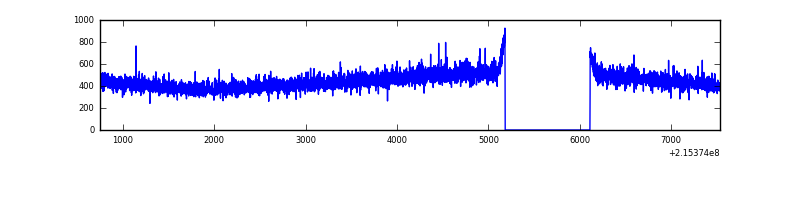 |
| B | 6785 | 5856 | 1 | 1 | 0.01% | 0.02% | 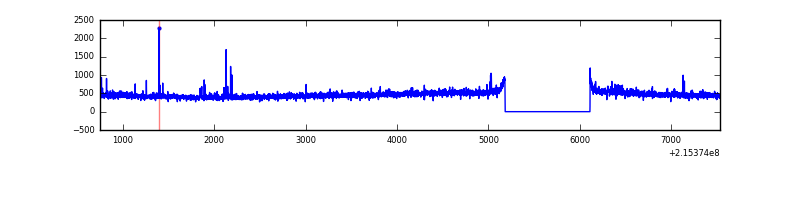 |
| C | 6785 | 5856 | 0 | 0 | 0.00% | 0.00% | 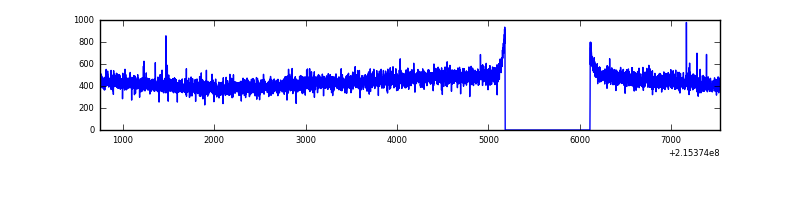 |
| D | 6785 | 5856 | 94 | 94 | 1.39% | 1.61% | 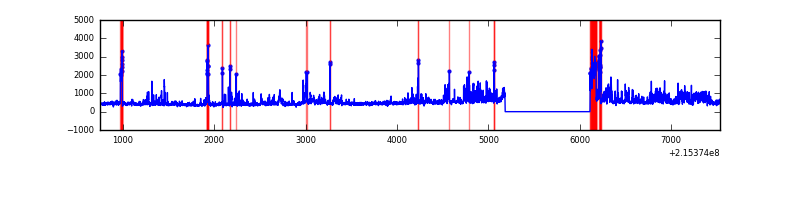 |
Top three noisy pixels from each quadrant. If the there are fewer than three noisy pixels in the level2.evt file, extra rows are filled as -1
| Pixel properties | Quadrant properties | ||||||
|---|---|---|---|---|---|---|---|
| Quadrant | DetID | PixID | Counts | Sigma | Mean | Median | Sigma |
| A | 0 | 226 | 6564 | 42.63 | 671 | 658 | 138.5 |
| A | 12 | 194 | 6493 | 42.12 | 671 | 658 | 138.5 |
| A | 13 | 254 | 4149 | 25.2 | 671 | 658 | 138.5 |
| B | 0 | 219 | 30047 | 223.15 | 678 | 664 | 131.7 |
| B | 15 | 204 | 15777 | 114.78 | 678 | 664 | 131.7 |
| B | 12 | 111 | 12362 | 88.84 | 678 | 664 | 131.7 |
| C | 8 | 128 | 11562 | 70.18 | 654 | 659 | 155.4 |
| C | 8 | 112 | 5504 | 31.19 | 654 | 659 | 155.4 |
| C | 13 | 61 | 5170 | 29.04 | 654 | 659 | 155.4 |
| D | 2 | 152 | 423150 | 2626.84 | 645 | 626 | 160.8 |
| D | 13 | 105 | 286768 | 1778.95 | 645 | 626 | 160.8 |
| D | 2 | 136 | 147134 | 910.84 | 645 | 626 | 160.8 |
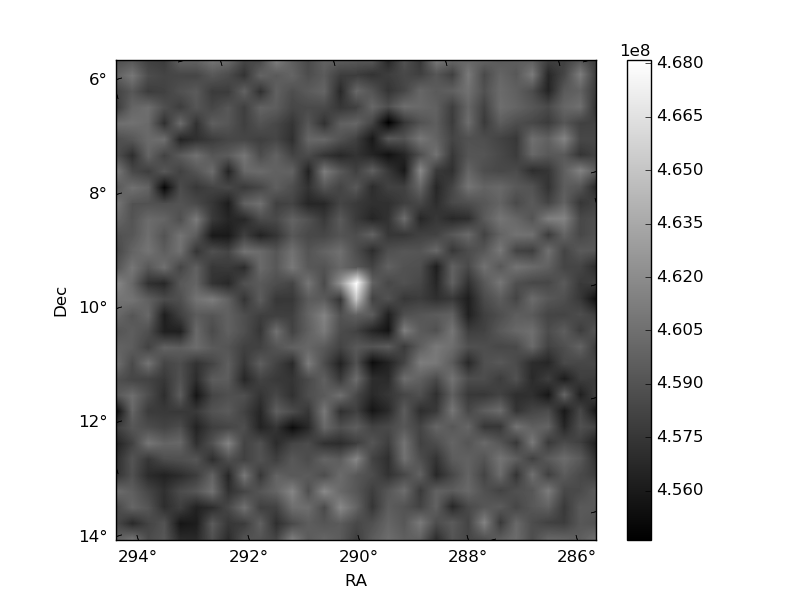
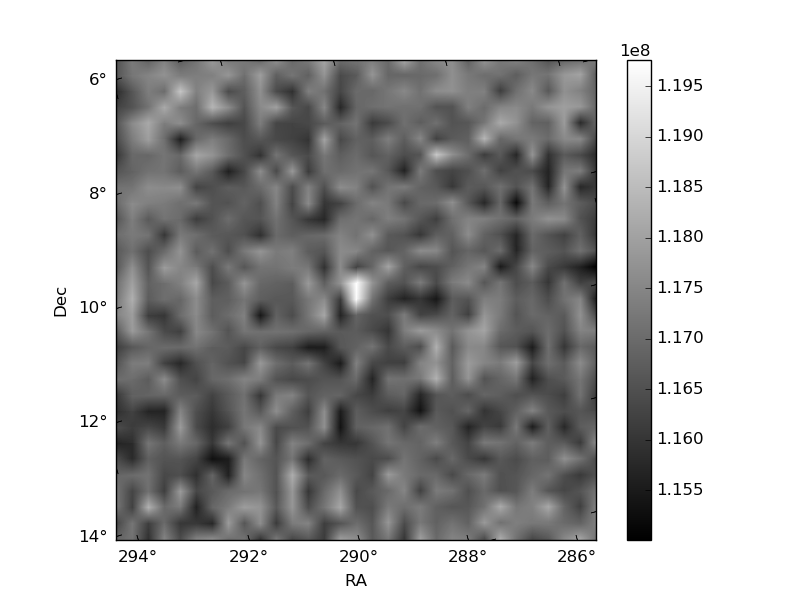
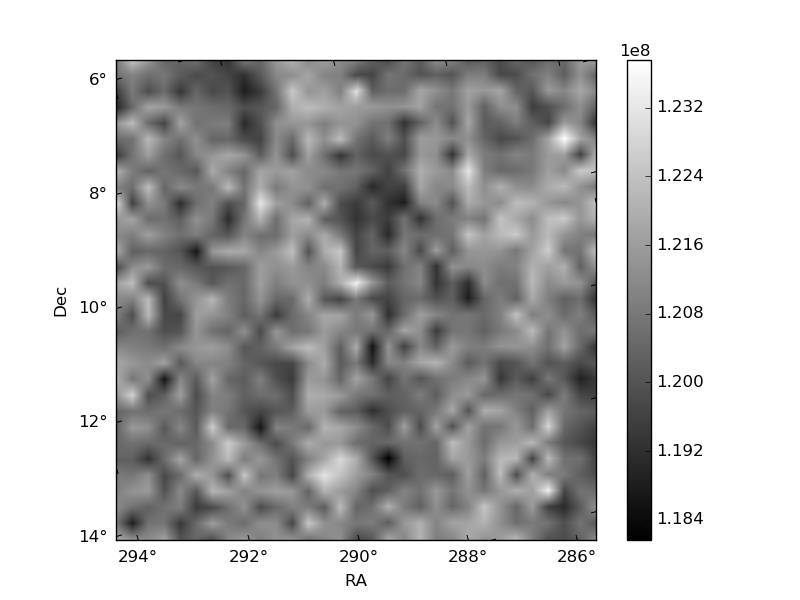
Histogram calculated using DETX and DETY for each event in the final _common_clean file
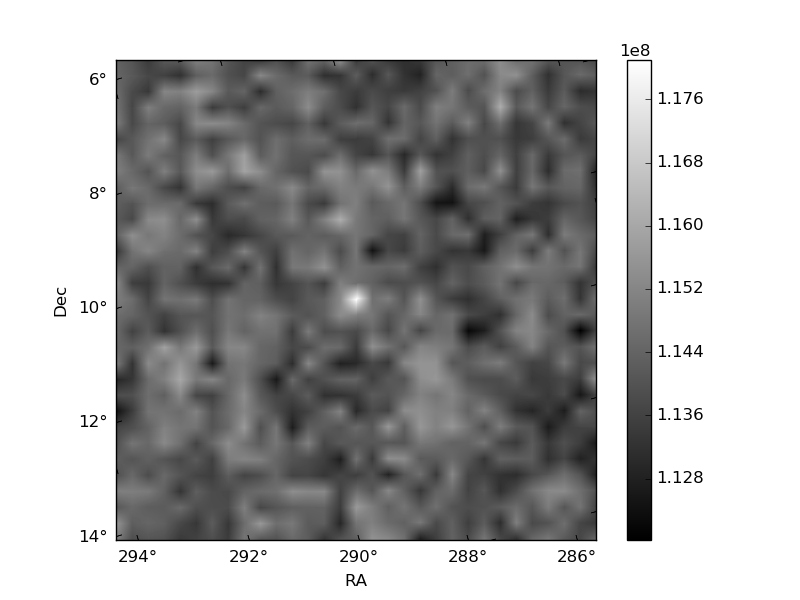
| Quadrant A | 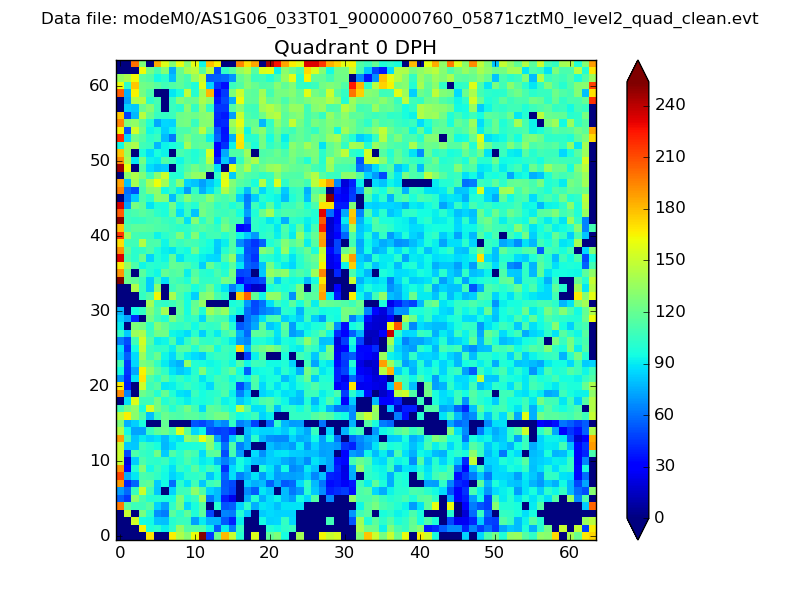 |
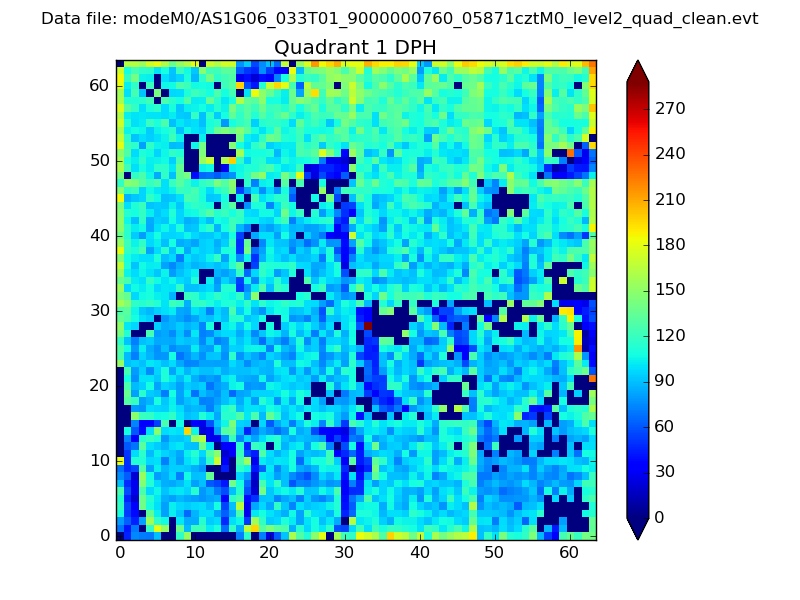 |
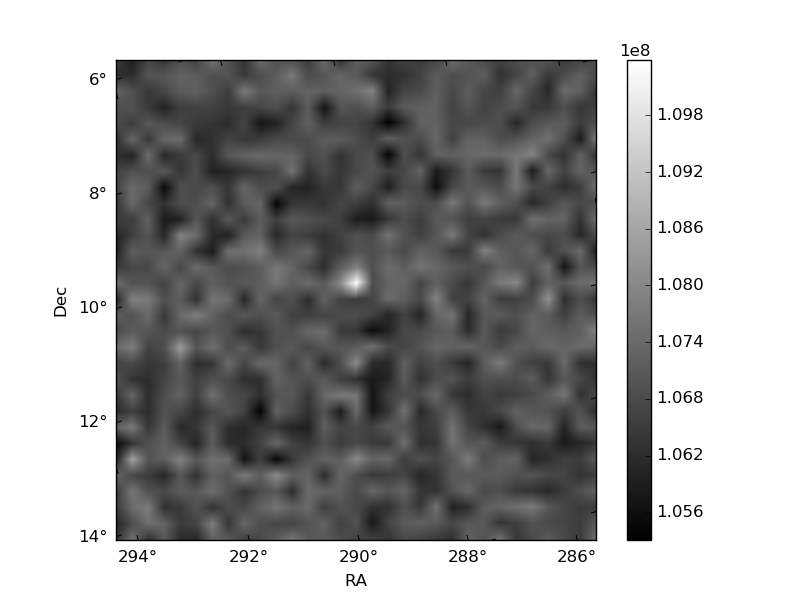
Quadrant B |
|---|---|---|---|
| Quadrant D | 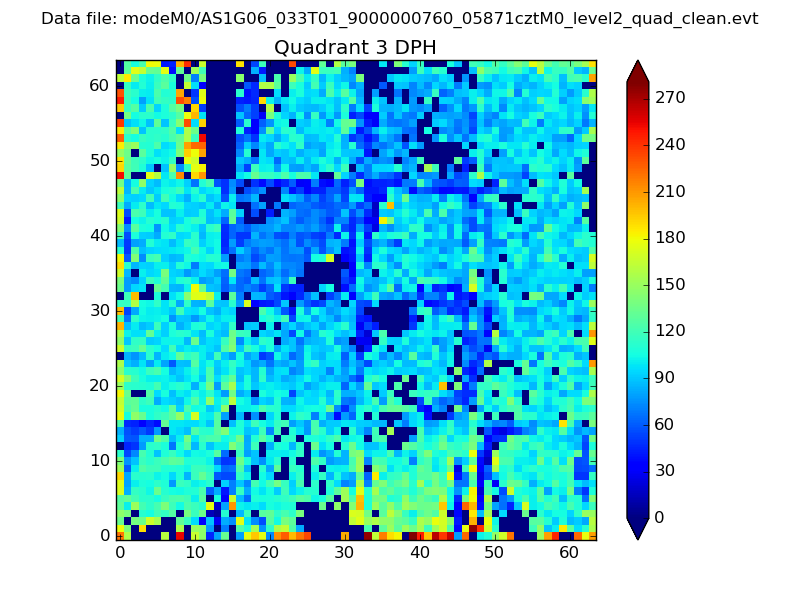 |
 |
Quadrant C |
| Plot type | Count rate plots | Images |
|---|---|---|
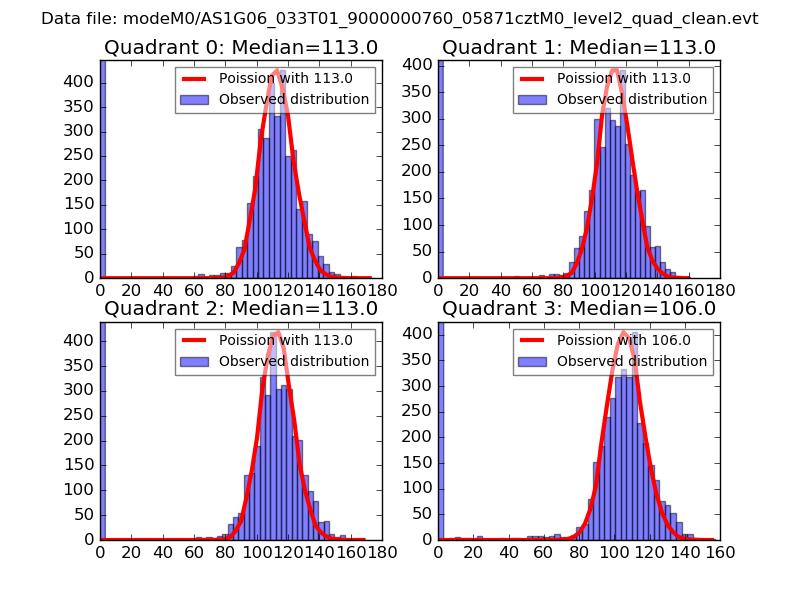
| Comparison with Poisson distribution Blue bars denote a histogram of data divided into 1 sec bins. Red curve is a Poisson curve with rate = median count rate of data. |
 |
 |
| Quadrant-wise count rates Data is divided into 100 sec bins |
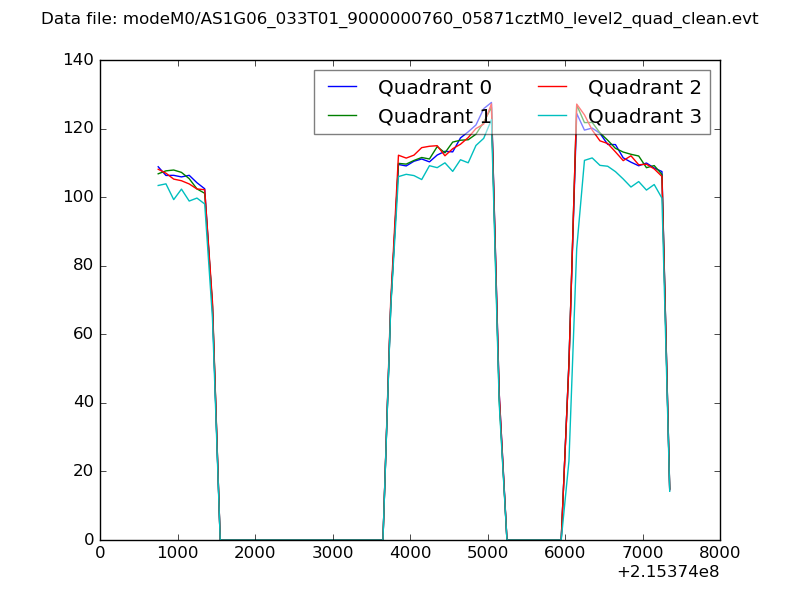 |
|
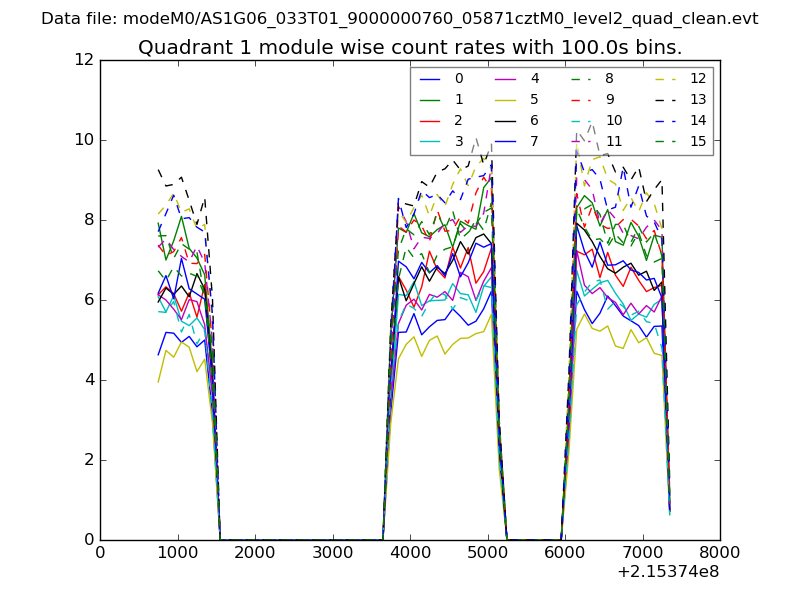
| Module-wise count rates for Quadrant A Data is divided into 100 sec bins |
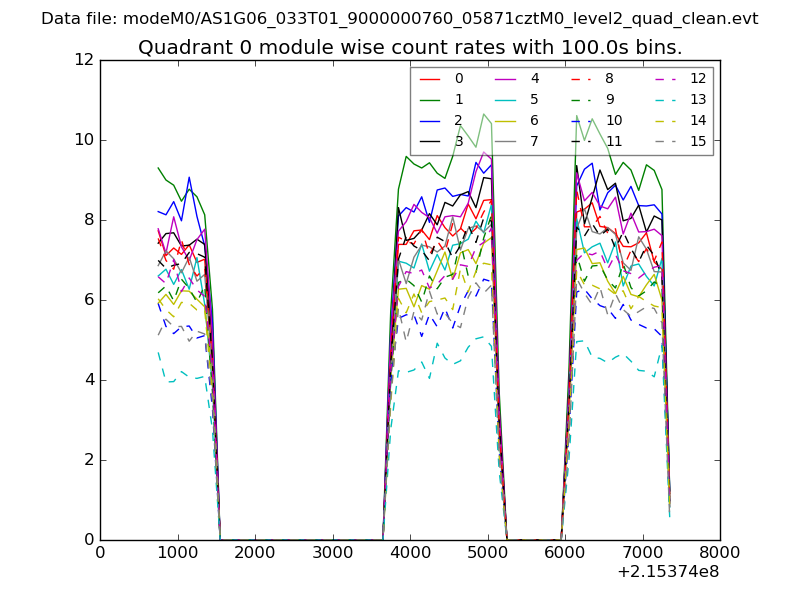 |
 |
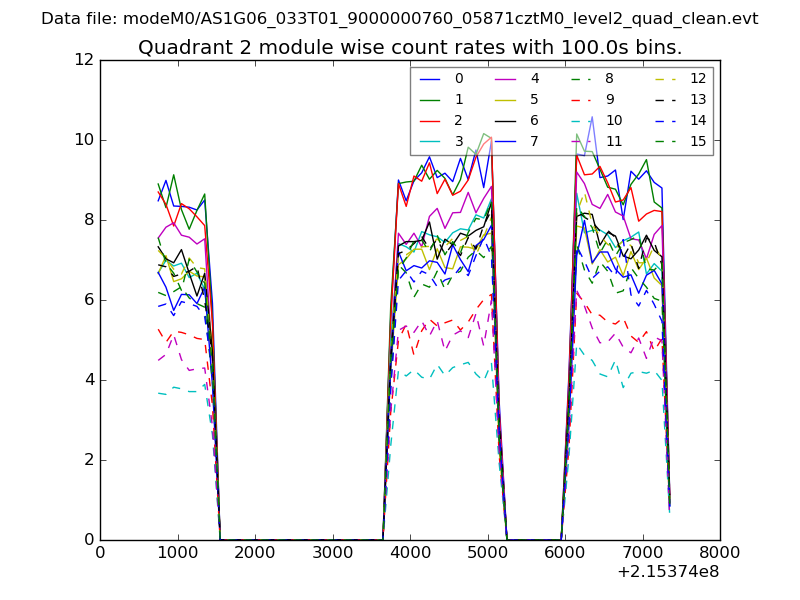
| Module-wise count rates for Quadrant B Data is divided into 100 sec bins |
 |
 |
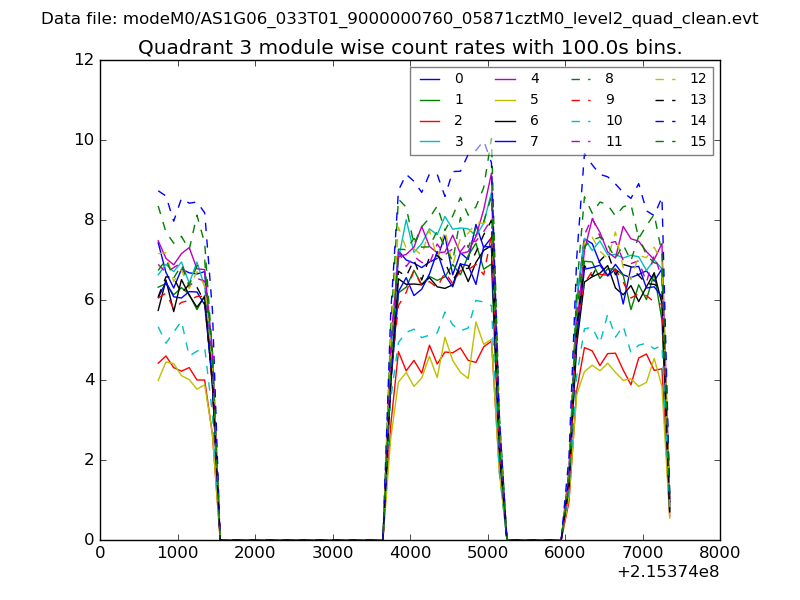
| Module-wise count rates for Quadrant C Data is divided into 100 sec bins |
 |
 |
| Module-wise count rates for Quadrant D Data is divided into 100 sec bins |
 |
 |
| Parameter | Plot |
|---|---|
| CZT HV Monitor | 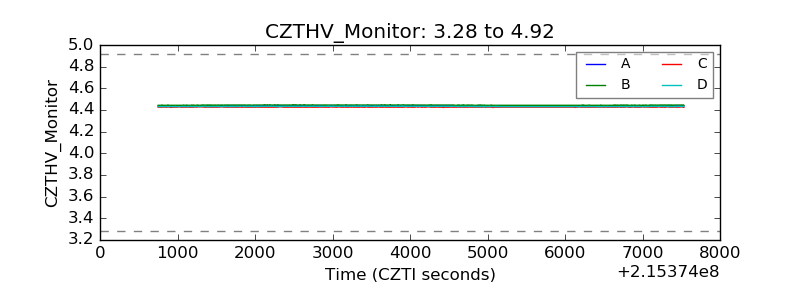 |
| D_VDD |  |
| Temperature 1 | 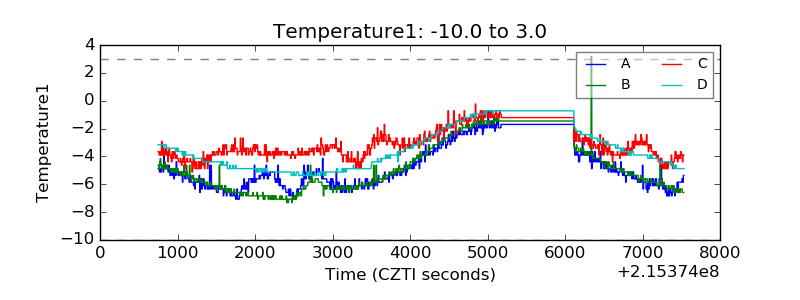 |
| Veto HV Monitor | 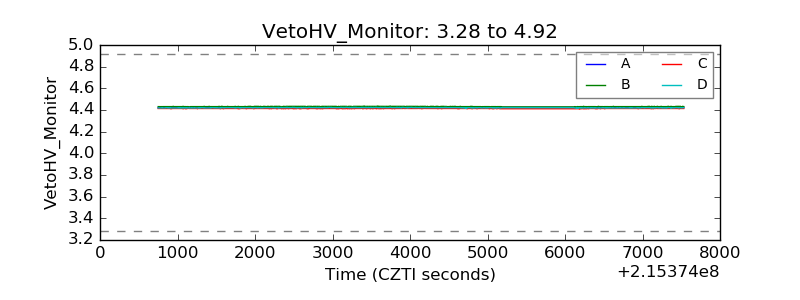 |
| Veto LLD | 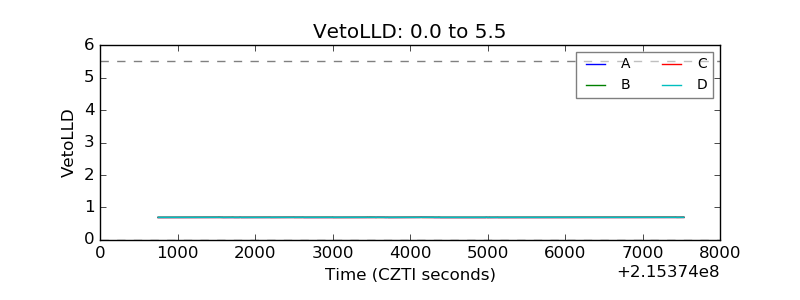 |
| Alpha Counter | 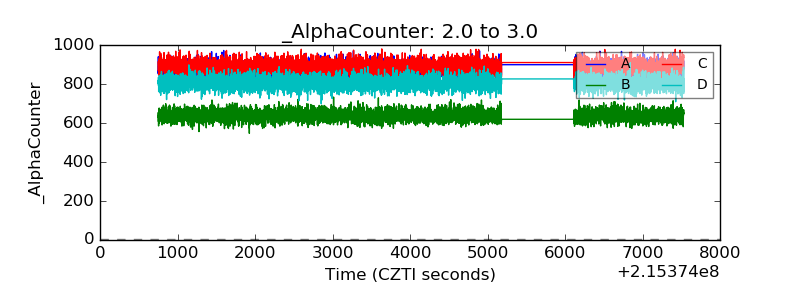 |
| _CPM_Rate | 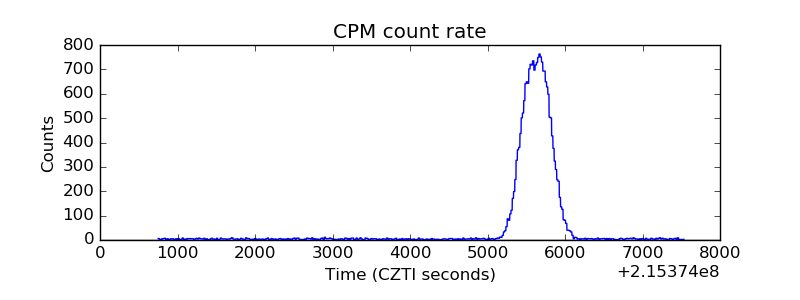 |
| CZT Counter | 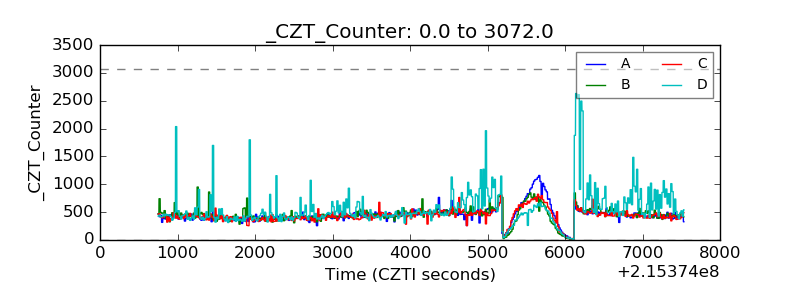 |
| +2.5 Volts monitor |  |
| +5 Volts monitor |  |
| _ROLL_ROT | 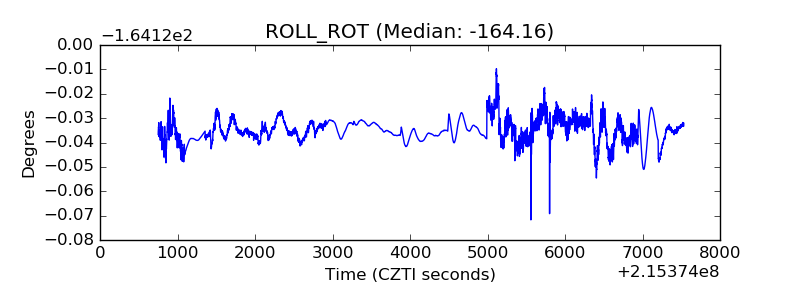 |
| _Roll_DEC | 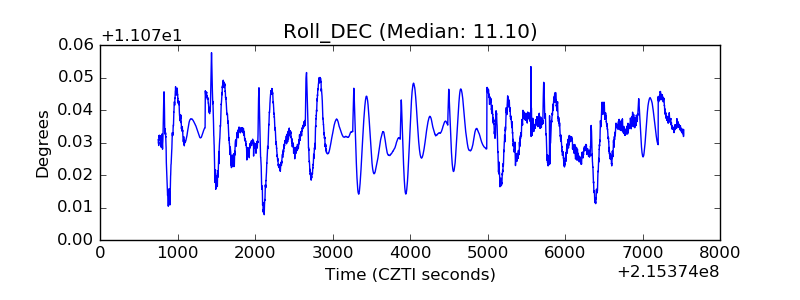 |
| _Roll_RA | 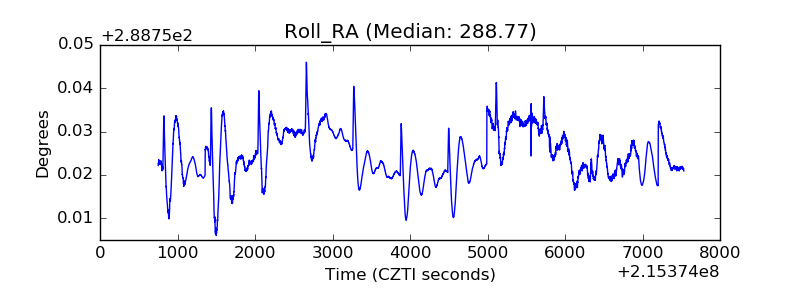 |
| Veto Counter | 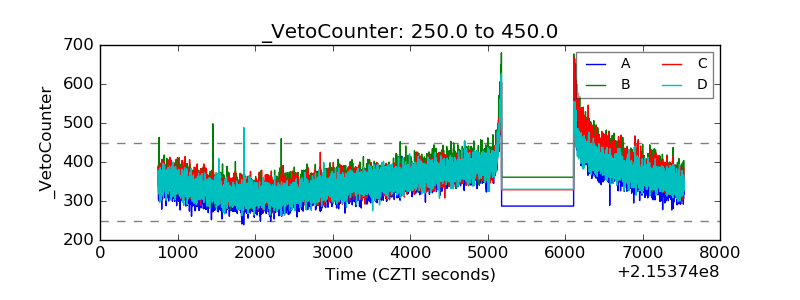 |