| Param | Original file | Final file |
|---|---|---|
| Filename | modeM0/AS1G06_023T01_9000000762cztM0_level2.fits | modeM0/AS1G06_023T01_9000000762cztM0_level2_quad_clean.evt |
| Size (bytes) | 633,533,760 | 721,252,800 |
| Size | 604.2 MB | 687.8 MB |
| Events in quadrant A | 3,853,064 | 4,676,171 |
| Events in quadrant B | 3,750,844 | 4,697,949 |
| Events in quadrant C | 3,764,864 | 4,389,229 |
| Events in quadrant D | 2,880,356 | 3,150,113 |
| Mode SS | |||
|---|---|---|---|
| Quadrant | BADHDUFLAG | Total packets | Discarded packets |
| A | 0 | 1460 | 0 |
| B | 0 | 1460 | 0 |
| C | 0 | 1460 | 0 |
| D | 0 | 1460 | 0 |
| Mode M0 | |||
|---|---|---|---|
| Quadrant | BADHDUFLAG | Total packets | Discarded packets |
| A | 0 | 155181 | 0 |
| B | 0 | 154098 | 0 |
| C | 0 | 147576 | 0 |
| D | 0 | 268834 | 0 |
| Mode M9 | |||
|---|---|---|---|
| Quadrant | BADHDUFLAG | Total packets | Discarded packets |
| A | 0 | 114 | 0 |
| B | 0 | 114 | 0 |
| C | 0 | 114 | 0 |
| D | 0 | 114 | 0 |
| Quadrant | Total seconds | Saturated seconds | Saturation percentage |
|---|---|---|---|
| A | 71911 | 943 | 1.311343% |
| B | 71917 | 1056 | 1.468359% |
| C | 71924 | 571 | 0.793894% |
| D | 71898 | 13440 | 18.693149% |
Noise dominated data is calculated using 1-second bins in cleaned event files. If a bin has >2000 counts, and if more than 50% of those come from <1% of pixels, then it is considered to be noise-dominated and hence unusable.
| Quadrant | # 1 sec bins | Bins with >0 counts | Bins with >2000 counts | High rate bins dominated by noise | Noise dominated (total time) | Noise dominated (detector-on time) | Marked lightcurve |
|---|---|---|---|---|---|---|---|
| A | 83150 | 71936 | 0 | 0 | 0.00% | 0.00% |  |
| B | 83150 | 71939 | 0 | 0 | 0.00% | 0.00% | 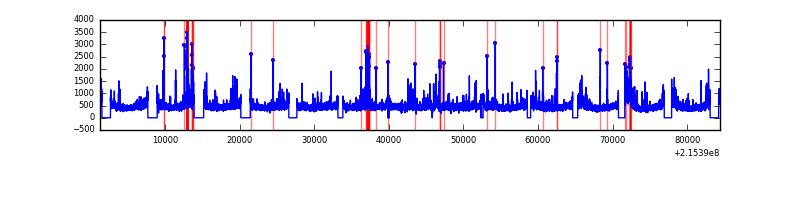 |
| C | 83150 | 71940 | 0 | 0 | 0.00% | 0.00% |  |
| D | 83149 | 71600 | 0 | 0 | 0.00% | 0.00% |  |
Top three noisy pixels from each quadrant. If the there are fewer than three noisy pixels in the level2.evt file, extra rows are filled as -1
| Pixel properties | Quadrant properties | ||||||
|---|---|---|---|---|---|---|---|
| Quadrant | DetID | PixID | Counts | Sigma | Mean | Median | Sigma |
| A | 14 | 188 | 3868 | 11.54 | 999 | 935 | 254.3 |
| A | 0 | 29 | 3807 | 11.3 | 999 | 935 | 254.3 |
| A | 7 | 110 | 3361 | 9.54 | 999 | 935 | 254.3 |
| B | 2 | 9 | 3341 | 12.17 | 988 | 940 | 197.3 |
| B | 12 | 226 | 2699 | 8.92 | 988 | 940 | 197.3 |
| B | 14 | 254 | 2575 | 8.29 | 988 | 940 | 197.3 |
| C | 1 | 81 | 2853 | 7.33 | 994 | 919 | 263.9 |
| C | 1 | 80 | 2845 | 7.3 | 994 | 919 | 263.9 |
| C | 12 | 241 | 2780 | 7.05 | 994 | 919 | 263.9 |
| D | 11 | 82 | 2194 | 6.46 | 823 | 743 | 224.5 |
| D | 3 | 14 | 2187 | 6.43 | 823 | 743 | 224.5 |
| D | 6 | 231 | 2143 | 6.24 | 823 | 743 | 224.5 |
Histogram calculated using DETX and DETY for each event in the final _common_clean file
| Quadrant A | 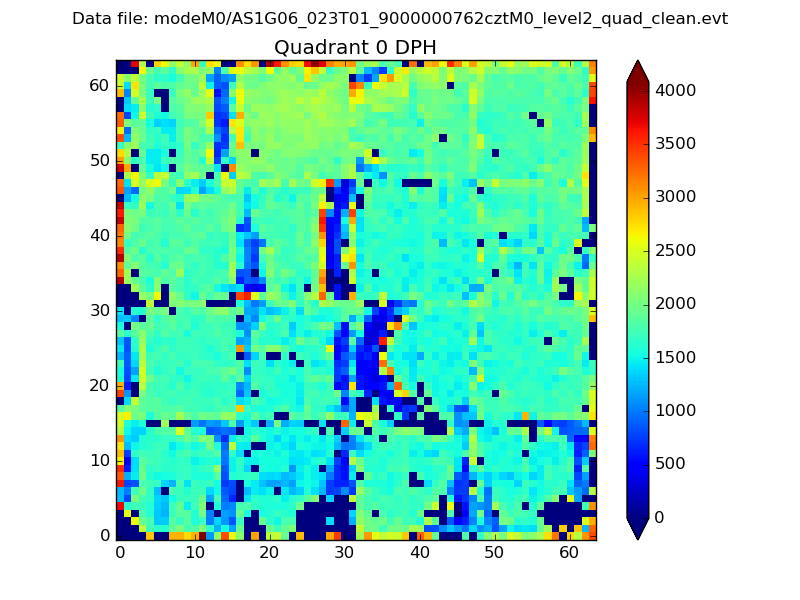 |
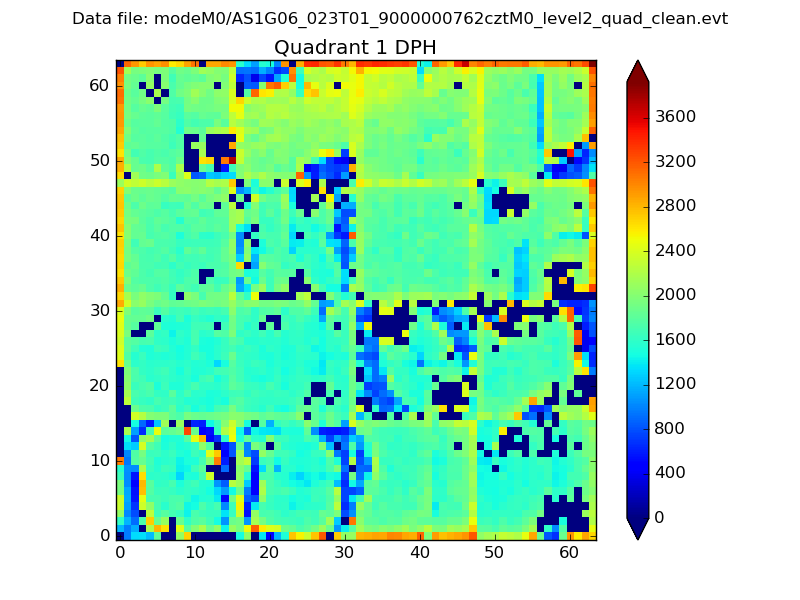 |
Quadrant B |
|---|---|---|---|
| Quadrant D | 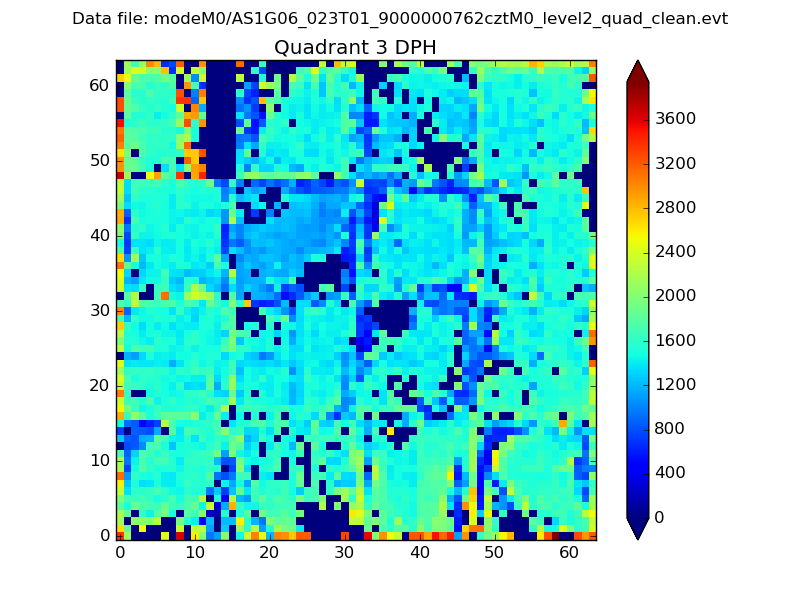 |
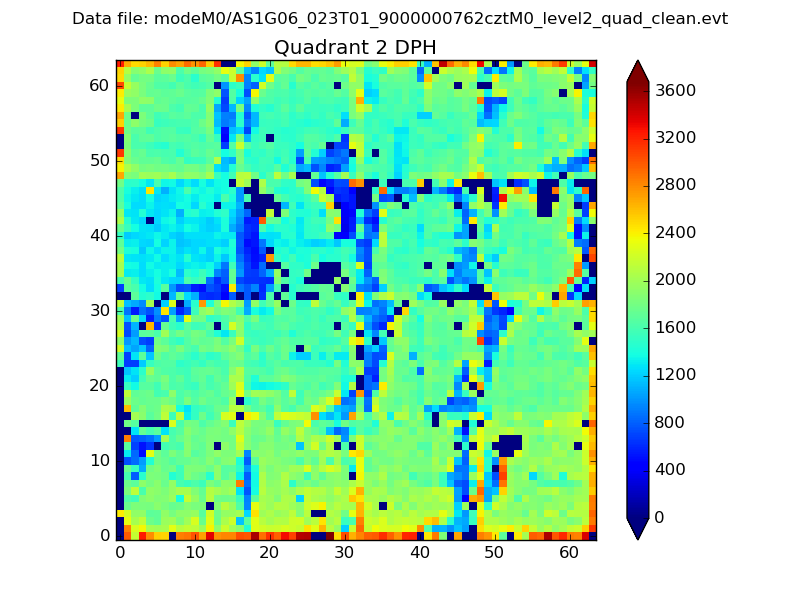 |
Quadrant C |
| Plot type | Count rate plots | Images |
|---|---|---|
| Comparison with Poisson distribution Blue bars denote a histogram of data divided into 1 sec bins. Red curve is a Poisson curve with rate = median count rate of data. |
 |
 |
| Quadrant-wise count rates Data is divided into 100 sec bins |
 |
|
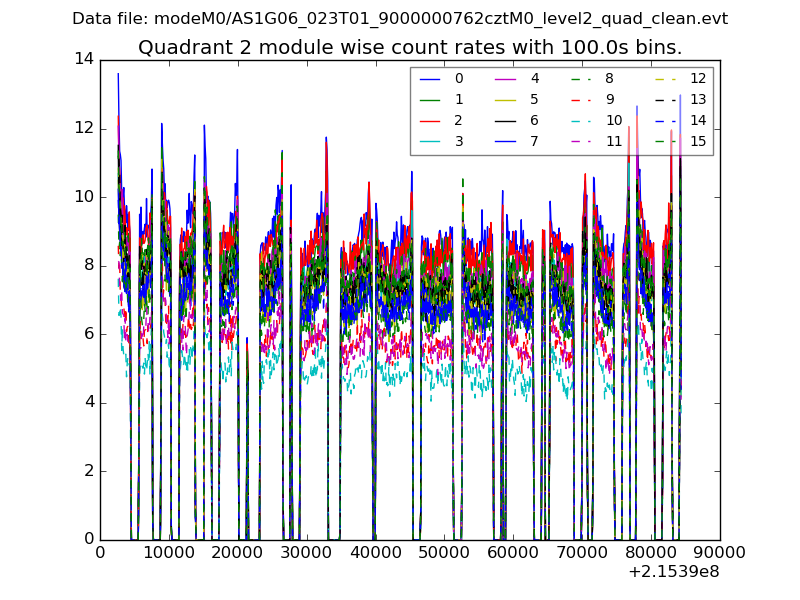
| Module-wise count rates for Quadrant A Data is divided into 100 sec bins |
 |
 |
| Module-wise count rates for Quadrant B Data is divided into 100 sec bins |
 |
 |
| Module-wise count rates for Quadrant C Data is divided into 100 sec bins |
 |
 |
| Module-wise count rates for Quadrant D Data is divided into 100 sec bins |
 |
 |
| Parameter | Plot |
|---|---|
| CZT HV Monitor |  |
| D_VDD |  |
| Temperature 1 | 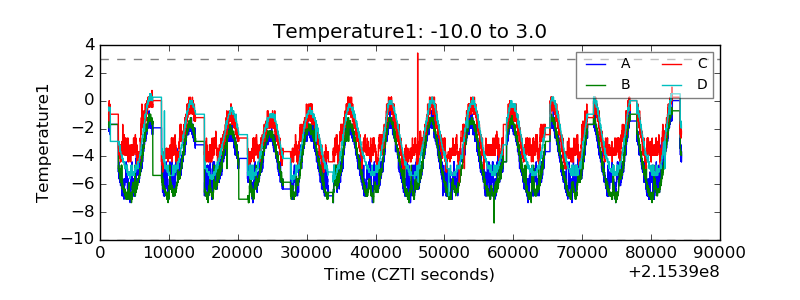 |
| Veto HV Monitor |  |
| Veto LLD | 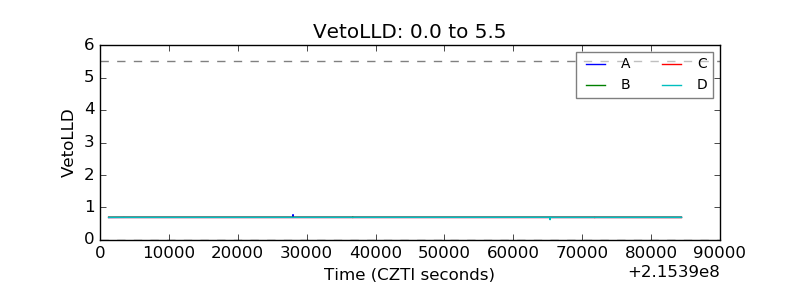 |
| Alpha Counter |  |
| _CPM_Rate |  |
| CZT Counter |  |
| +2.5 Volts monitor |  |
| +5 Volts monitor |  |
| _ROLL_ROT |  |
| _Roll_DEC | 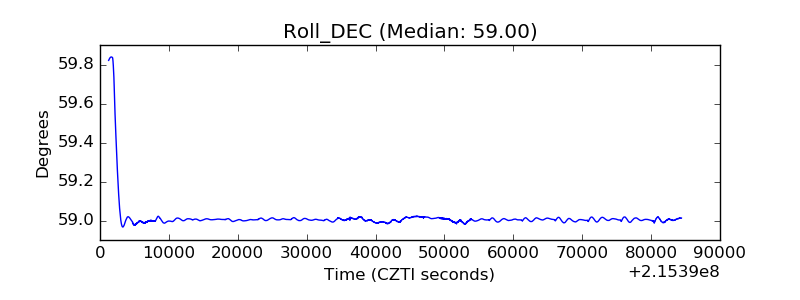 |
| _Roll_RA |  |
| Veto Counter |  |