| Param | Original file | Final file |
|---|---|---|
| Filename | modeM0/AS1G06_023T01_9000000762_05874cztM0_level2.evt | modeM0/AS1G06_023T01_9000000762_05874cztM0_level2_quad_clean.evt |
| Size (bytes) | 129,107,520 | 25,637,760 |
| Size | 123.1 MB | 24.5 MB |
| Events in quadrant A | 753,104 | 169,563 |
| Events in quadrant B | 812,716 | 173,579 |
| Events in quadrant C | 751,124 | 167,000 |
| Events in quadrant D | 1,486,946 | 152,973 |
| Mode SS | |||
|---|---|---|---|
| Quadrant | BADHDUFLAG | Total packets | Discarded packets |
| A | 0 | 32 | 0 |
| B | 0 | 32 | 0 |
| C | 0 | 32 | 0 |
| D | 0 | 32 | 0 |
| Mode M0 | |||
|---|---|---|---|
| Quadrant | BADHDUFLAG | Total packets | Discarded packets |
| A | 0 | 3221 | 2 |
| B | 0 | 3397 | 1 |
| C | 0 | 3197 | 1 |
| D | 0 | 5479 | 1 |
| Mode M9 | |||
|---|---|---|---|
| Quadrant | BADHDUFLAG | Total packets | Discarded packets |
| A | 0 | 11 | 0 |
| B | 0 | 11 | 0 |
| C | 0 | 11 | 0 |
| D | 0 | 11 | 0 |
| Quadrant | Total seconds | Saturated seconds | Saturation percentage |
|---|---|---|---|
| A | 1519 | 15 | 0.987492% |
| B | 1519 | 35 | 2.304147% |
| C | 1519 | 15 | 0.987492% |
| D | 1519 | 73 | 4.805793% |
Noise dominated data is calculated using 1-second bins in cleaned event files. If a bin has >2000 counts, and if more than 50% of those come from <1% of pixels, then it is considered to be noise-dominated and hence unusable.
| Quadrant | # 1 sec bins | Bins with >0 counts | Bins with >2000 counts | High rate bins dominated by noise | Noise dominated (total time) | Noise dominated (detector-on time) | Marked lightcurve |
|---|---|---|---|---|---|---|---|
| A | 2674 | 1520 | 0 | 0 | 0.00% | 0.00% | 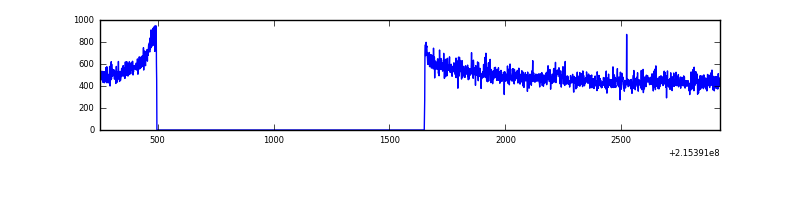 |
| B | 2674 | 1520 | 0 | 0 | 0.00% | 0.00% | 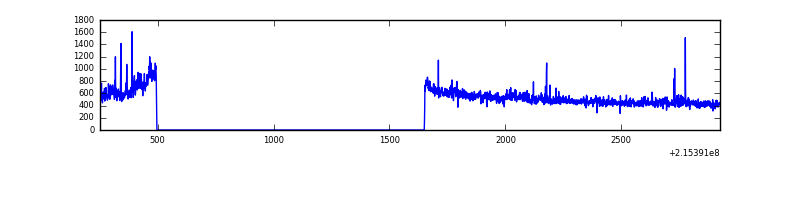 |
| C | 2674 | 1520 | 0 | 0 | 0.00% | 0.00% | 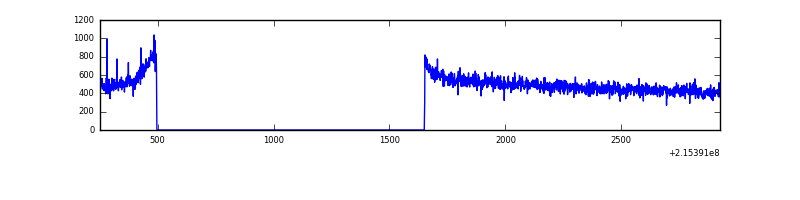 |
| D | 2674 | 1520 | 51 | 51 | 1.91% | 3.36% | 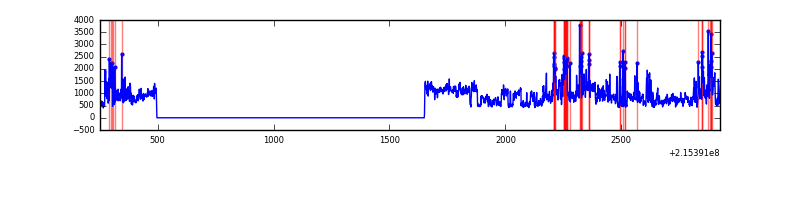 |
Top three noisy pixels from each quadrant. If the there are fewer than three noisy pixels in the level2.evt file, extra rows are filled as -1
| Pixel properties | Quadrant properties | ||||||
|---|---|---|---|---|---|---|---|
| Quadrant | DetID | PixID | Counts | Sigma | Mean | Median | Sigma |
| A | 8 | 6 | 7992 | 191.4 | 191 | 187 | 40.8 |
| A | 15 | 236 | 2689 | 61.35 | 191 | 187 | 40.8 |
| A | 8 | 5 | 2612 | 59.47 | 191 | 187 | 40.8 |
| B | 0 | 214 | 21018 | 530.55 | 197 | 193 | 39.3 |
| B | 15 | 204 | 17440 | 439.39 | 197 | 193 | 39.3 |
| B | 4 | 48 | 4074 | 98.87 | 197 | 193 | 39.3 |
| C | 1 | 16 | 3123 | 63.56 | 191 | 191 | 46.1 |
| C | 13 | 61 | 1513 | 28.66 | 191 | 191 | 46.1 |
| C | 7 | 159 | 566 | 8.13 | 191 | 191 | 46.1 |
| D | 13 | 105 | 359505 | 7653.88 | 185 | 179 | 46.9 |
| D | 2 | 152 | 178824 | 3805.26 | 185 | 179 | 46.9 |
| D | 2 | 136 | 126272 | 2685.86 | 185 | 179 | 46.9 |
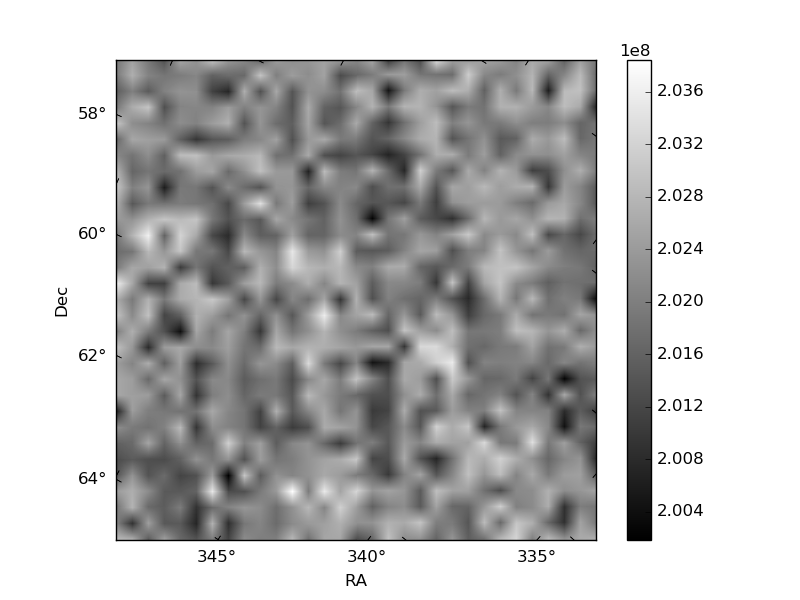
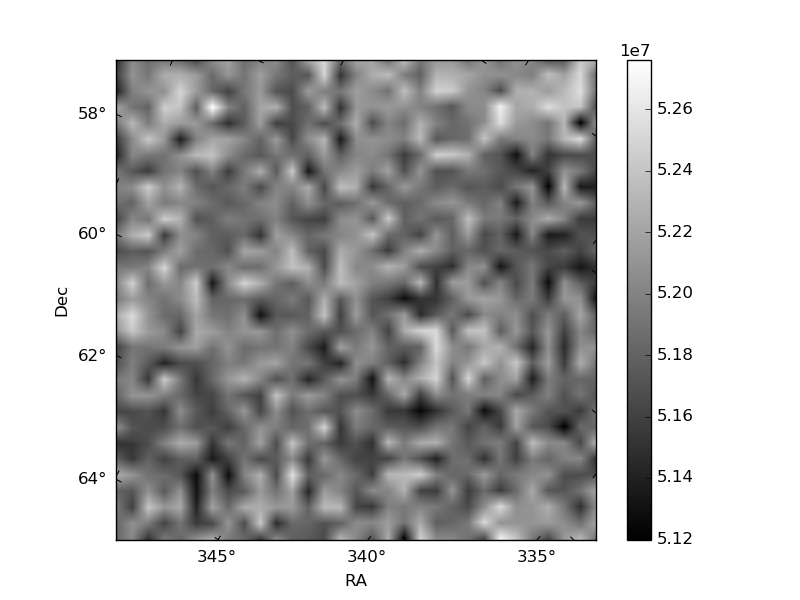
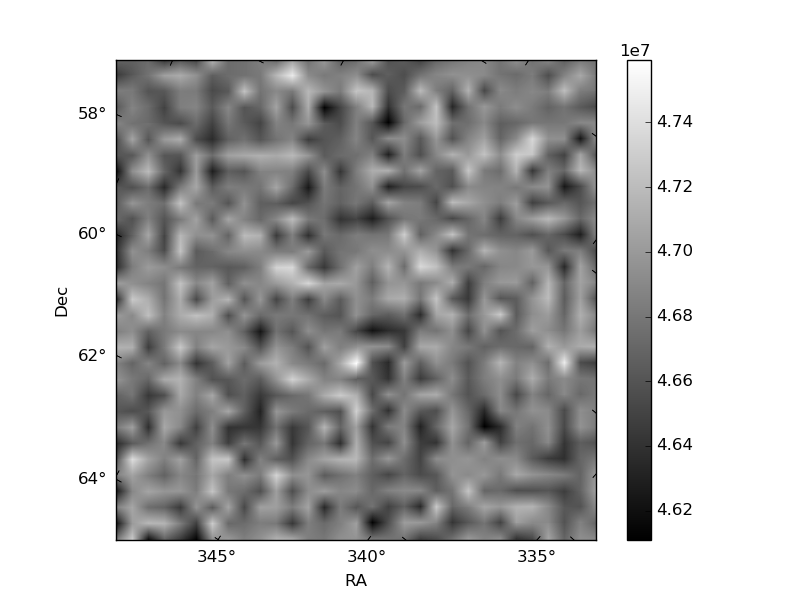
Histogram calculated using DETX and DETY for each event in the final _common_clean file
| Quadrant A | 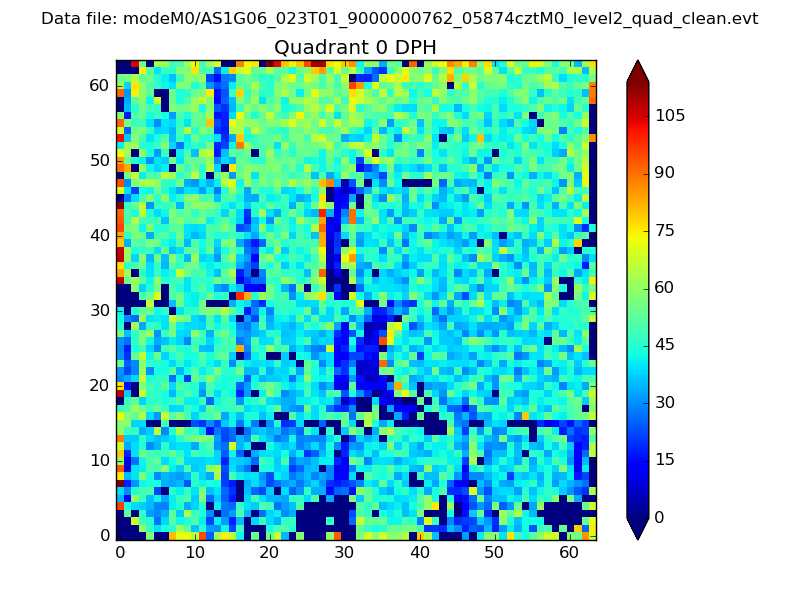 |
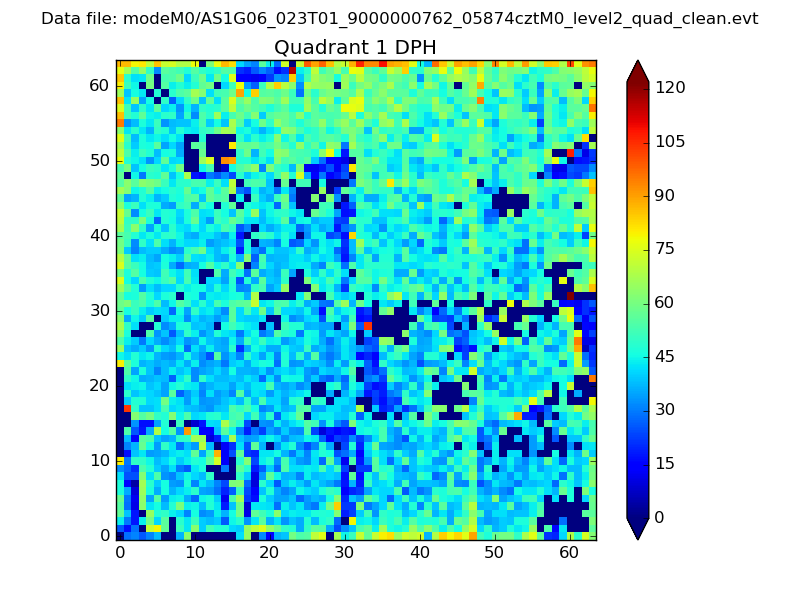 |
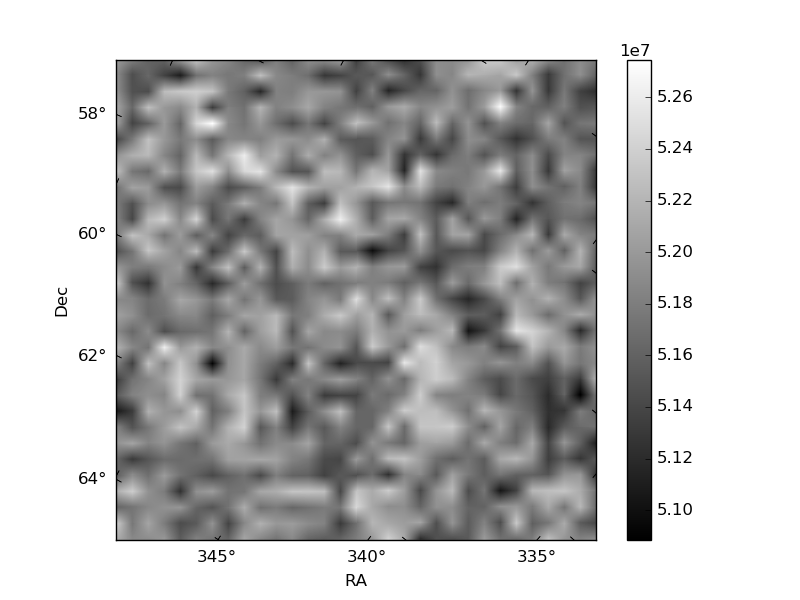
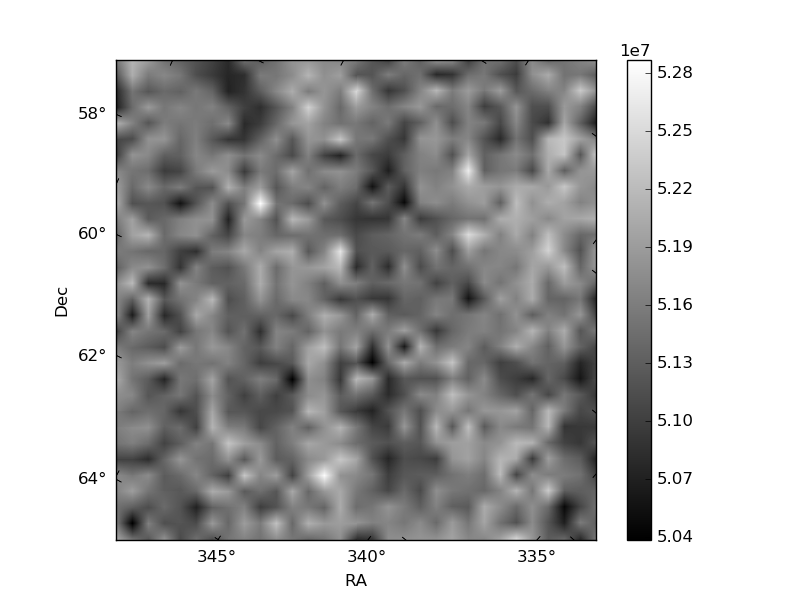
Quadrant B |
|---|---|---|---|
| Quadrant D | 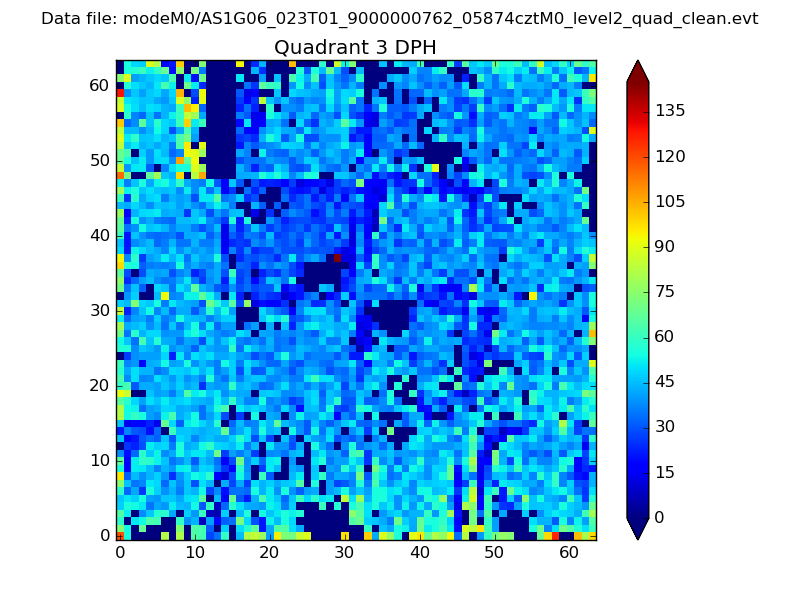 |
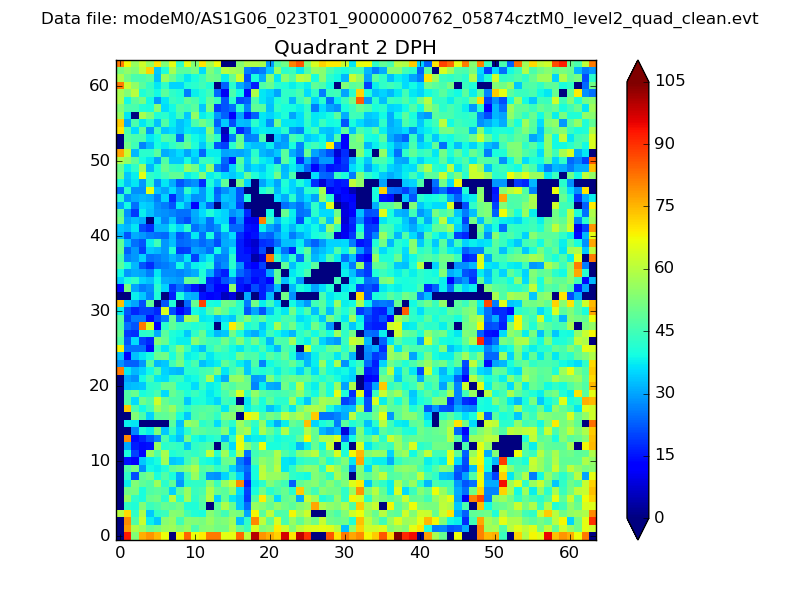 |
Quadrant C |
| Plot type | Count rate plots | Images |
|---|---|---|
| Comparison with Poisson distribution Blue bars denote a histogram of data divided into 1 sec bins. Red curve is a Poisson curve with rate = median count rate of data. |
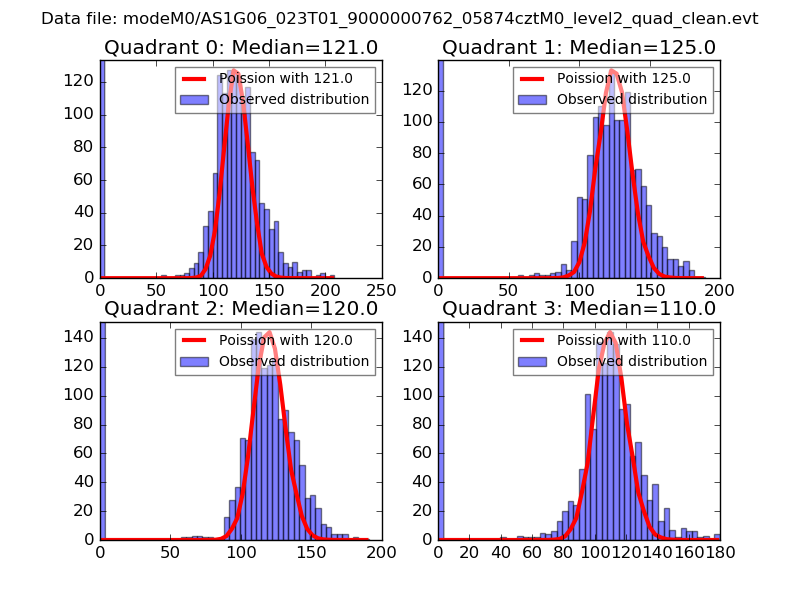 |
 |
| Quadrant-wise count rates Data is divided into 100 sec bins |
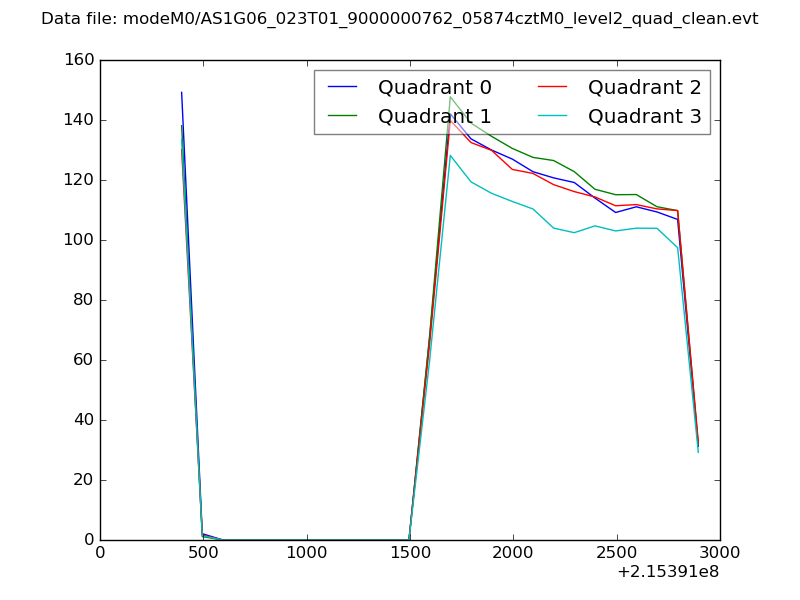 |
|
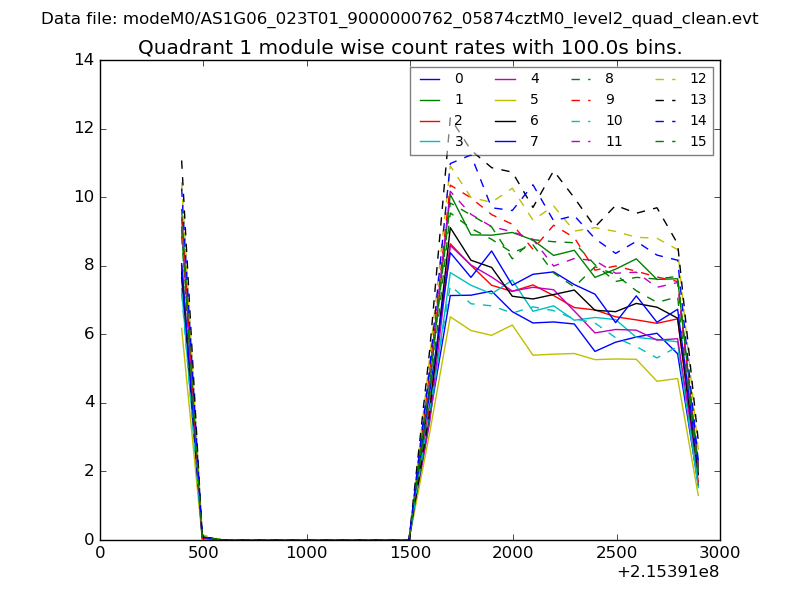
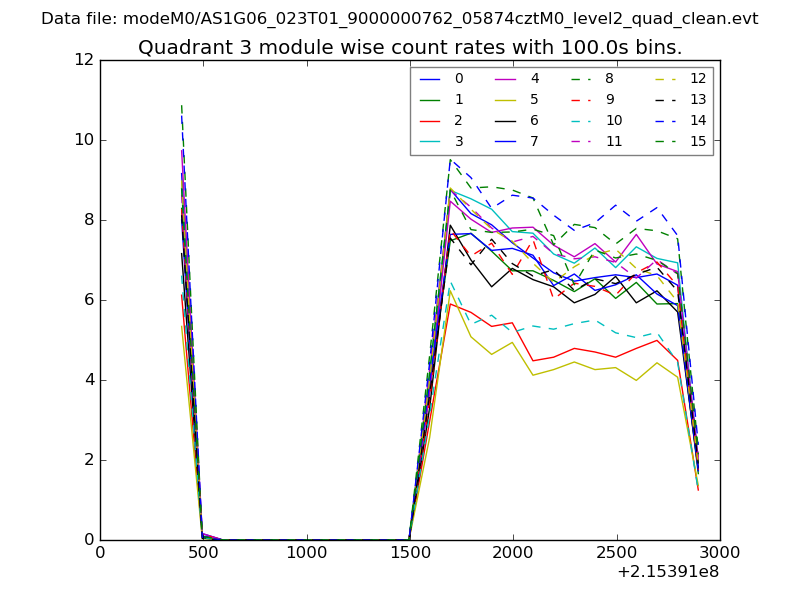
| Module-wise count rates for Quadrant A Data is divided into 100 sec bins |
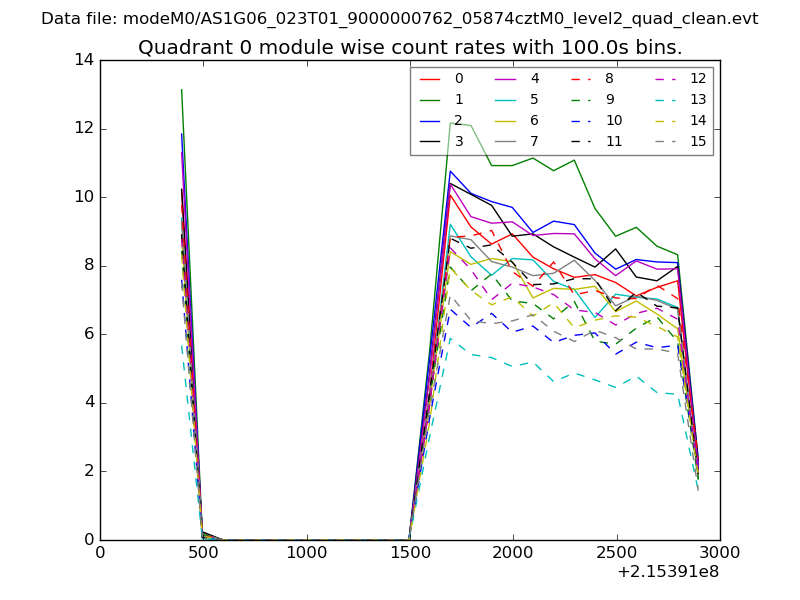 |
 |
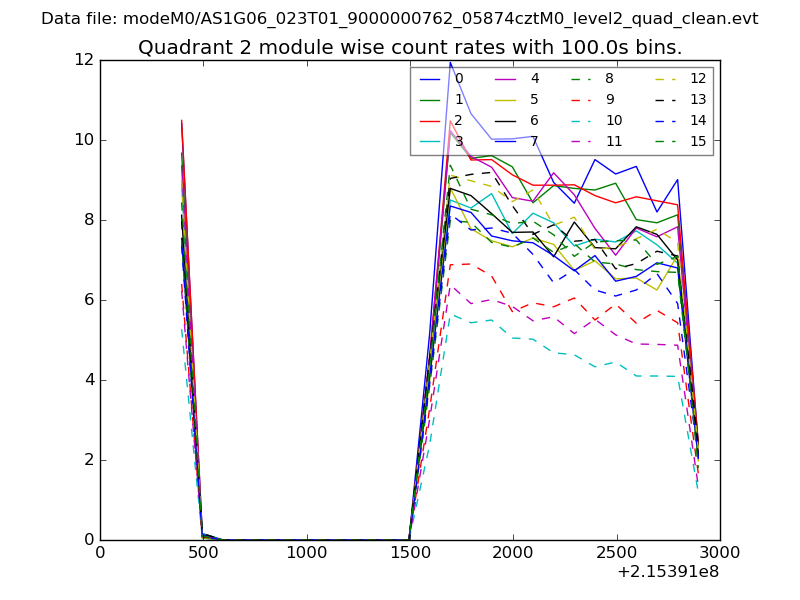
| Module-wise count rates for Quadrant B Data is divided into 100 sec bins |
 |
 |
| Module-wise count rates for Quadrant C Data is divided into 100 sec bins |
 |
 |
| Module-wise count rates for Quadrant D Data is divided into 100 sec bins |
 |
 |
| Parameter | Plot |
|---|---|
| CZT HV Monitor | 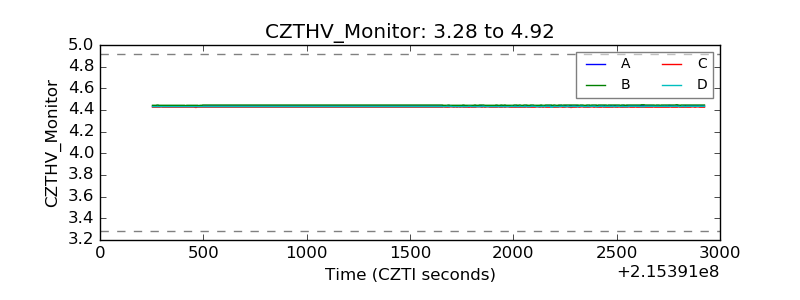 |
| D_VDD | 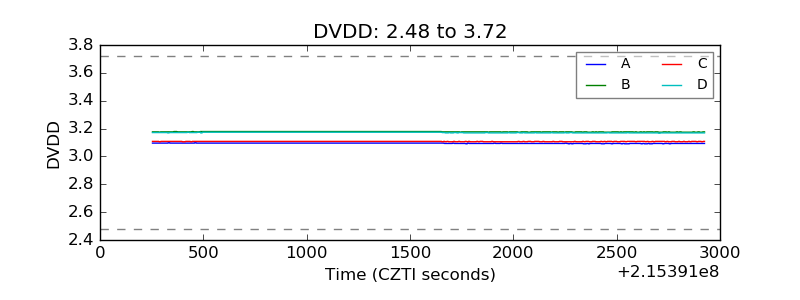 |
| Temperature 1 |  |
| Veto HV Monitor | 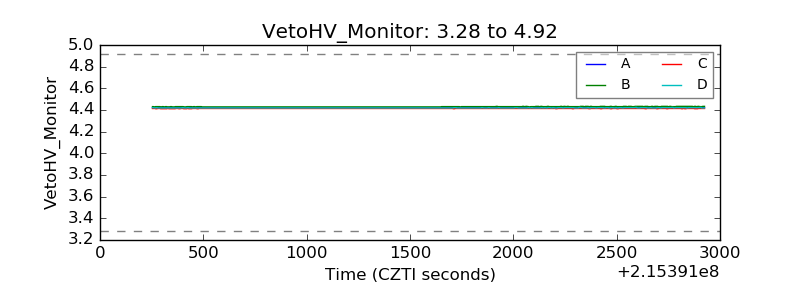 |
| Veto LLD | 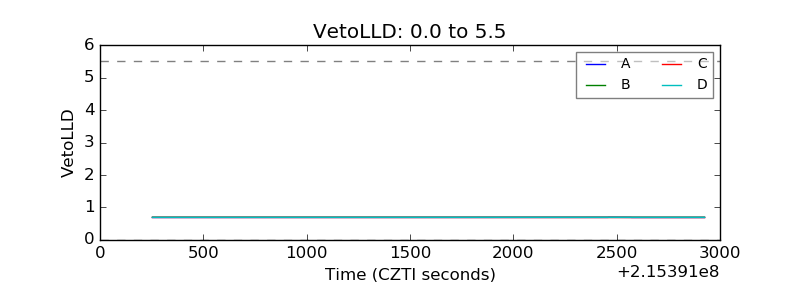 |
| Alpha Counter | 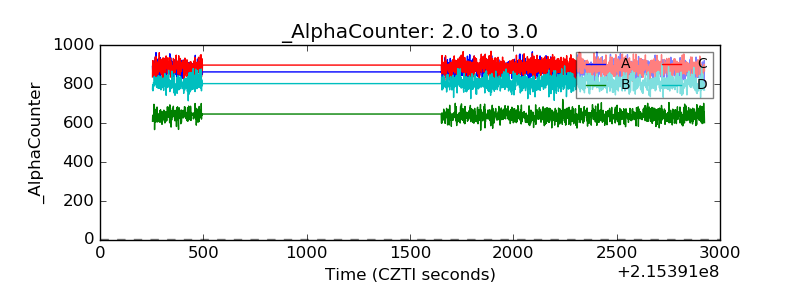 |
| _CPM_Rate | 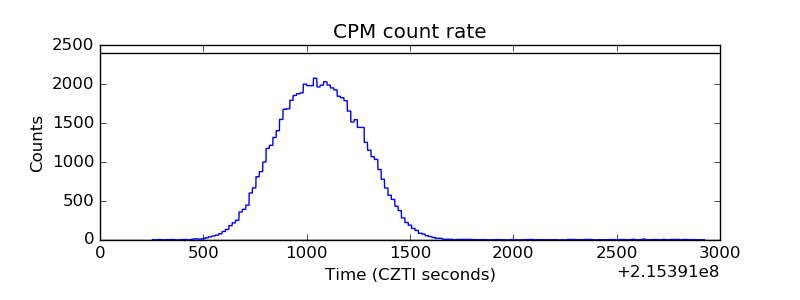 |
| CZT Counter | 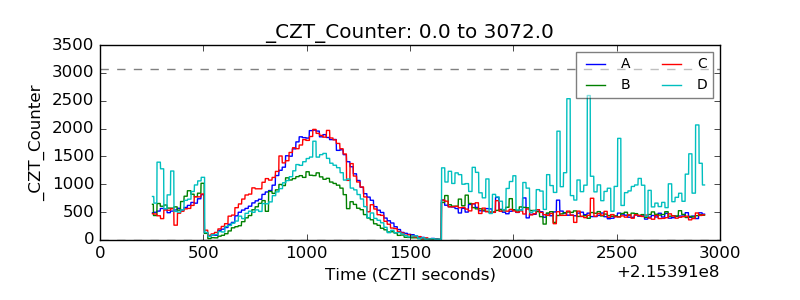 |
| +2.5 Volts monitor |  |
| +5 Volts monitor |  |
| _ROLL_ROT |  |
| _Roll_DEC |  |
| _Roll_RA | 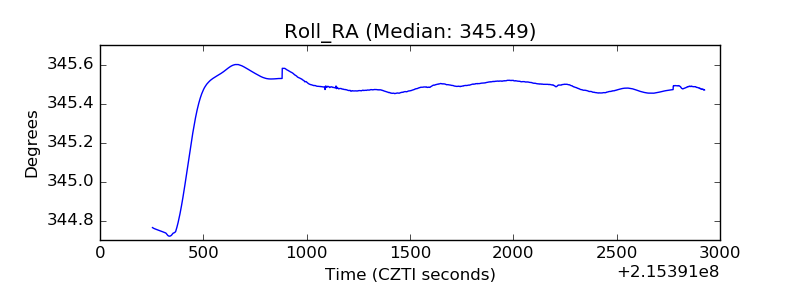 |
| Veto Counter | 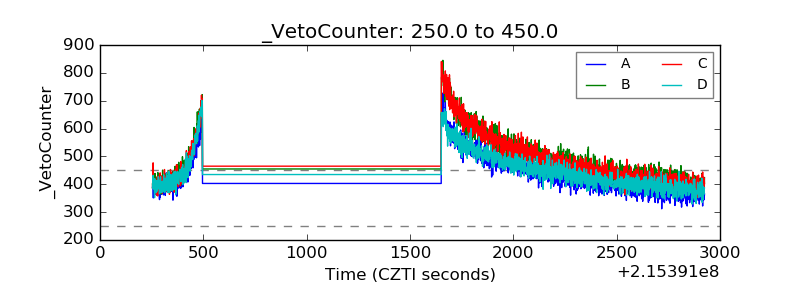 |