| Param | Original file | Final file |
|---|---|---|
| Filename | modeM0/AS1G06_023T01_9000000762_05877cztM0_level2.evt | modeM0/AS1G06_023T01_9000000762_05877cztM0_level2_quad_clean.evt |
| Size (bytes) | 474,459,840 | 78,304,320 |
| Size | 452.5 MB | 74.7 MB |
| Events in quadrant A | 2,999,301 | 497,820 |
| Events in quadrant B | 3,105,132 | 508,646 |
| Events in quadrant C | 2,845,273 | 487,321 |
| Events in quadrant D | 4,978,403 | 424,443 |
| Mode SS | |||
|---|---|---|---|
| Quadrant | BADHDUFLAG | Total packets | Discarded packets |
| A | 0 | 132 | 0 |
| B | 0 | 132 | 0 |
| C | 0 | 132 | 0 |
| D | 0 | 132 | 0 |
| Mode M0 | |||
|---|---|---|---|
| Quadrant | BADHDUFLAG | Total packets | Discarded packets |
| A | 0 | 13511 | 3 |
| B | 0 | 13613 | 2 |
| C | 0 | 13212 | 2 |
| D | 0 | 19494 | 2 |
| Mode M9 | |||
|---|---|---|---|
| Quadrant | BADHDUFLAG | Total packets | Discarded packets |
| A | 0 | 23 | 0 |
| B | 0 | 23 | 0 |
| C | 0 | 23 | 0 |
| D | 0 | 24 | 0 |
| Quadrant | Total seconds | Saturated seconds | Saturation percentage |
|---|---|---|---|
| A | 6487 | 40 | 0.616618% |
| B | 6487 | 42 | 0.647449% |
| C | 6487 | 26 | 0.400802% |
| D | 6487 | 593 | 9.141360% |
Noise dominated data is calculated using 1-second bins in cleaned event files. If a bin has >2000 counts, and if more than 50% of those come from <1% of pixels, then it is considered to be noise-dominated and hence unusable.
| Quadrant | # 1 sec bins | Bins with >0 counts | Bins with >2000 counts | High rate bins dominated by noise | Noise dominated (total time) | Noise dominated (detector-on time) | Marked lightcurve |
|---|---|---|---|---|---|---|---|
| A | 7757 | 6488 | 15 | 15 | 0.19% | 0.23% | 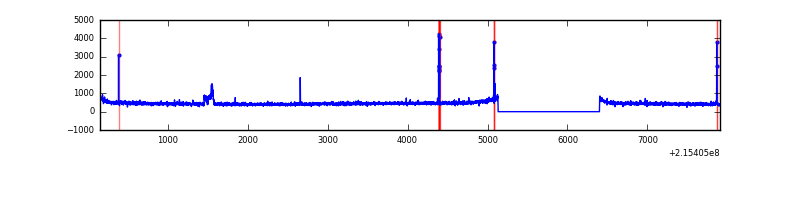 |
| B | 7757 | 6488 | 1 | 1 | 0.01% | 0.02% | 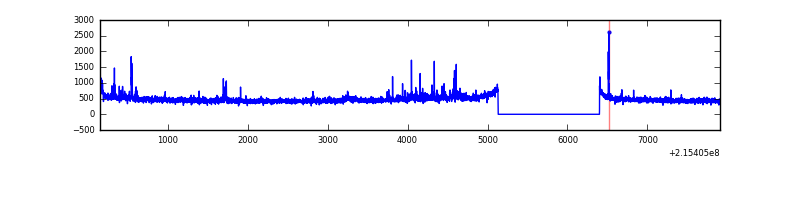 |
| C | 7757 | 6488 | 0 | 0 | 0.00% | 0.00% | 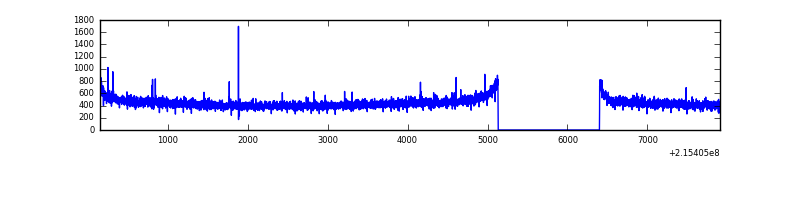 |
| D | 7757 | 6488 | 456 | 456 | 5.88% | 7.03% | 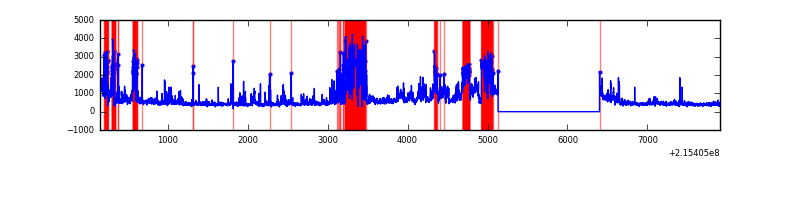 |
Top three noisy pixels from each quadrant. If the there are fewer than three noisy pixels in the level2.evt file, extra rows are filled as -1
| Pixel properties | Quadrant properties | ||||||
|---|---|---|---|---|---|---|---|
| Quadrant | DetID | PixID | Counts | Sigma | Mean | Median | Sigma |
| A | 15 | 236 | 111562 | 725.18 | 747 | 730 | 152.8 |
| A | 8 | 6 | 11707 | 71.82 | 747 | 730 | 152.8 |
| A | 0 | 226 | 7292 | 42.94 | 747 | 730 | 152.8 |
| B | 4 | 81 | 43089 | 294.6 | 763 | 747 | 143.7 |
| B | 0 | 214 | 42889 | 293.21 | 763 | 747 | 143.7 |
| B | 0 | 219 | 20483 | 137.32 | 763 | 747 | 143.7 |
| C | 1 | 16 | 9985 | 55.6 | 725 | 727 | 166.5 |
| C | 12 | 4 | 6177 | 32.73 | 725 | 727 | 166.5 |
| C | 13 | 61 | 5797 | 30.45 | 725 | 727 | 166.5 |
| D | 2 | 152 | 2044099 | 12130.35 | 683 | 663 | 168.5 |
| D | 2 | 136 | 265691 | 1573.27 | 683 | 663 | 168.5 |
| D | 2 | 14 | 44073 | 257.69 | 683 | 663 | 168.5 |
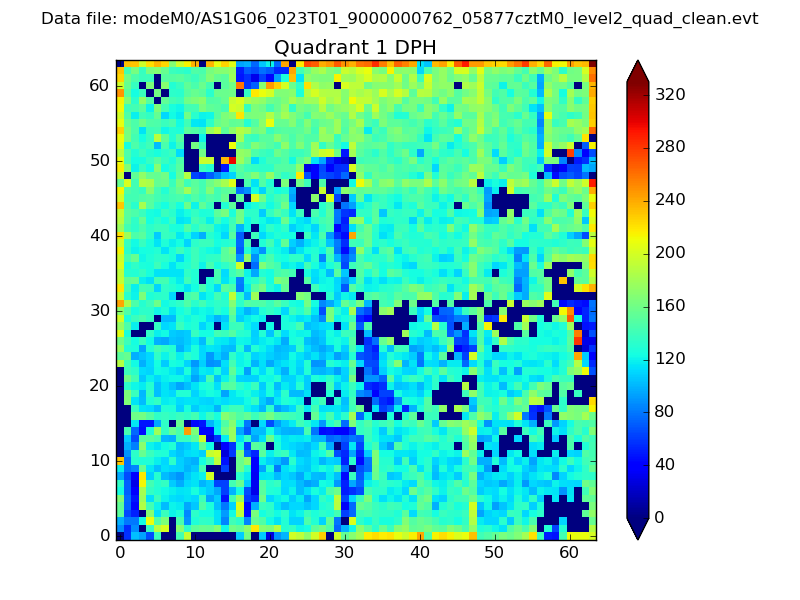
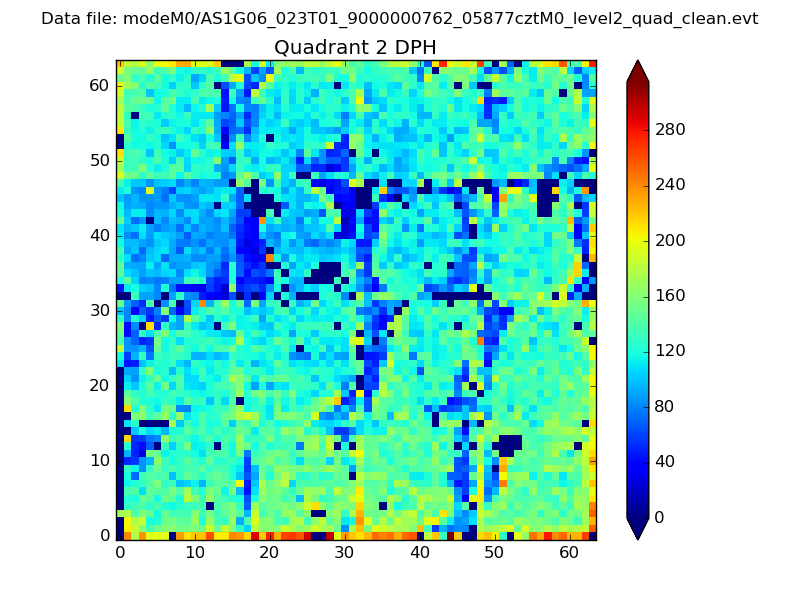
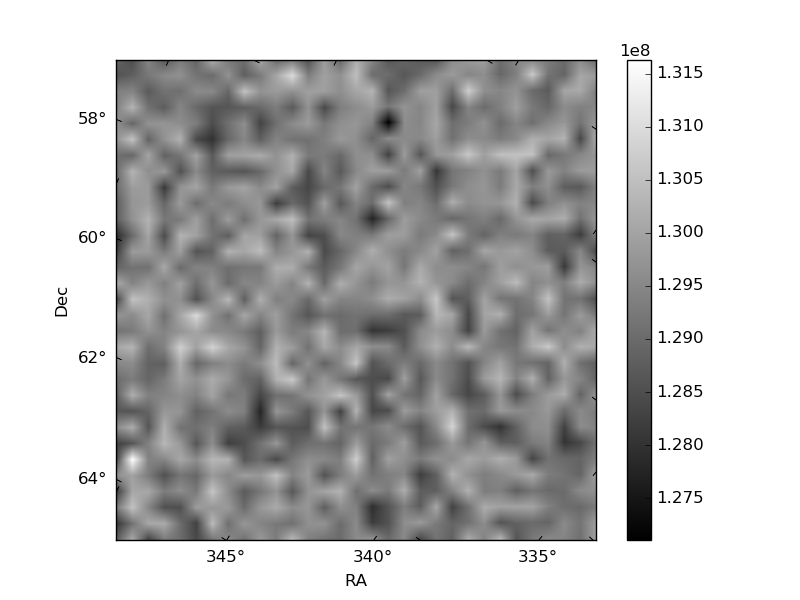
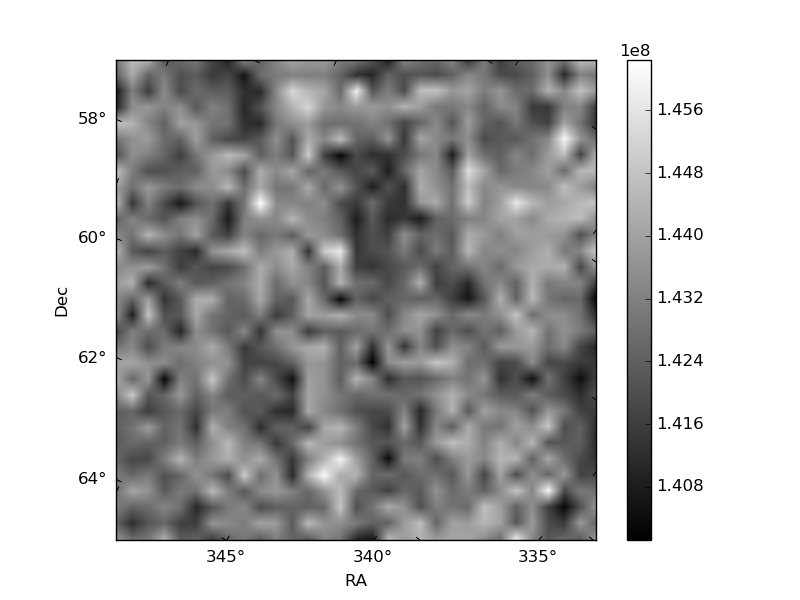
Histogram calculated using DETX and DETY for each event in the final _common_clean file
| Quadrant A |  |
 |
Quadrant B |
|---|---|---|---|
| Quadrant D | 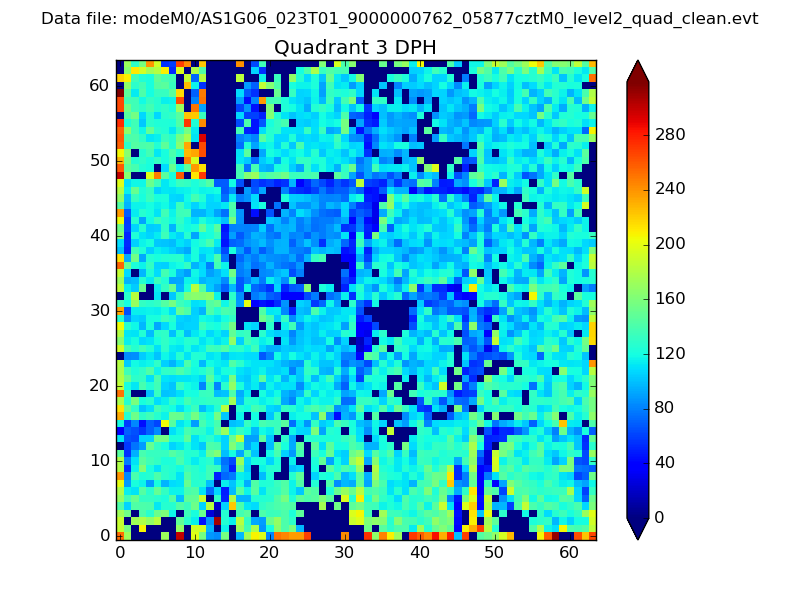 |
 |
Quadrant C |
| Plot type | Count rate plots | Images |
|---|---|---|
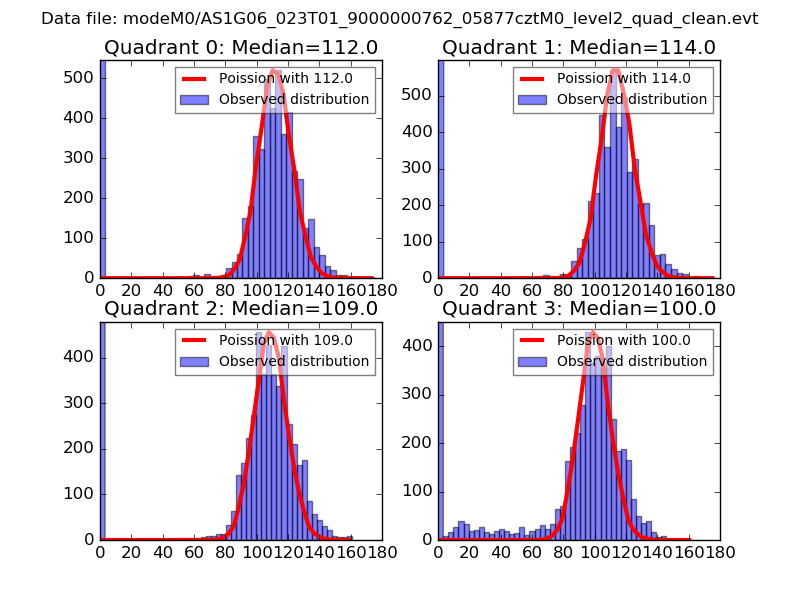
| Comparison with Poisson distribution Blue bars denote a histogram of data divided into 1 sec bins. Red curve is a Poisson curve with rate = median count rate of data. |
 |
 |
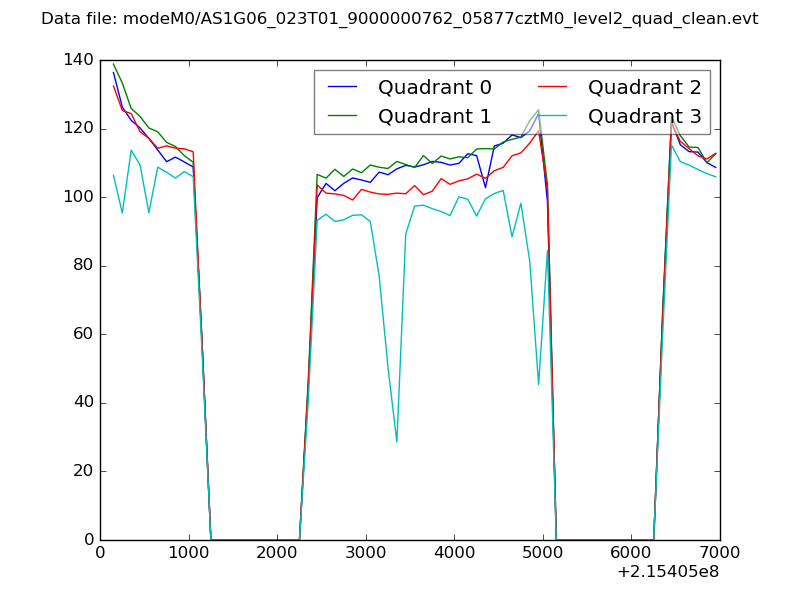
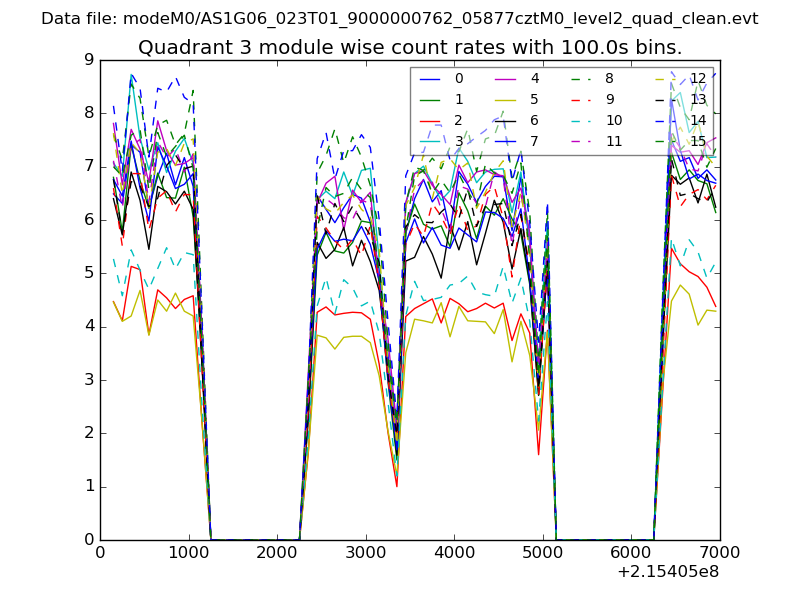
| Quadrant-wise count rates Data is divided into 100 sec bins |
 |
|
| Module-wise count rates for Quadrant A Data is divided into 100 sec bins |
 |
 |
| Module-wise count rates for Quadrant B Data is divided into 100 sec bins |
 |
 |
| Module-wise count rates for Quadrant C Data is divided into 100 sec bins |
 |
 |
| Module-wise count rates for Quadrant D Data is divided into 100 sec bins |
 |
 |
| Parameter | Plot |
|---|---|
| CZT HV Monitor |  |
| D_VDD | 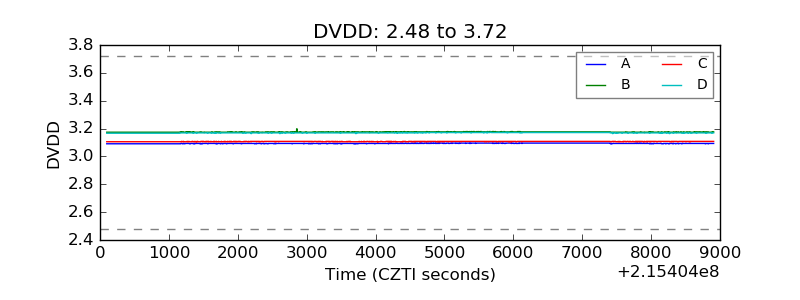 |
| Temperature 1 | 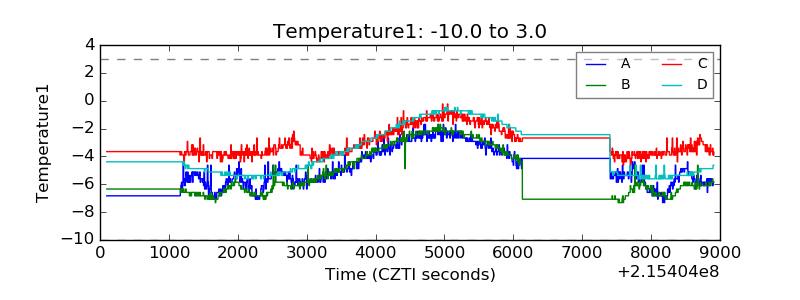 |
| Veto HV Monitor | 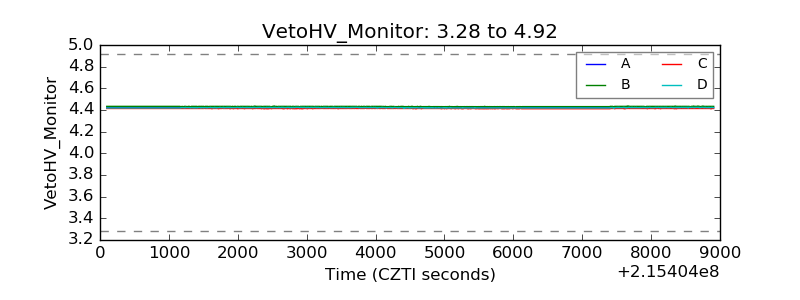 |
| Veto LLD | 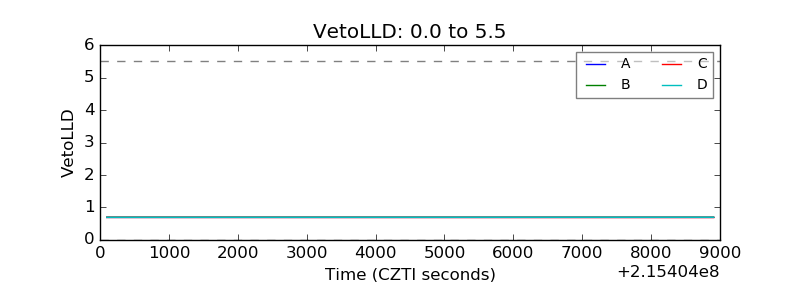 |
| Alpha Counter | 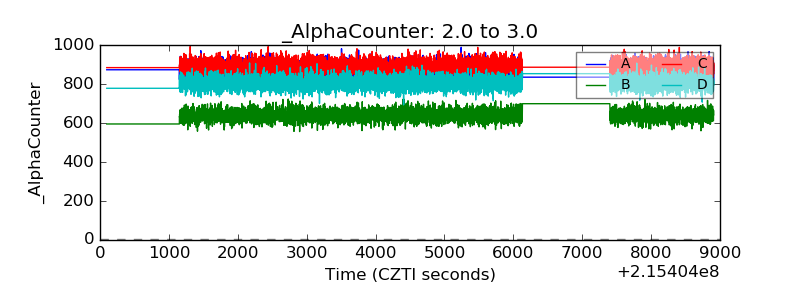 |
| _CPM_Rate | 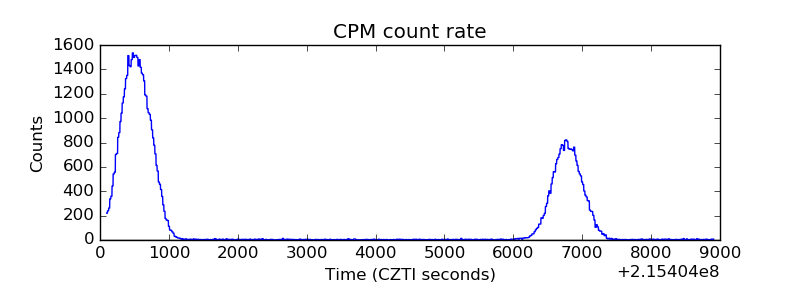 |
| CZT Counter | 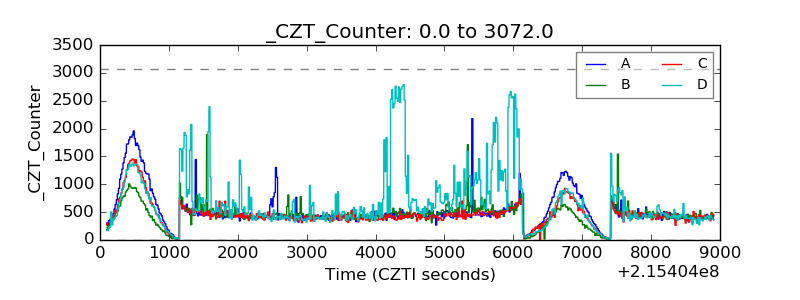 |
| +2.5 Volts monitor |  |
| +5 Volts monitor |  |
| _ROLL_ROT | 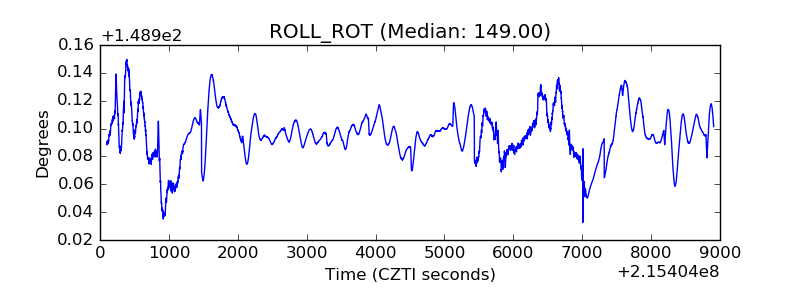 |
| _Roll_DEC | 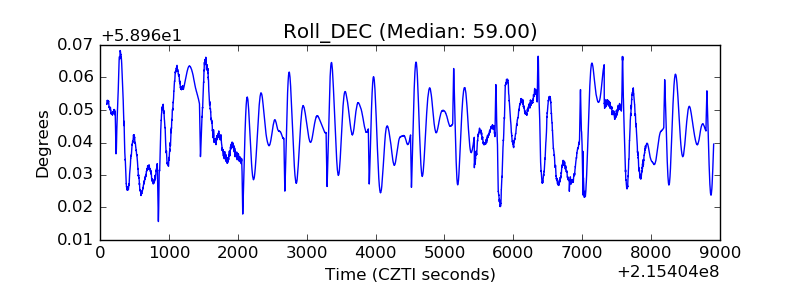 |
| _Roll_RA | 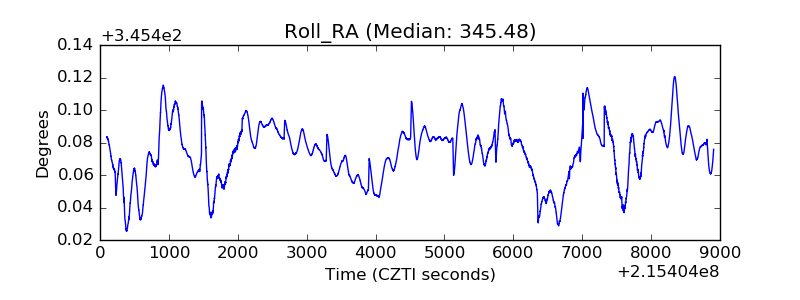 |
| Veto Counter | 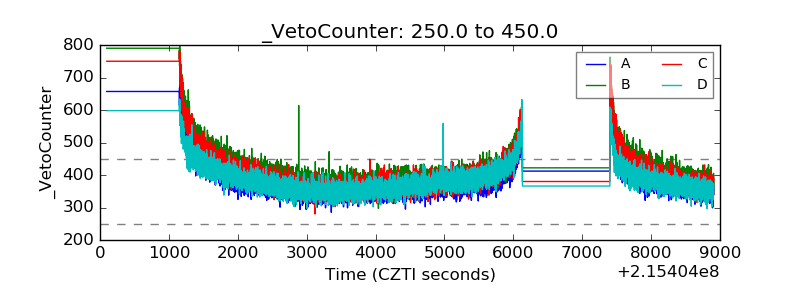 |