| Param | Original file | Final file |
|---|---|---|
| Filename | modeM0/AS1G06_023T01_9000000762_05879cztM0_level2.evt | modeM0/AS1G06_023T01_9000000762_05879cztM0_level2_quad_clean.evt |
| Size (bytes) | 497,183,040 | 79,502,400 |
| Size | 474.2 MB | 75.8 MB |
| Events in quadrant A | 3,199,534 | 495,519 |
| Events in quadrant B | 3,228,094 | 497,470 |
| Events in quadrant C | 3,095,099 | 479,256 |
| Events in quadrant D | 5,057,752 | 446,230 |
| Mode SS | |||
|---|---|---|---|
| Quadrant | BADHDUFLAG | Total packets | Discarded packets |
| A | 0 | 142 | 0 |
| B | 0 | 142 | 0 |
| C | 0 | 142 | 0 |
| D | 0 | 142 | 0 |
| Mode M0 | |||
|---|---|---|---|
| Quadrant | BADHDUFLAG | Total packets | Discarded packets |
| A | 0 | 14635 | 5 |
| B | 0 | 14432 | 4 |
| C | 0 | 14462 | 2 |
| D | 0 | 20029 | 2 |
| Mode M9 | |||
|---|---|---|---|
| Quadrant | BADHDUFLAG | Total packets | Discarded packets |
| A | 0 | 8 | 0 |
| B | 0 | 8 | 0 |
| C | 0 | 8 | 0 |
| D | 0 | 9 | 0 |
| Quadrant | Total seconds | Saturated seconds | Saturation percentage |
|---|---|---|---|
| A | 7018 | 124 | 1.766885% |
| B | 7018 | 134 | 1.909376% |
| C | 7019 | 83 | 1.182505% |
| D | 7019 | 294 | 4.188631% |
Noise dominated data is calculated using 1-second bins in cleaned event files. If a bin has >2000 counts, and if more than 50% of those come from <1% of pixels, then it is considered to be noise-dominated and hence unusable.
| Quadrant | # 1 sec bins | Bins with >0 counts | Bins with >2000 counts | High rate bins dominated by noise | Noise dominated (total time) | Noise dominated (detector-on time) | Marked lightcurve |
|---|---|---|---|---|---|---|---|
| A | 7689 | 7020 | 4 | 4 | 0.05% | 0.06% | 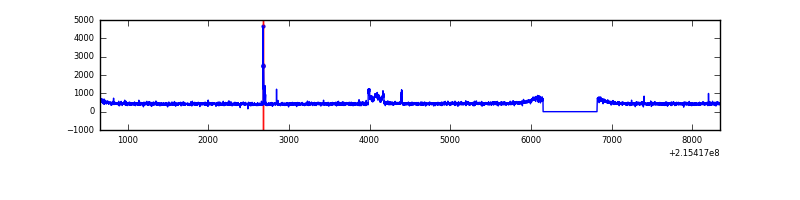 |
| B | 7689 | 7020 | 0 | 0 | 0.00% | 0.00% | 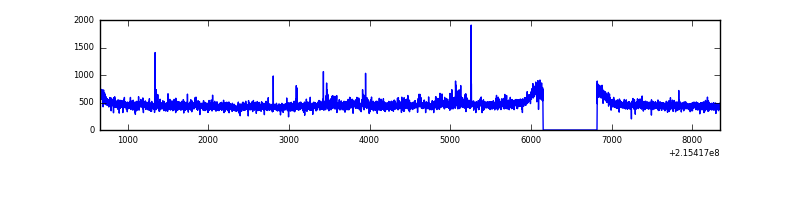 |
| C | 7689 | 7020 | 2 | 2 | 0.03% | 0.03% | 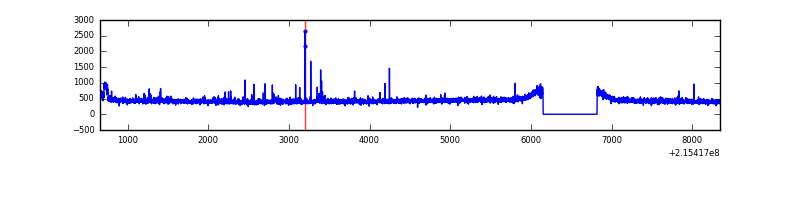 |
| D | 7689 | 7020 | 159 | 159 | 2.07% | 2.26% | 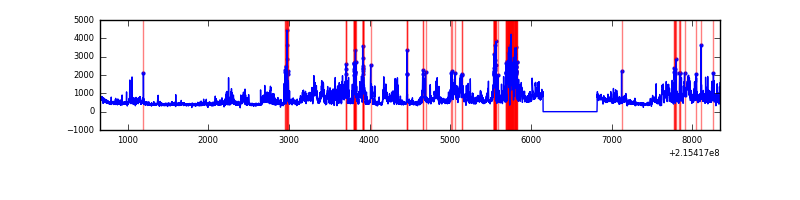 |
Top three noisy pixels from each quadrant. If the there are fewer than three noisy pixels in the level2.evt file, extra rows are filled as -1
| Pixel properties | Quadrant properties | ||||||
|---|---|---|---|---|---|---|---|
| Quadrant | DetID | PixID | Counts | Sigma | Mean | Median | Sigma |
| A | 15 | 236 | 120272 | 736.18 | 799 | 781 | 162.3 |
| A | 0 | 226 | 7765 | 43.03 | 799 | 781 | 162.3 |
| A | 12 | 194 | 7726 | 42.79 | 799 | 781 | 162.3 |
| B | 15 | 204 | 33485 | 212.08 | 807 | 786 | 154.2 |
| B | 0 | 214 | 23652 | 148.31 | 807 | 786 | 154.2 |
| B | 12 | 111 | 14401 | 88.31 | 807 | 786 | 154.2 |
| C | 1 | 16 | 38125 | 209.62 | 773 | 774 | 178.2 |
| C | 1 | 241 | 34231 | 187.77 | 773 | 774 | 178.2 |
| C | 13 | 61 | 6377 | 31.44 | 773 | 774 | 178.2 |
| D | 2 | 152 | 1698269 | 9163.54 | 760 | 735 | 185.2 |
| D | 11 | 241 | 190483 | 1024.29 | 760 | 735 | 185.2 |
| D | 2 | 136 | 159765 | 858.47 | 760 | 735 | 185.2 |
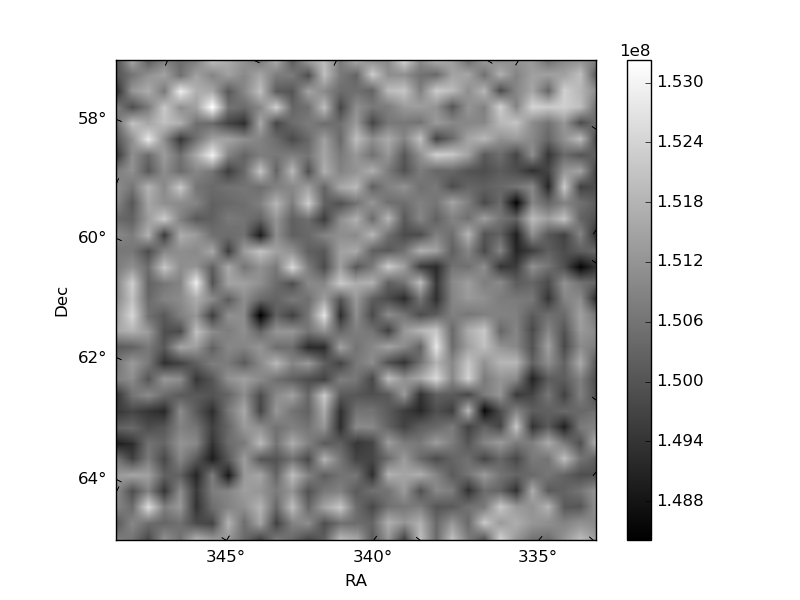
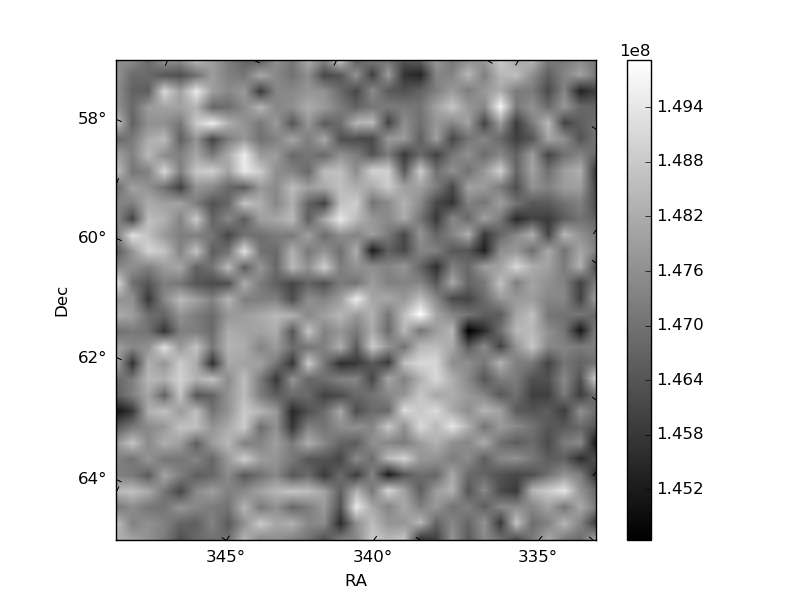
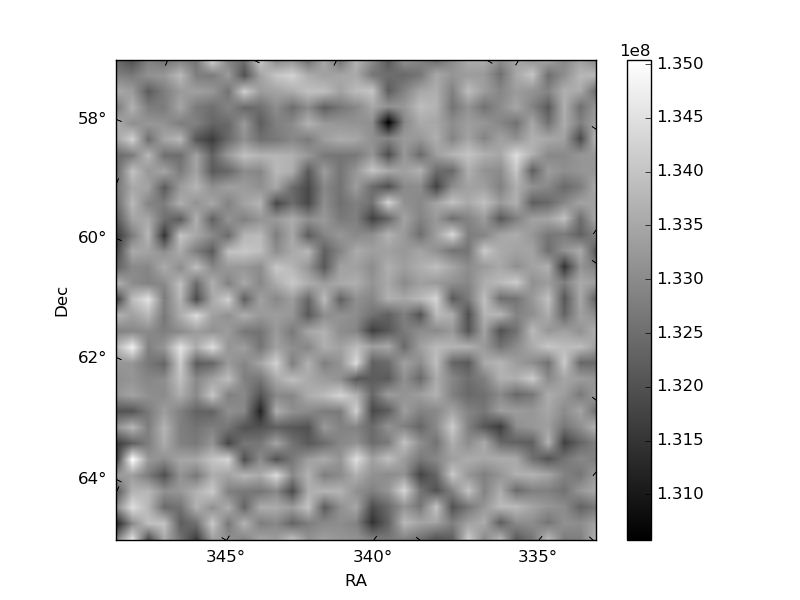
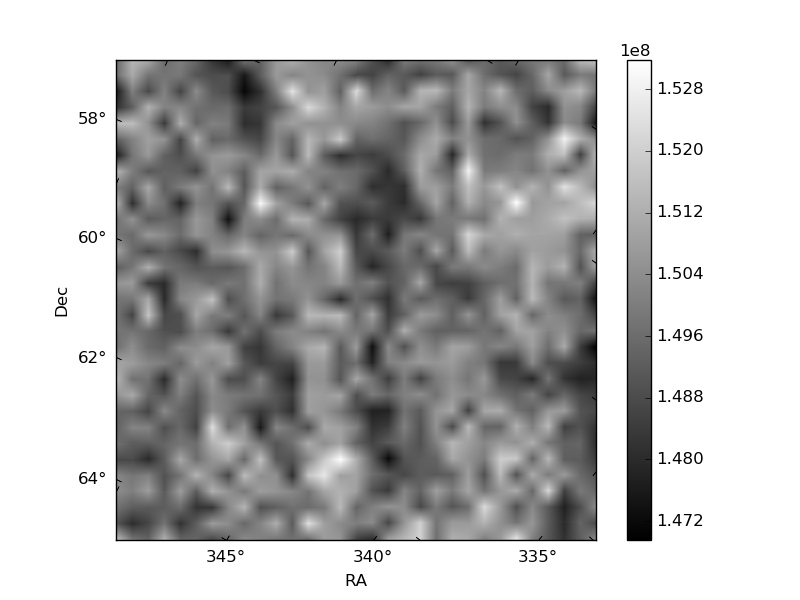
Histogram calculated using DETX and DETY for each event in the final _common_clean file
| Quadrant A |  |
 |
Quadrant B |
|---|---|---|---|
| Quadrant D |  |
 |
Quadrant C |
| Plot type | Count rate plots | Images |
|---|---|---|
| Comparison with Poisson distribution Blue bars denote a histogram of data divided into 1 sec bins. Red curve is a Poisson curve with rate = median count rate of data. |
 |
 |
| Quadrant-wise count rates Data is divided into 100 sec bins |
 |
|
| Module-wise count rates for Quadrant A Data is divided into 100 sec bins |
 |
 |
| Module-wise count rates for Quadrant B Data is divided into 100 sec bins |
 |
 |
| Module-wise count rates for Quadrant C Data is divided into 100 sec bins |
 |
 |
| Module-wise count rates for Quadrant D Data is divided into 100 sec bins |
 |
 |
| Parameter | Plot |
|---|---|
| CZT HV Monitor |  |
| D_VDD | 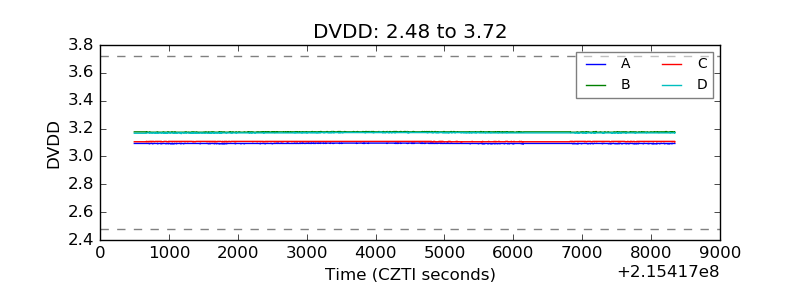 |
| Temperature 1 | 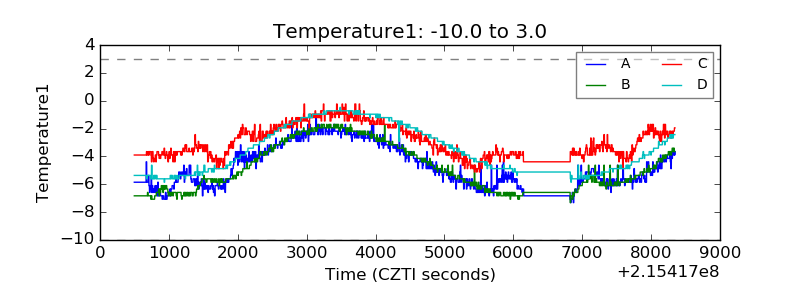 |
| Veto HV Monitor |  |
| Veto LLD |  |
| Alpha Counter |  |
| _CPM_Rate |  |
| CZT Counter |  |
| +2.5 Volts monitor |  |
| +5 Volts monitor |  |
| _ROLL_ROT |  |
| _Roll_DEC |  |
| _Roll_RA |  |
| Veto Counter |  |