| Param | Original file | Final file |
|---|---|---|
| Filename | modeM0/AS1G06_023T01_9000000762_05881cztM0_level2.evt | modeM0/AS1G06_023T01_9000000762_05881cztM0_level2_quad_clean.evt |
| Size (bytes) | 701,902,080 | 94,887,360 |
| Size | 669.4 MB | 90.5 MB |
| Events in quadrant A | 3,556,149 | 614,105 |
| Events in quadrant B | 3,866,339 | 618,913 |
| Events in quadrant C | 3,485,498 | 598,836 |
| Events in quadrant D | 9,808,711 | 486,528 |
| Mode SS | |||
|---|---|---|---|
| Quadrant | BADHDUFLAG | Total packets | Discarded packets |
| A | 0 | 162 | 4 |
| B | 0 | 162 | 4 |
| C | 0 | 162 | 2 |
| D | 0 | 162 | 2 |
| Mode M0 | |||
|---|---|---|---|
| Quadrant | BADHDUFLAG | Total packets | Discarded packets |
| A | 0 | 16632 | 221 |
| B | 0 | 17120 | 186 |
| C | 0 | 16607 | 170 |
| D | 0 | 35031 | 344 |
| Quadrant | Total seconds | Saturated seconds | Saturation percentage |
|---|---|---|---|
| A | 7965 | 152 | 1.908349% |
| B | 7983 | 150 | 1.878993% |
| C | 7992 | 43 | 0.538038% |
| D | 7962 | 2075 | 26.061291% |
Noise dominated data is calculated using 1-second bins in cleaned event files. If a bin has >2000 counts, and if more than 50% of those come from <1% of pixels, then it is considered to be noise-dominated and hence unusable.
| Quadrant | # 1 sec bins | Bins with >0 counts | Bins with >2000 counts | High rate bins dominated by noise | Noise dominated (total time) | Noise dominated (detector-on time) | Marked lightcurve |
|---|---|---|---|---|---|---|---|
| A | 8074 | 8052 | 0 | 0 | 0.00% | 0.00% | 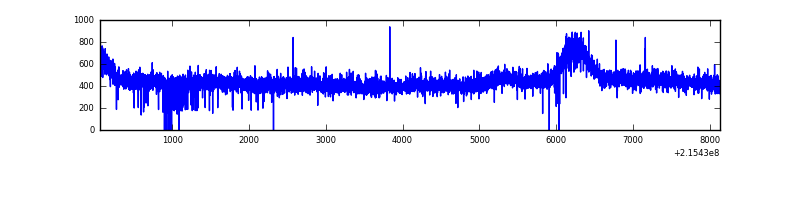 |
| B | 8074 | 8065 | 5 | 5 | 0.06% | 0.06% | 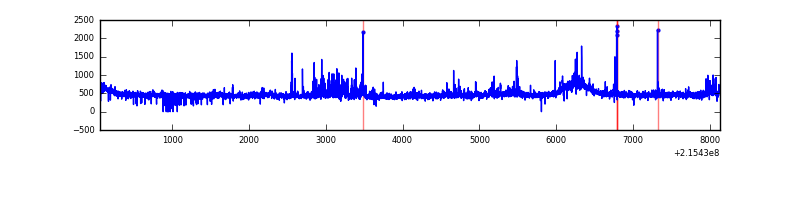 |
| C | 8074 | 8064 | 1 | 1 | 0.01% | 0.01% | 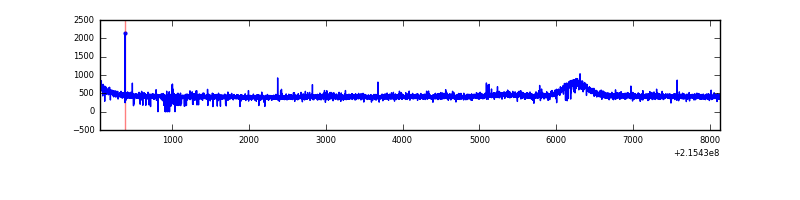 |
| D | 8073 | 8057 | 1843 | 1843 | 22.83% | 22.87% | 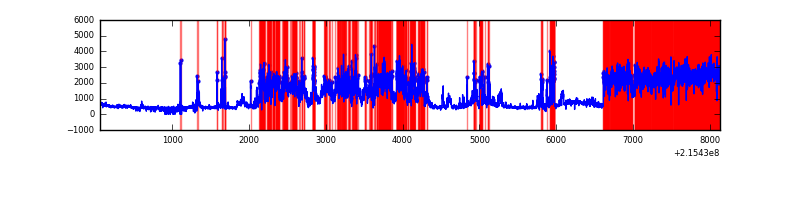 |
Top three noisy pixels from each quadrant. If the there are fewer than three noisy pixels in the level2.evt file, extra rows are filled as -1
| Pixel properties | Quadrant properties | ||||||
|---|---|---|---|---|---|---|---|
| Quadrant | DetID | PixID | Counts | Sigma | Mean | Median | Sigma |
| A | 15 | 236 | 21001 | 106.62 | 918 | 895 | 188.6 |
| A | 12 | 194 | 8979 | 42.87 | 918 | 895 | 188.6 |
| A | 0 | 226 | 8728 | 41.53 | 918 | 895 | 188.6 |
| B | 4 | 81 | 86961 | 486.94 | 926 | 904 | 176.7 |
| B | 15 | 85 | 45985 | 255.08 | 926 | 904 | 176.7 |
| B | 15 | 204 | 40724 | 225.32 | 926 | 904 | 176.7 |
| C | 13 | 61 | 7263 | 30.96 | 890 | 892 | 205.8 |
| C | 8 | 79 | 5328 | 21.56 | 890 | 892 | 205.8 |
| C | 8 | 222 | 5106 | 20.48 | 890 | 892 | 205.8 |
| D | 2 | 152 | 5444260 | 26987.48 | 814 | 785 | 201.7 |
| D | 15 | 217 | 838073 | 4151.08 | 814 | 785 | 201.7 |
| D | 1 | 20 | 122785 | 604.85 | 814 | 785 | 201.7 |
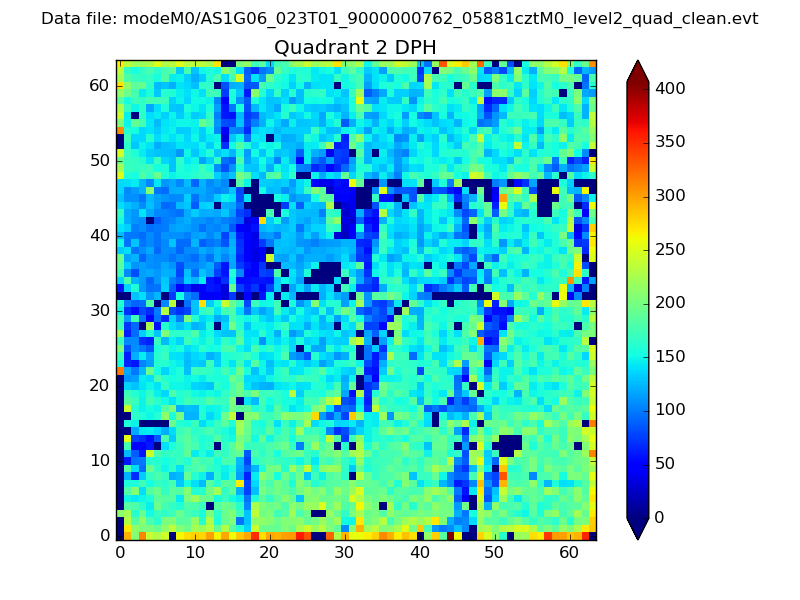
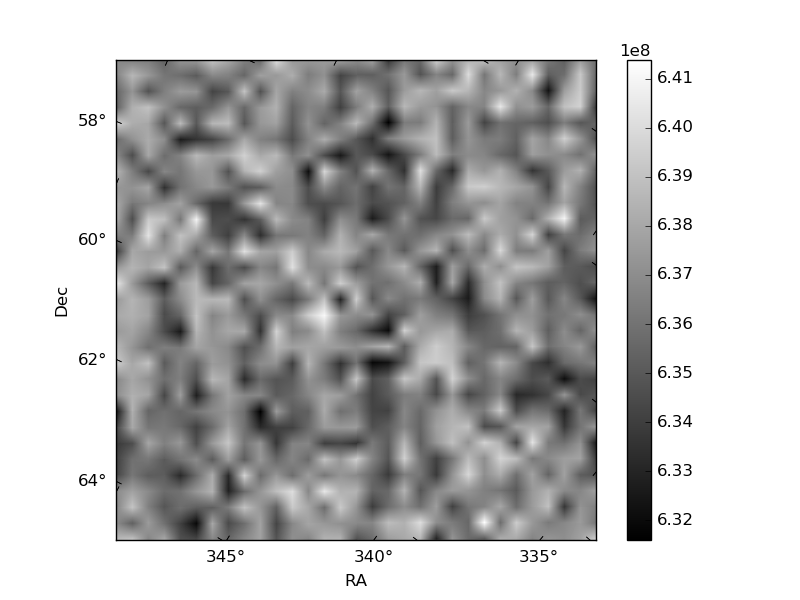
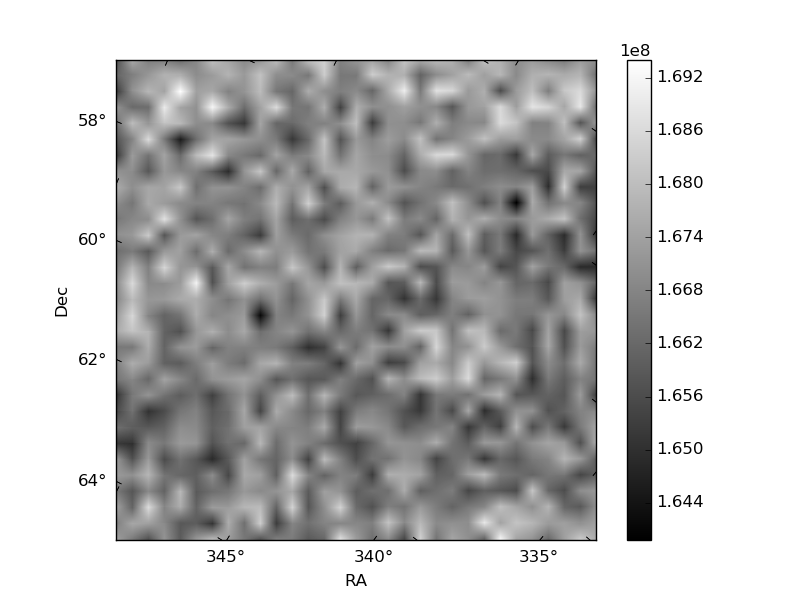
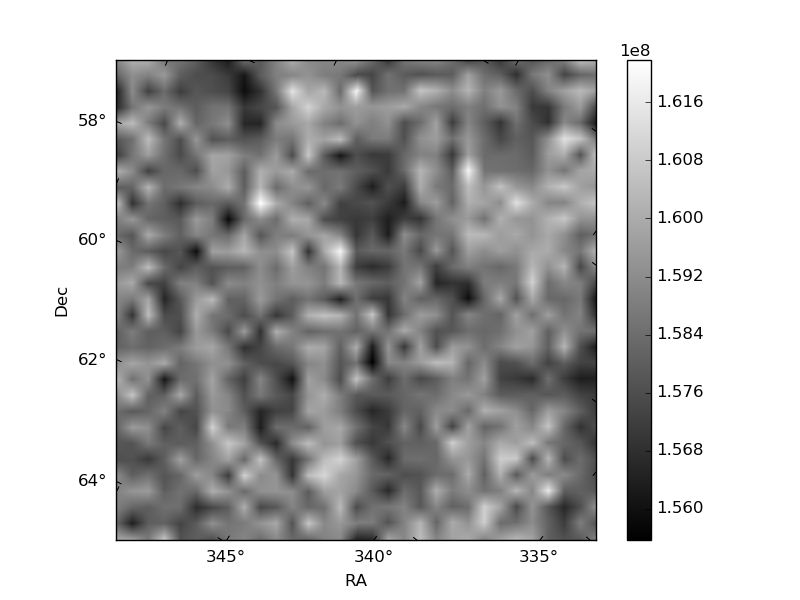
Histogram calculated using DETX and DETY for each event in the final _common_clean file
| Quadrant A | 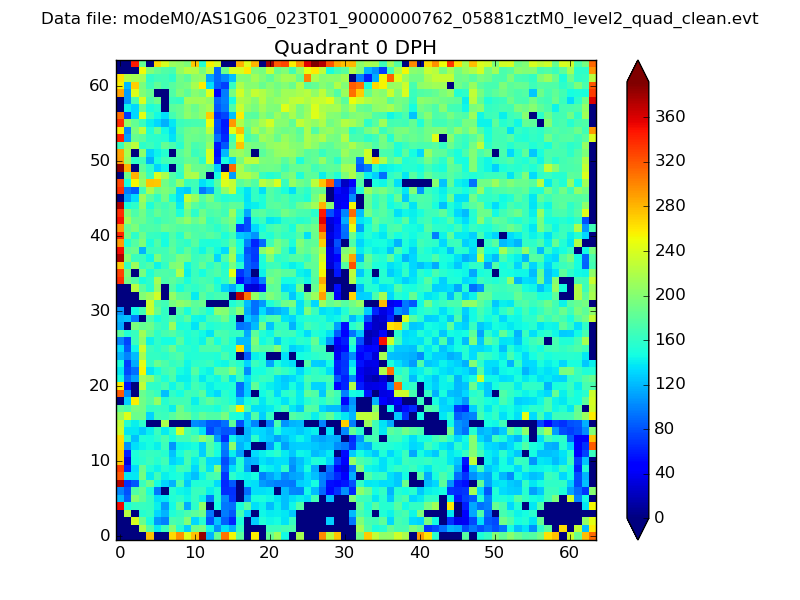 |
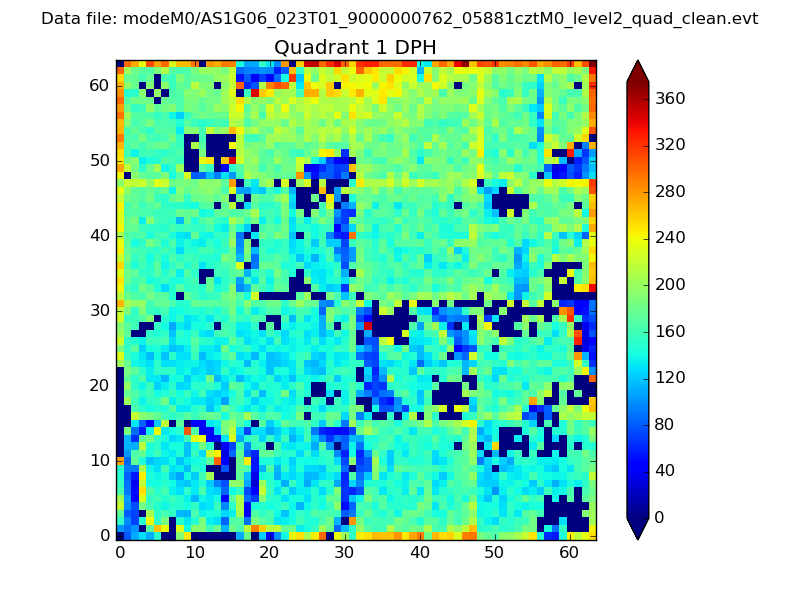 |
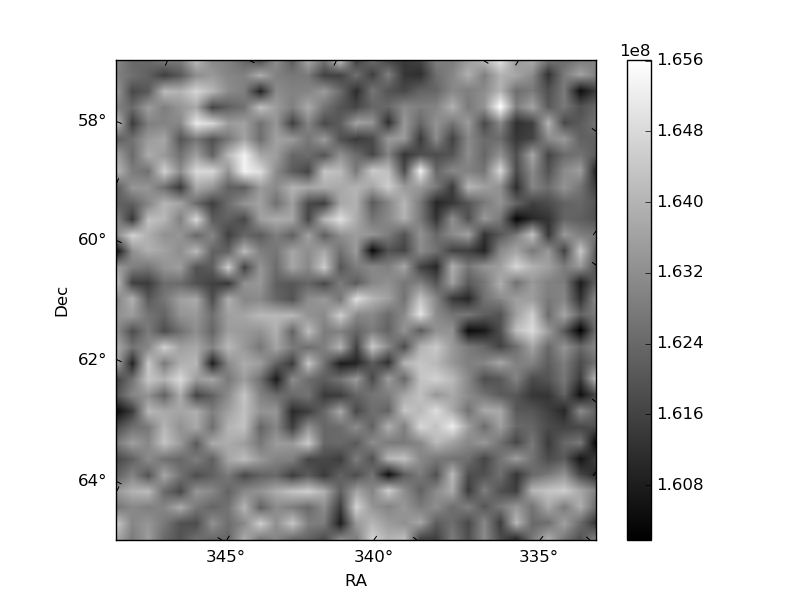
Quadrant B |
|---|---|---|---|
| Quadrant D | 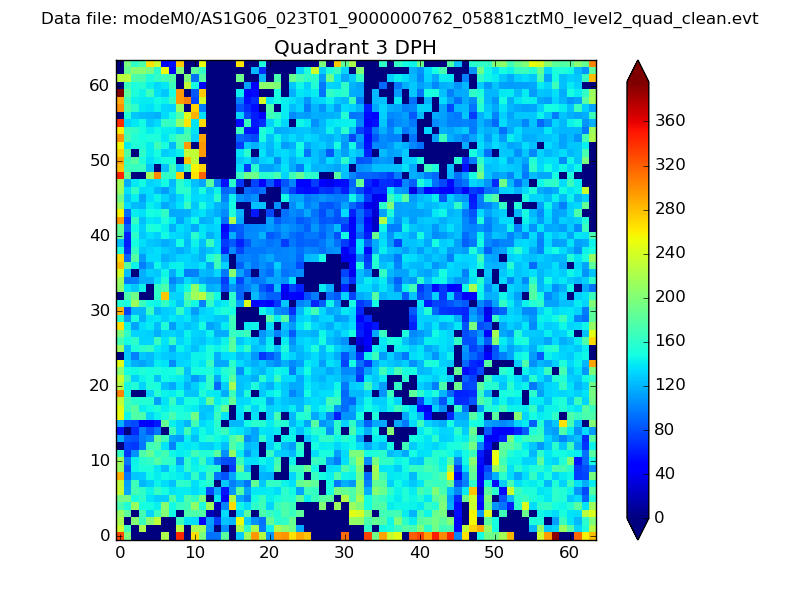 |
 |
Quadrant C |
| Plot type | Count rate plots | Images |
|---|---|---|
| Comparison with Poisson distribution Blue bars denote a histogram of data divided into 1 sec bins. Red curve is a Poisson curve with rate = median count rate of data. |
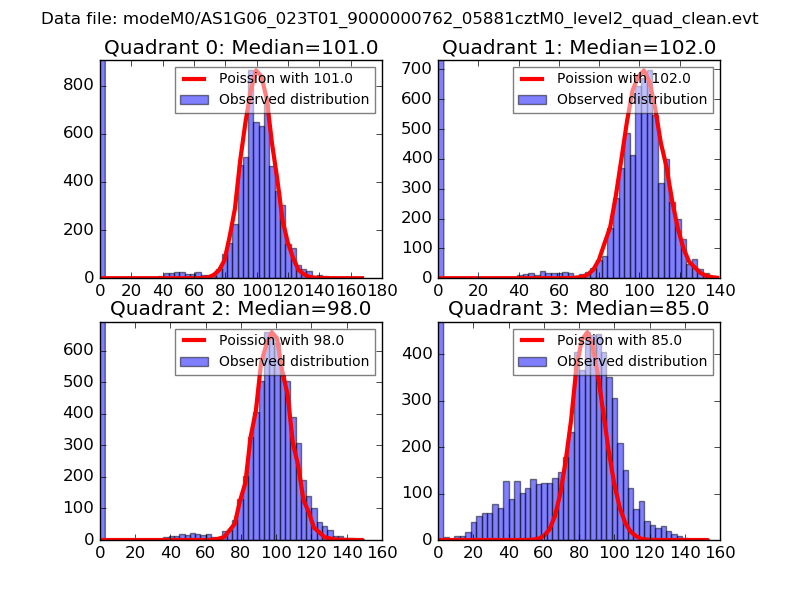 |
 |
| Quadrant-wise count rates Data is divided into 100 sec bins |
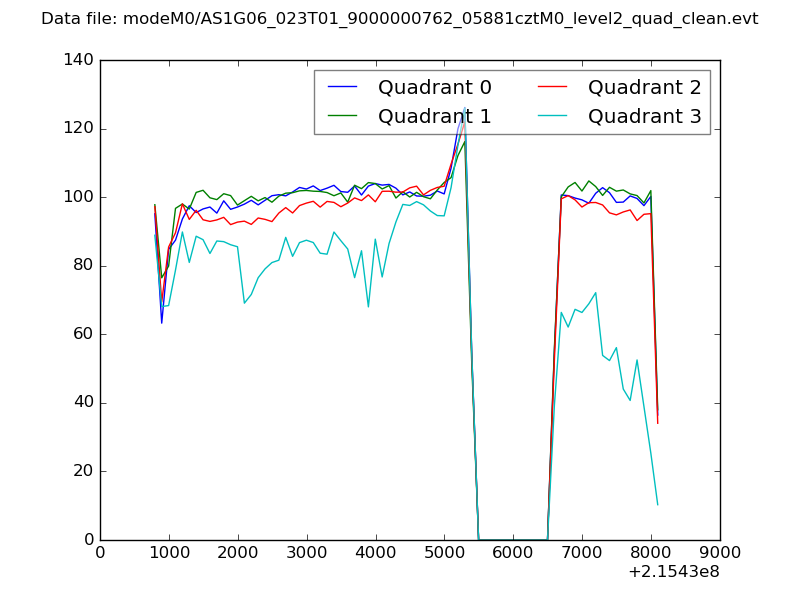 |
|
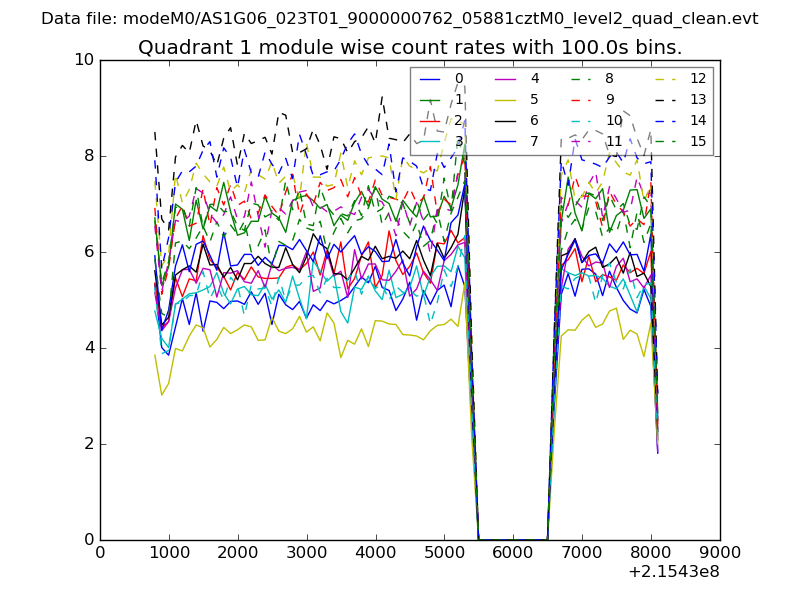
| Module-wise count rates for Quadrant A Data is divided into 100 sec bins |
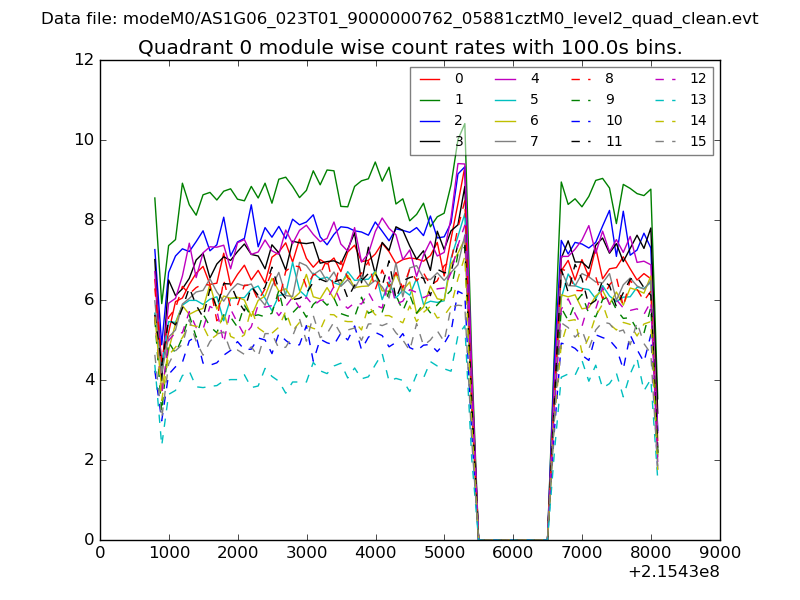 |
 |
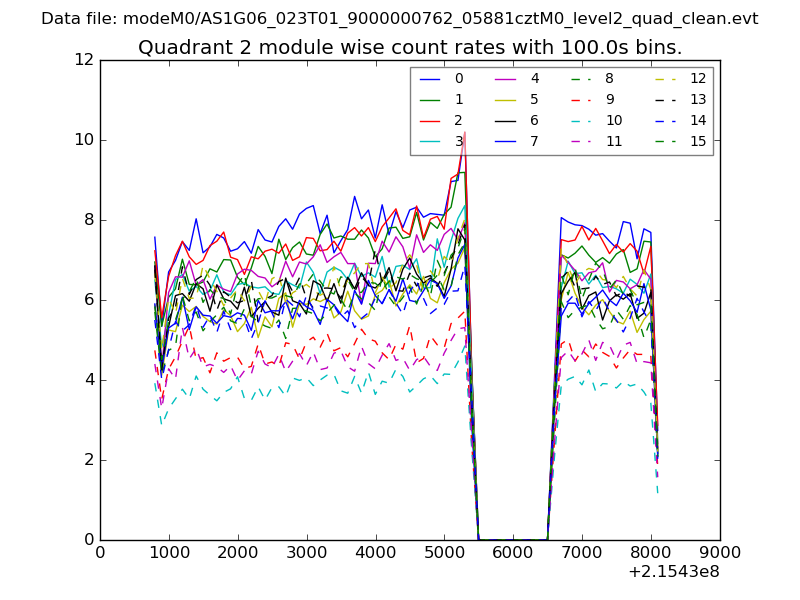
| Module-wise count rates for Quadrant B Data is divided into 100 sec bins |
 |
 |
| Module-wise count rates for Quadrant C Data is divided into 100 sec bins |
 |
 |
| Module-wise count rates for Quadrant D Data is divided into 100 sec bins |
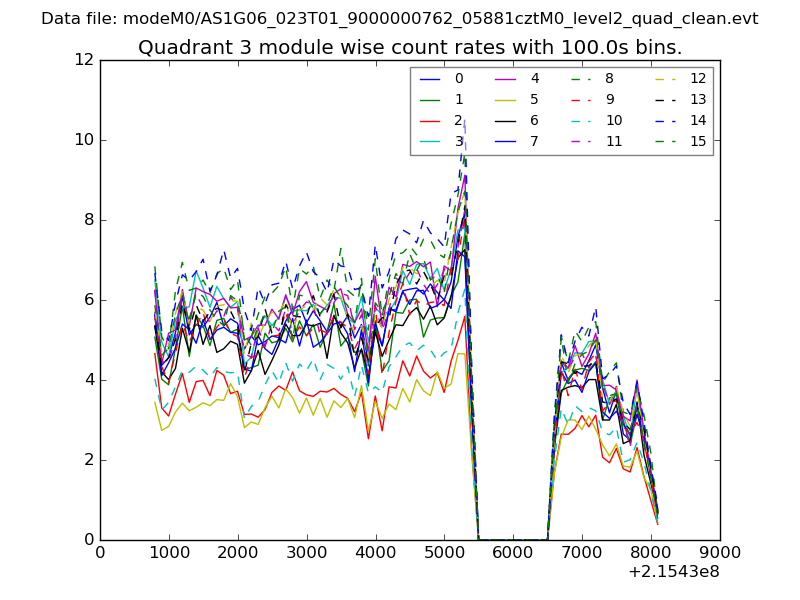 |
 |
| Parameter | Plot |
|---|---|
| CZT HV Monitor |  |
| D_VDD | 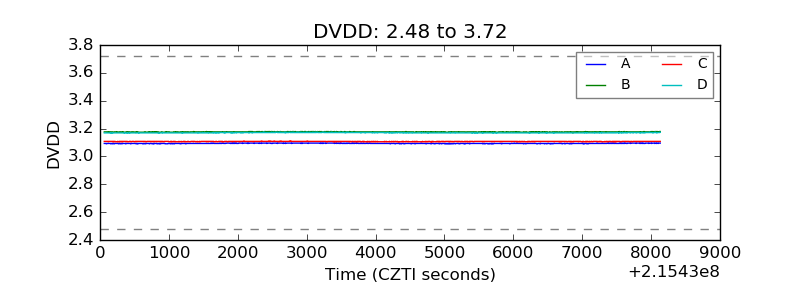 |
| Temperature 1 | 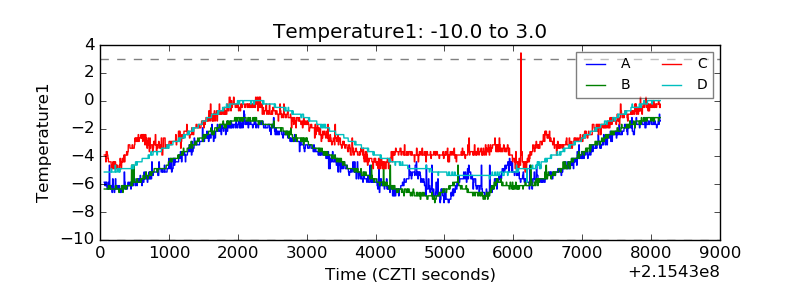 |
| Veto HV Monitor | 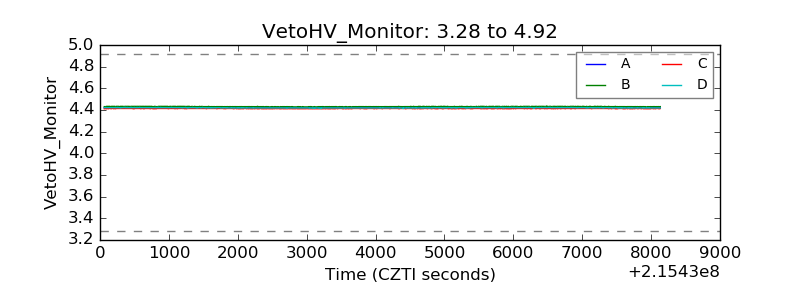 |
| Veto LLD | 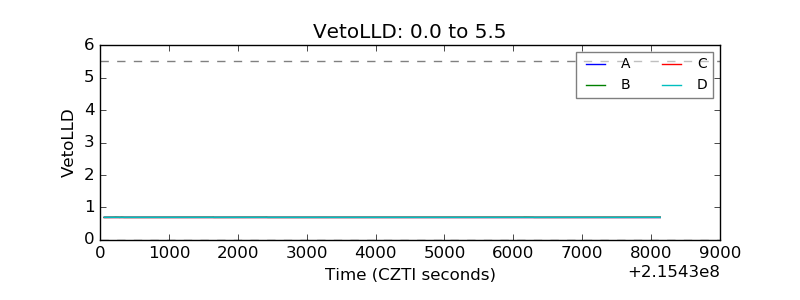 |
| Alpha Counter | 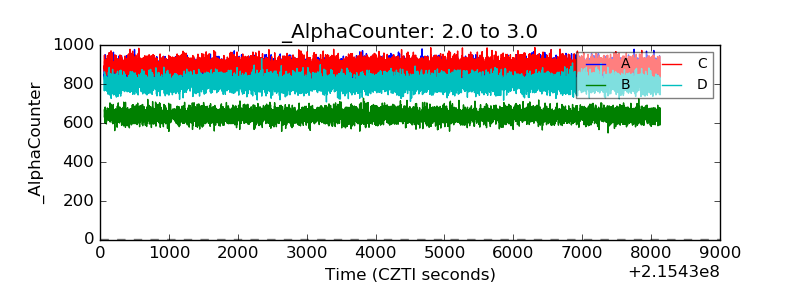 |
| _CPM_Rate | 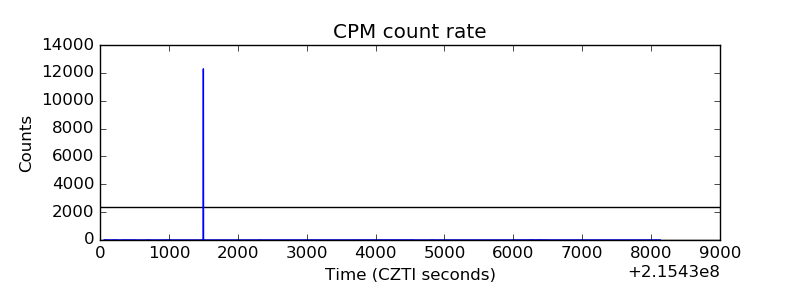 |
| CZT Counter | 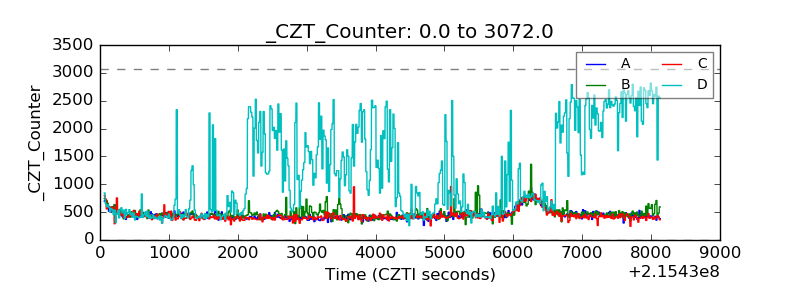 |
| +2.5 Volts monitor |  |
| +5 Volts monitor |  |
| _ROLL_ROT | 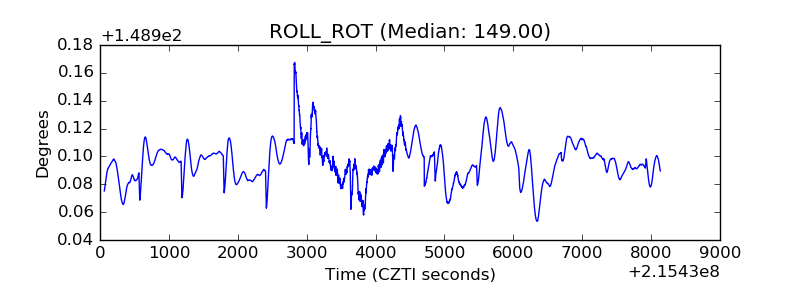 |
| _Roll_DEC | 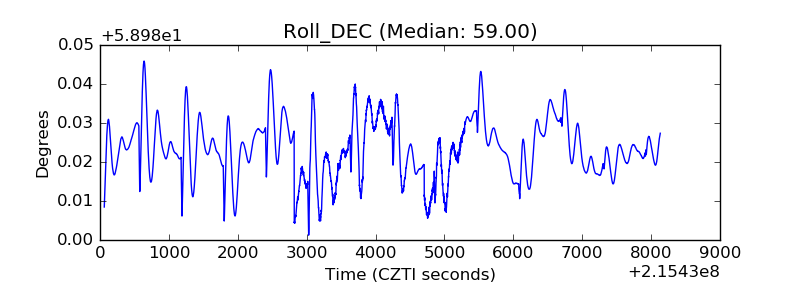 |
| _Roll_RA | 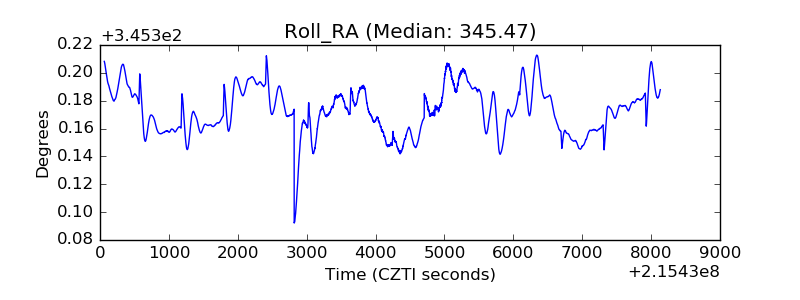 |
| Veto Counter | 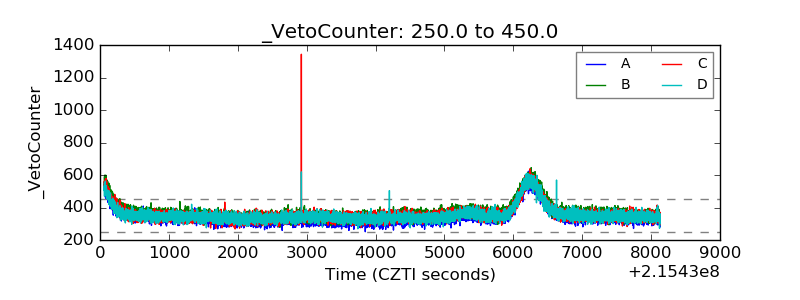 |