| Param | Original file | Final file |
|---|---|---|
| Filename | modeM0/AS1G06_023T01_9000000762_05885cztM0_level2.evt | modeM0/AS1G06_023T01_9000000762_05885cztM0_level2_quad_clean.evt |
| Size (bytes) | 511,107,840 | 90,763,200 |
| Size | 487.4 MB | 86.6 MB |
| Events in quadrant A | 3,014,217 | 589,546 |
| Events in quadrant B | 3,838,046 | 581,066 |
| Events in quadrant C | 2,937,431 | 570,564 |
| Events in quadrant D | 5,227,994 | 533,666 |
| Mode SS | |||
|---|---|---|---|
| Quadrant | BADHDUFLAG | Total packets | Discarded packets |
| A | 0 | 138 | 0 |
| B | 0 | 138 | 0 |
| C | 0 | 138 | 0 |
| D | 0 | 138 | 0 |
| Mode M0 | |||
|---|---|---|---|
| Quadrant | BADHDUFLAG | Total packets | Discarded packets |
| A | 0 | 13847 | 3 |
| B | 0 | 16315 | 2 |
| C | 0 | 13742 | 2 |
| D | 0 | 20372 | 2 |
| Mode M9 | |||
|---|---|---|---|
| Quadrant | BADHDUFLAG | Total packets | Discarded packets |
| A | 0 | 9 | 0 |
| B | 0 | 9 | 0 |
| C | 0 | 9 | 0 |
| D | 0 | 9 | 0 |
| Quadrant | Total seconds | Saturated seconds | Saturation percentage |
|---|---|---|---|
| A | 6796 | 28 | 0.412007% |
| B | 6796 | 84 | 1.236021% |
| C | 6796 | 13 | 0.191289% |
| D | 6796 | 304 | 4.473220% |
Noise dominated data is calculated using 1-second bins in cleaned event files. If a bin has >2000 counts, and if more than 50% of those come from <1% of pixels, then it is considered to be noise-dominated and hence unusable.
| Quadrant | # 1 sec bins | Bins with >0 counts | Bins with >2000 counts | High rate bins dominated by noise | Noise dominated (total time) | Noise dominated (detector-on time) | Marked lightcurve |
|---|---|---|---|---|---|---|---|
| A | 7656 | 6797 | 4 | 4 | 0.05% | 0.06% | 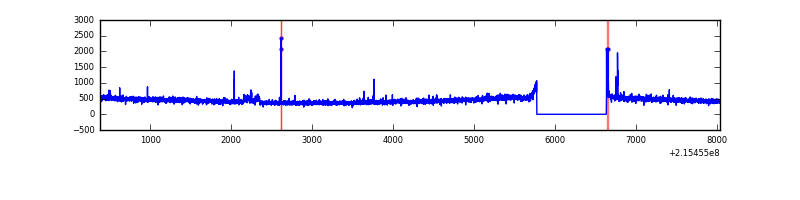 |
| B | 7656 | 6797 | 14 | 14 | 0.18% | 0.21% | 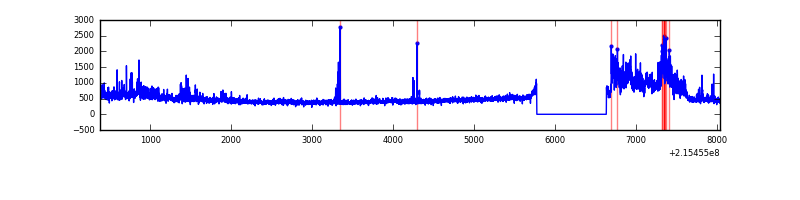 |
| C | 7656 | 6797 | 0 | 0 | 0.00% | 0.00% | 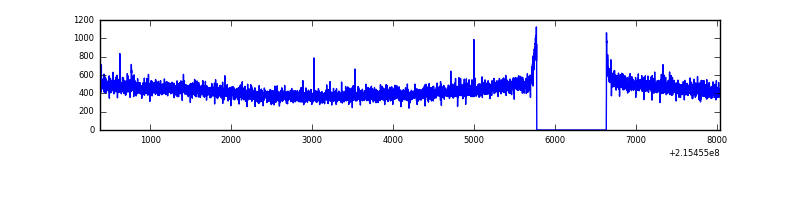 |
| D | 7656 | 6797 | 187 | 187 | 2.44% | 2.75% | 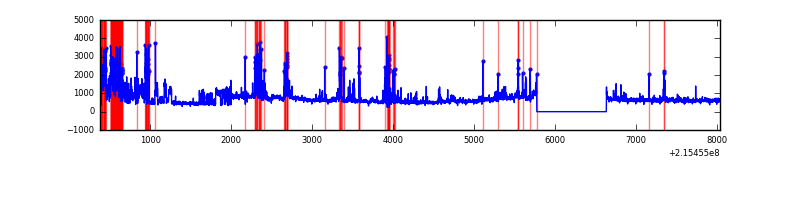 |
Top three noisy pixels from each quadrant. If the there are fewer than three noisy pixels in the level2.evt file, extra rows are filled as -1
| Pixel properties | Quadrant properties | ||||||
|---|---|---|---|---|---|---|---|
| Quadrant | DetID | PixID | Counts | Sigma | Mean | Median | Sigma |
| A | 15 | 236 | 40254 | 253.68 | 765 | 748 | 155.7 |
| A | 13 | 251 | 14516 | 88.41 | 765 | 748 | 155.7 |
| A | 15 | 234 | 13448 | 81.55 | 765 | 748 | 155.7 |
| B | 4 | 200 | 557424 | 3779.47 | 773 | 755 | 147.3 |
| B | 15 | 204 | 113791 | 767.45 | 773 | 755 | 147.3 |
| B | 0 | 214 | 66662 | 447.47 | 773 | 755 | 147.3 |
| C | 1 | 16 | 7433 | 38.44 | 749 | 751 | 173.8 |
| C | 13 | 61 | 6213 | 31.42 | 749 | 751 | 173.8 |
| C | 6 | 15 | 2650 | 10.92 | 749 | 751 | 173.8 |
| D | 1 | 20 | 1437269 | 8017.21 | 734 | 711 | 179.2 |
| D | 2 | 152 | 534854 | 2980.97 | 734 | 711 | 179.2 |
| D | 2 | 14 | 163681 | 909.51 | 734 | 711 | 179.2 |
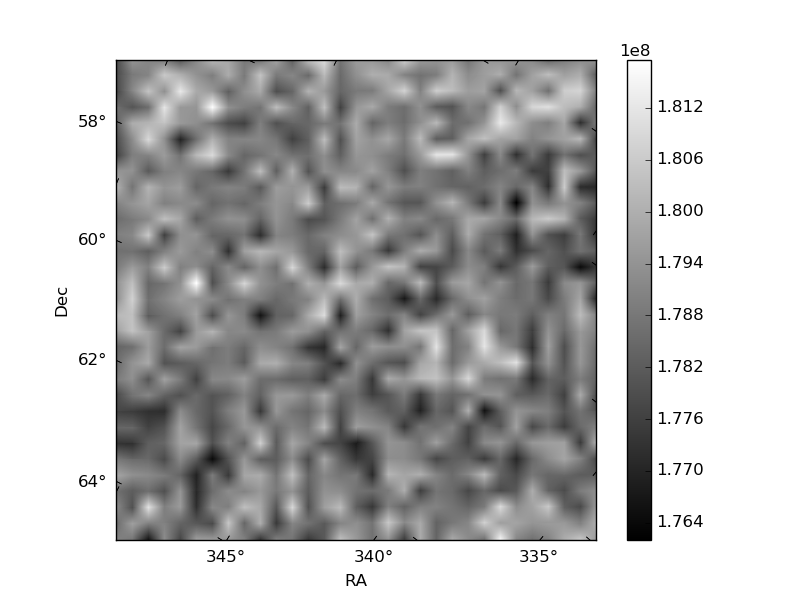
Histogram calculated using DETX and DETY for each event in the final _common_clean file
| Quadrant A | 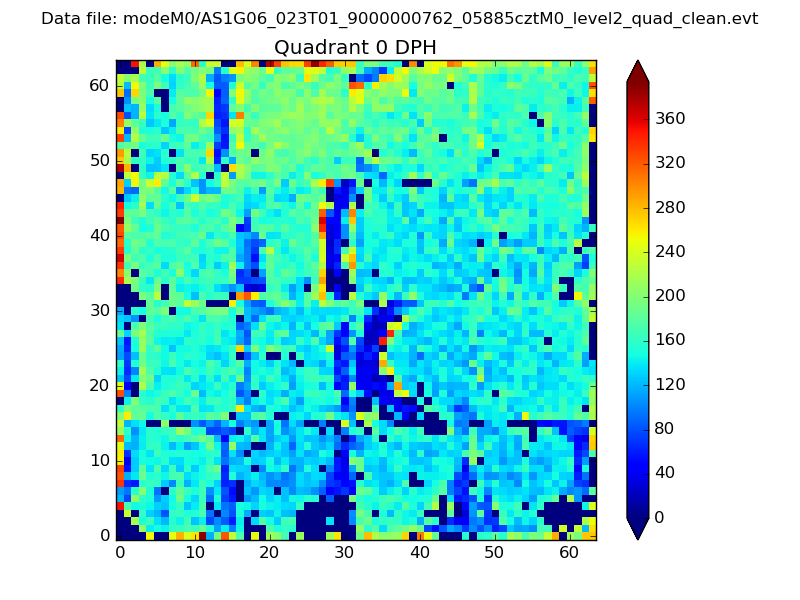 |
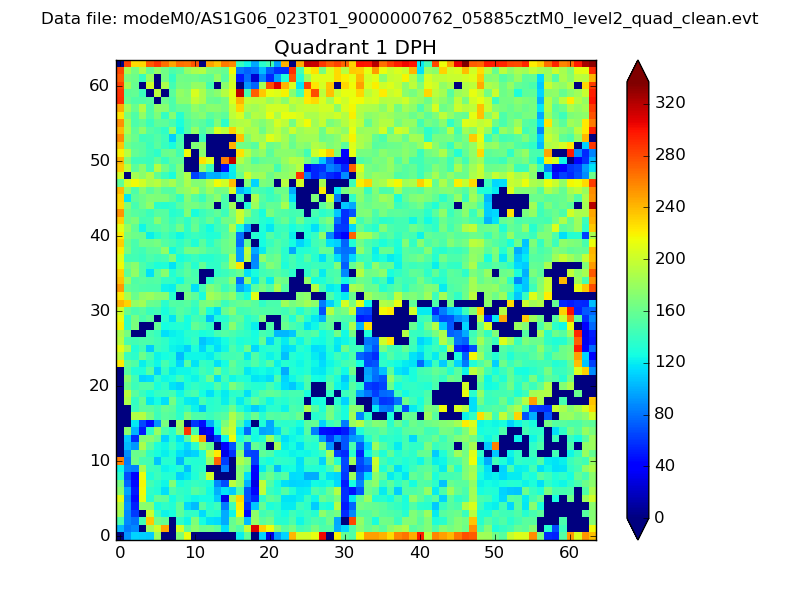 |
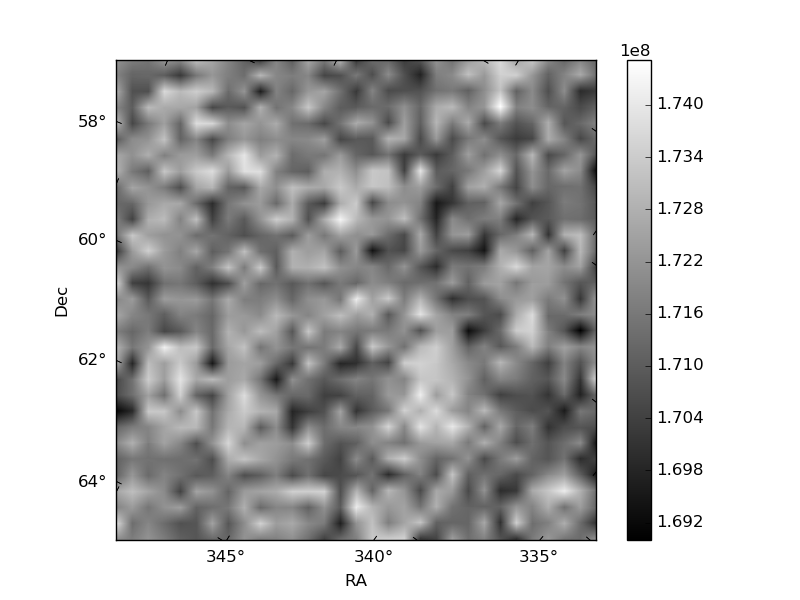
Quadrant B |
|---|---|---|---|
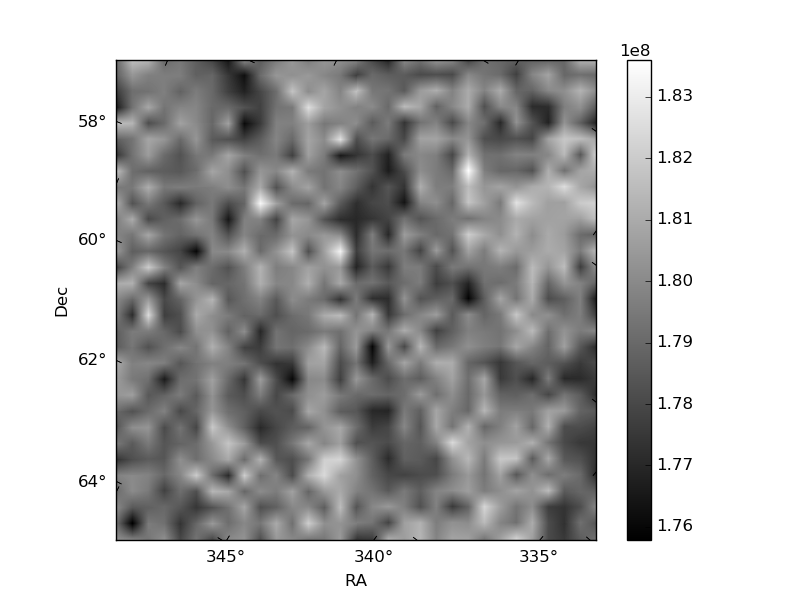
| Quadrant D |  |
 |
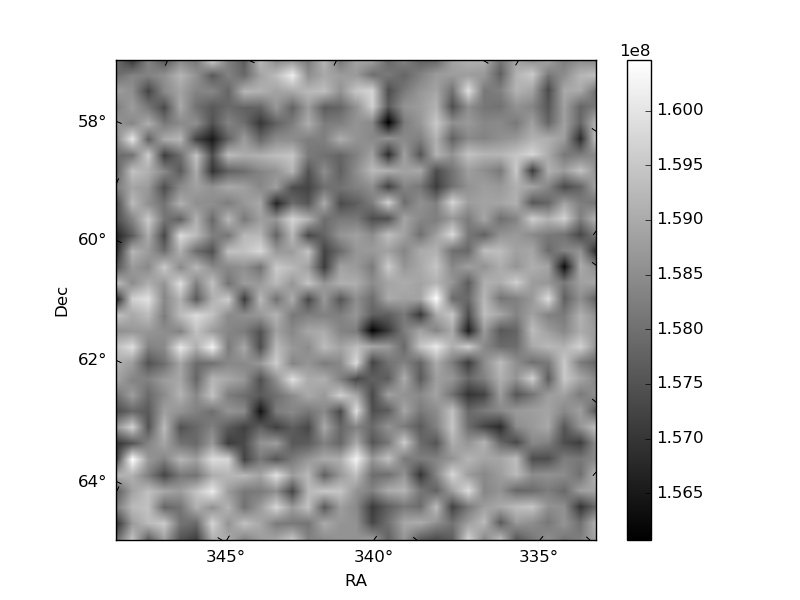
Quadrant C |
| Plot type | Count rate plots | Images |
|---|---|---|
| Comparison with Poisson distribution Blue bars denote a histogram of data divided into 1 sec bins. Red curve is a Poisson curve with rate = median count rate of data. |
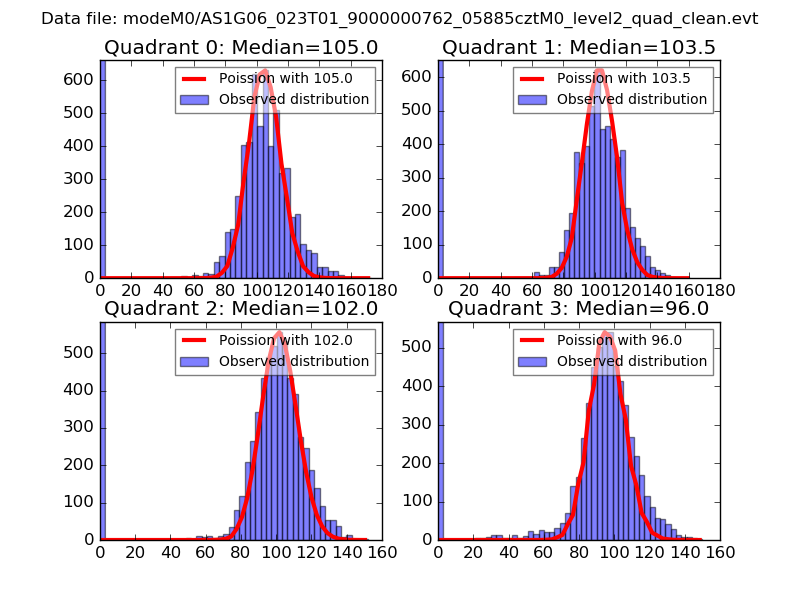 |
 |
| Quadrant-wise count rates Data is divided into 100 sec bins |
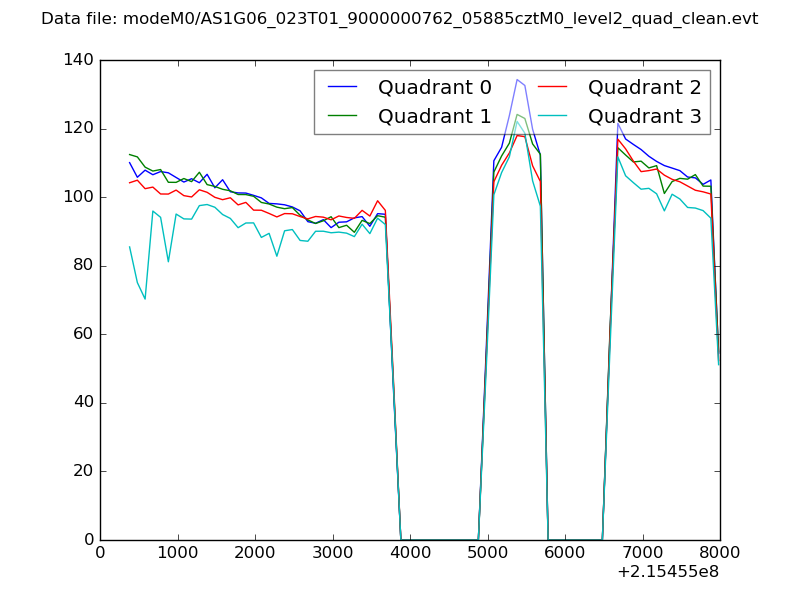 |
|
| Module-wise count rates for Quadrant A Data is divided into 100 sec bins |
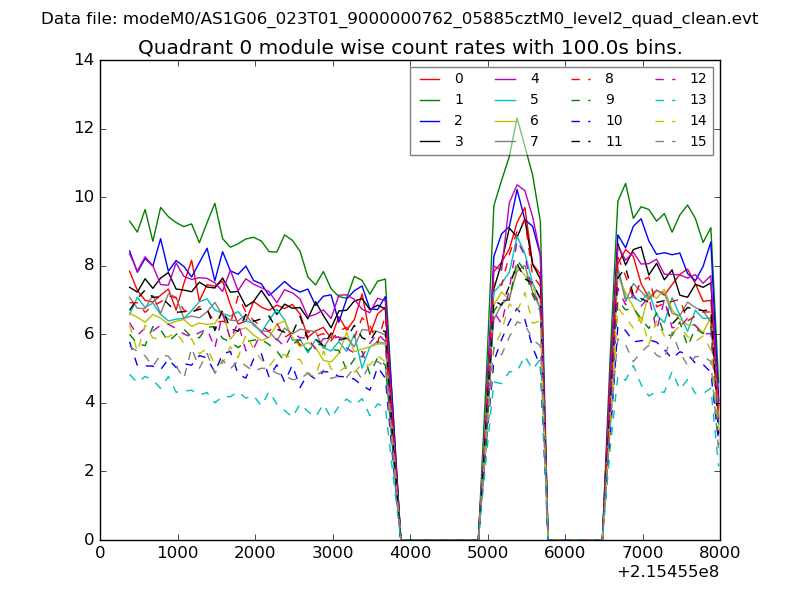 |
 |
| Module-wise count rates for Quadrant B Data is divided into 100 sec bins |
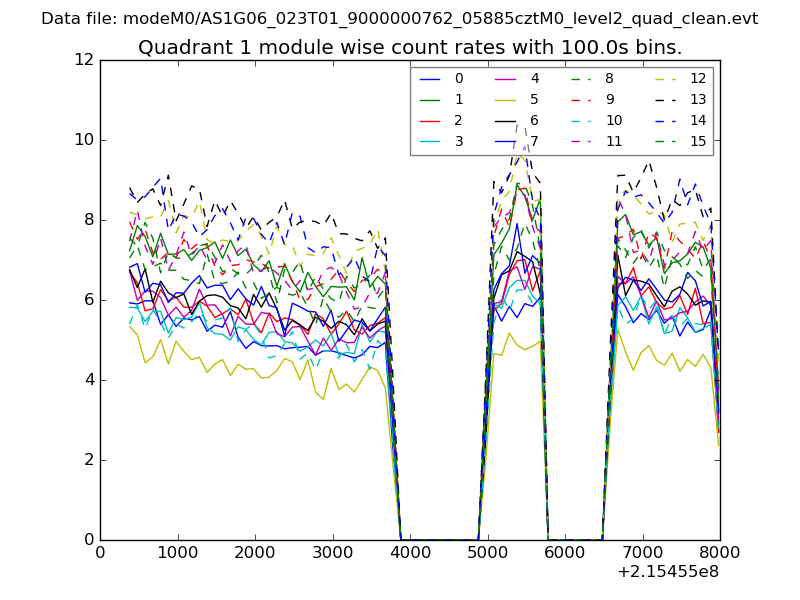 |
 |
| Module-wise count rates for Quadrant C Data is divided into 100 sec bins |
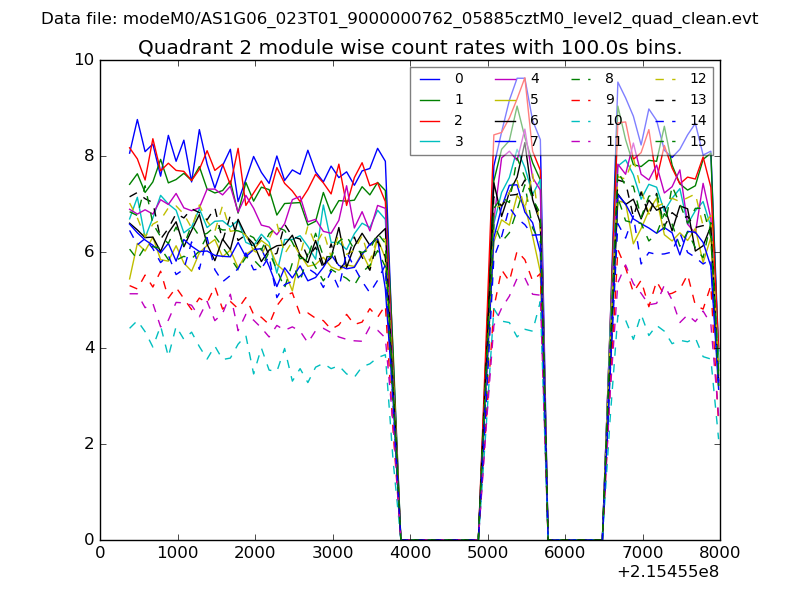 |
 |
| Module-wise count rates for Quadrant D Data is divided into 100 sec bins |
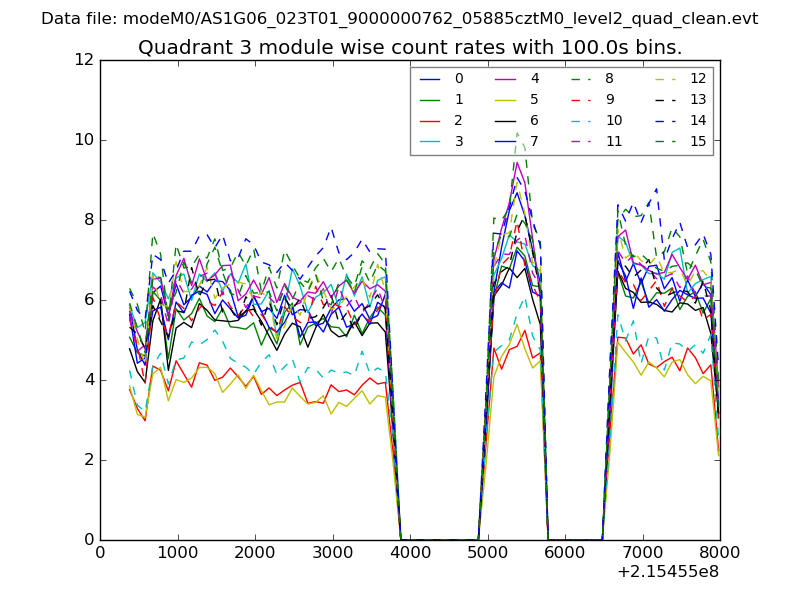 |
 |
| Parameter | Plot |
|---|---|
| CZT HV Monitor | 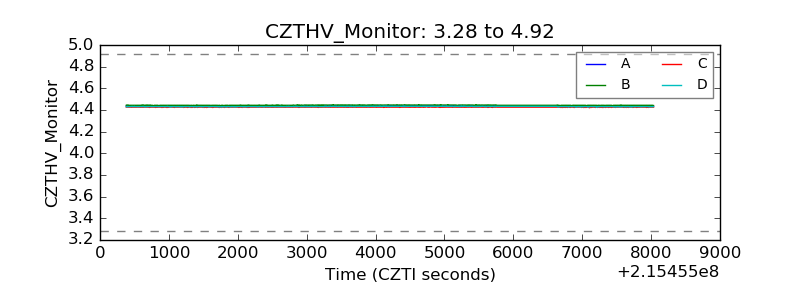 |
| D_VDD | 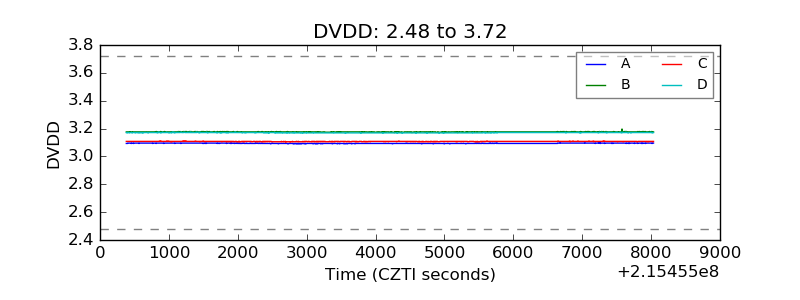 |
| Temperature 1 | 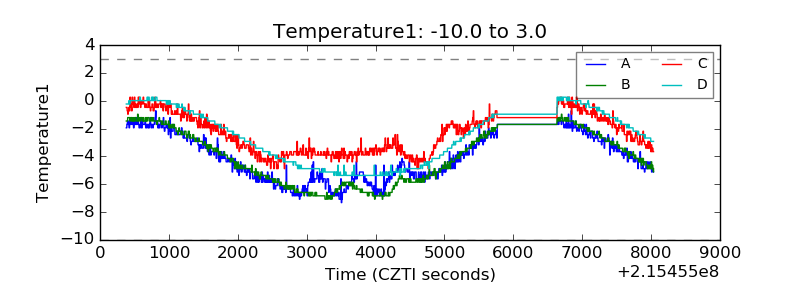 |
| Veto HV Monitor | 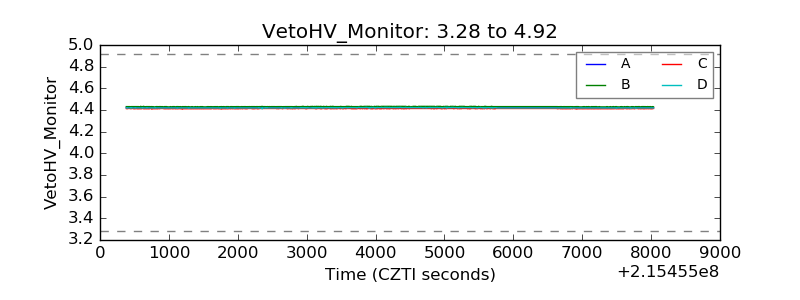 |
| Veto LLD | 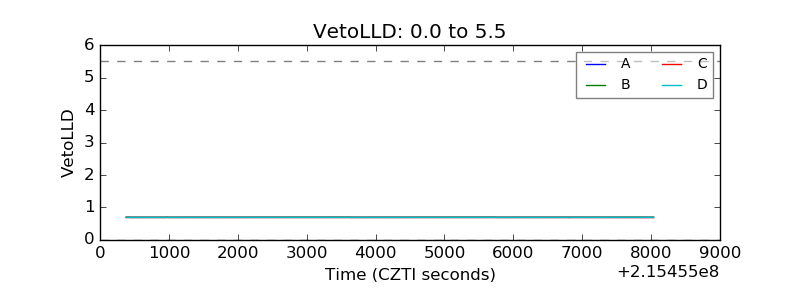 |
| Alpha Counter | 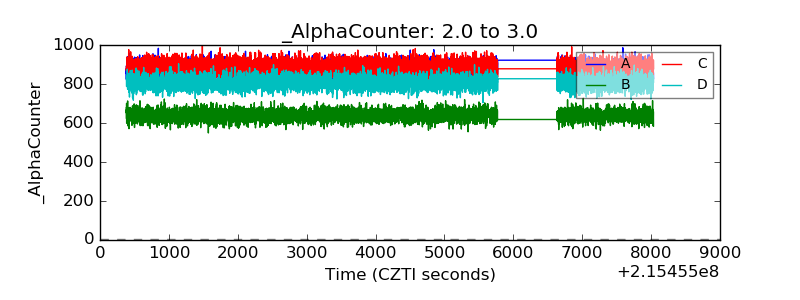 |
| _CPM_Rate | 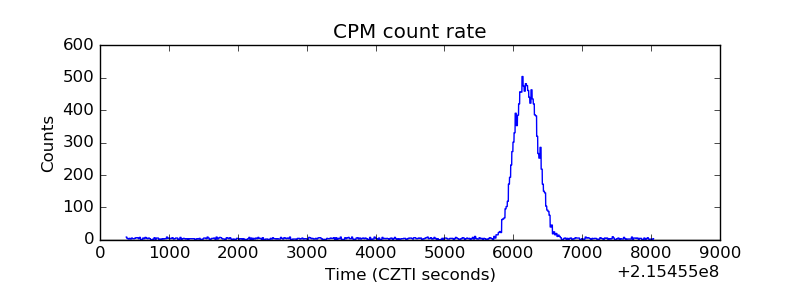 |
| CZT Counter |  |
| +2.5 Volts monitor |  |
| +5 Volts monitor | 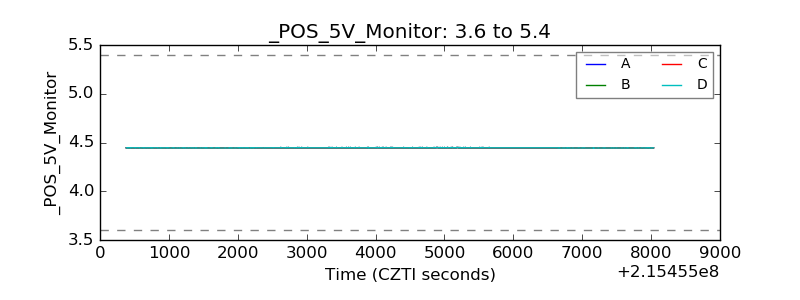 |
| _ROLL_ROT | 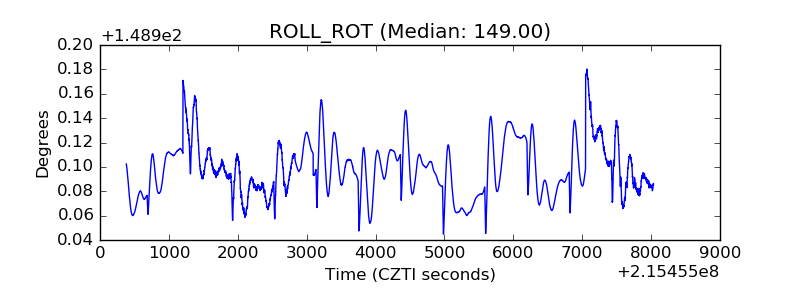 |
| _Roll_DEC | 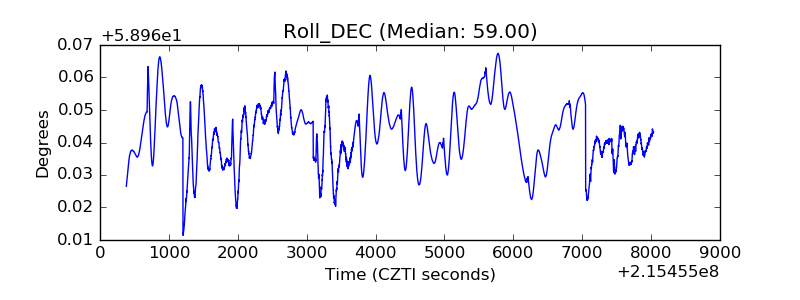 |
| _Roll_RA | 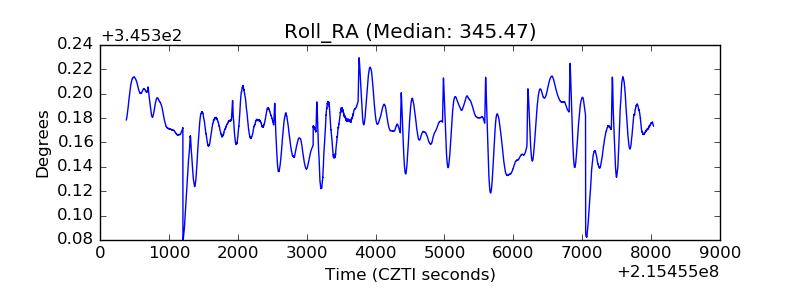 |
| Veto Counter | 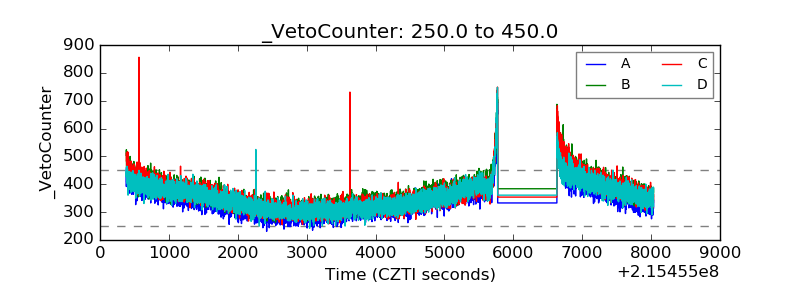 |