| Param | Original file | Final file |
|---|---|---|
| Filename | modeM0/AS1G06_023T01_9000000762_05886cztM0_level2.evt | modeM0/AS1G06_023T01_9000000762_05886cztM0_level2_quad_clean.evt |
| Size (bytes) | 464,431,680 | 91,108,800 |
| Size | 442.9 MB | 86.9 MB |
| Events in quadrant A | 2,946,368 | 593,467 |
| Events in quadrant B | 3,719,140 | 581,699 |
| Events in quadrant C | 2,875,721 | 574,938 |
| Events in quadrant D | 4,076,152 | 549,047 |
| Mode SS | |||
|---|---|---|---|
| Quadrant | BADHDUFLAG | Total packets | Discarded packets |
| A | 0 | 134 | 0 |
| B | 0 | 134 | 0 |
| C | 0 | 134 | 0 |
| D | 0 | 134 | 0 |
| Mode M0 | |||
|---|---|---|---|
| Quadrant | BADHDUFLAG | Total packets | Discarded packets |
| A | 0 | 13555 | 3 |
| B | 0 | 15891 | 2 |
| C | 0 | 13430 | 2 |
| D | 0 | 16860 | 2 |
| Mode M9 | |||
|---|---|---|---|
| Quadrant | BADHDUFLAG | Total packets | Discarded packets |
| A | 0 | 15 | 0 |
| B | 0 | 15 | 0 |
| C | 0 | 15 | 0 |
| D | 0 | 16 | 0 |
| Quadrant | Total seconds | Saturated seconds | Saturation percentage |
|---|---|---|---|
| A | 6595 | 22 | 0.333586% |
| B | 6595 | 73 | 1.106899% |
| C | 6595 | 16 | 0.242608% |
| D | 6595 | 61 | 0.924943% |
Noise dominated data is calculated using 1-second bins in cleaned event files. If a bin has >2000 counts, and if more than 50% of those come from <1% of pixels, then it is considered to be noise-dominated and hence unusable.
| Quadrant | # 1 sec bins | Bins with >0 counts | Bins with >2000 counts | High rate bins dominated by noise | Noise dominated (total time) | Noise dominated (detector-on time) | Marked lightcurve |
|---|---|---|---|---|---|---|---|
| A | 7595 | 6596 | 2 | 2 | 0.03% | 0.03% | 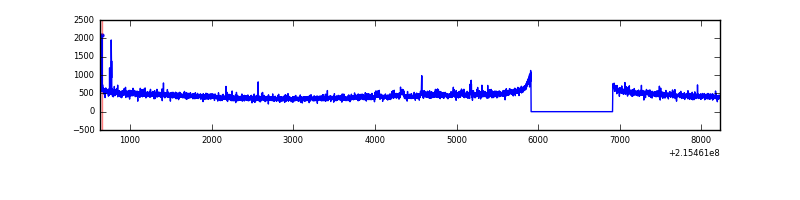 |
| B | 7595 | 6596 | 12 | 12 | 0.16% | 0.18% | 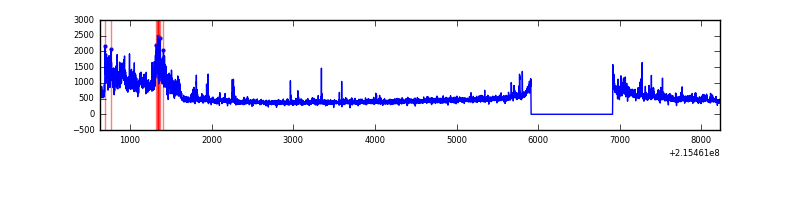 |
| C | 7595 | 6596 | 0 | 0 | 0.00% | 0.00% | 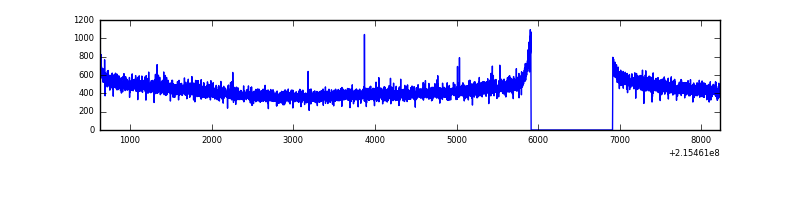 |
| D | 7595 | 6596 | 26 | 26 | 0.34% | 0.39% | 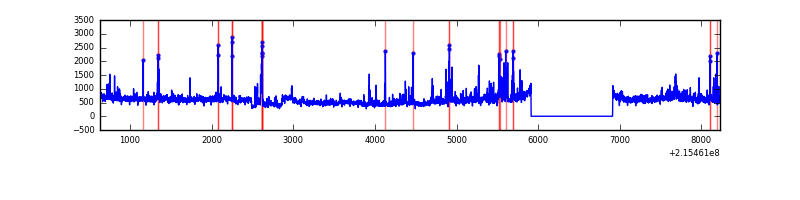 |
Top three noisy pixels from each quadrant. If the there are fewer than three noisy pixels in the level2.evt file, extra rows are filled as -1
| Pixel properties | Quadrant properties | ||||||
|---|---|---|---|---|---|---|---|
| Quadrant | DetID | PixID | Counts | Sigma | Mean | Median | Sigma |
| A | 15 | 234 | 47823 | 308.83 | 750 | 737 | 152.5 |
| A | 15 | 236 | 11698 | 71.89 | 750 | 737 | 152.5 |
| A | 0 | 226 | 7485 | 44.26 | 750 | 737 | 152.5 |
| B | 4 | 200 | 593814 | 4098.37 | 756 | 739 | 144.7 |
| B | 15 | 204 | 71597 | 489.66 | 756 | 739 | 144.7 |
| B | 4 | 81 | 48188 | 327.89 | 756 | 739 | 144.7 |
| C | 1 | 16 | 9718 | 52.49 | 733 | 736 | 171.1 |
| C | 13 | 61 | 5986 | 30.68 | 733 | 736 | 171.1 |
| C | 8 | 222 | 3179 | 14.28 | 733 | 736 | 171.1 |
| D | 1 | 20 | 739716 | 4172.67 | 728 | 706 | 177.1 |
| D | 2 | 152 | 324477 | 1828.11 | 728 | 706 | 177.1 |
| D | 1 | 239 | 99402 | 557.27 | 728 | 706 | 177.1 |
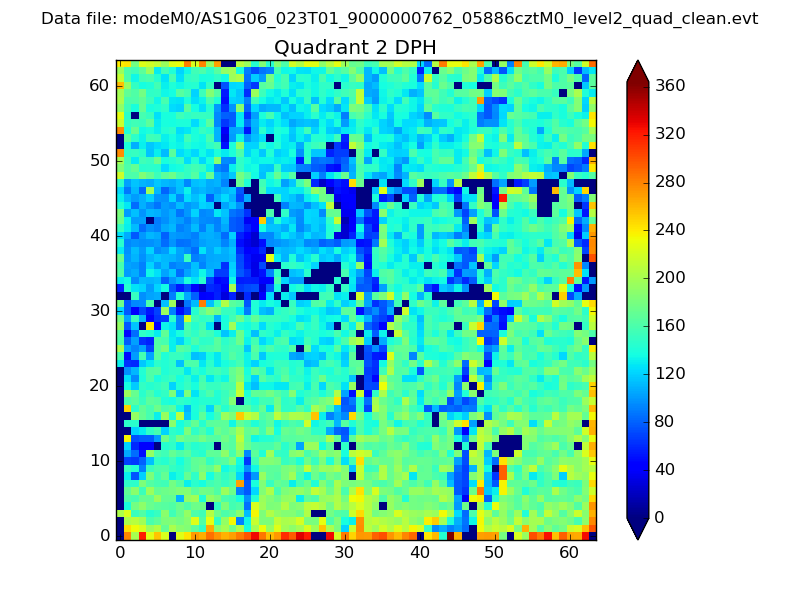
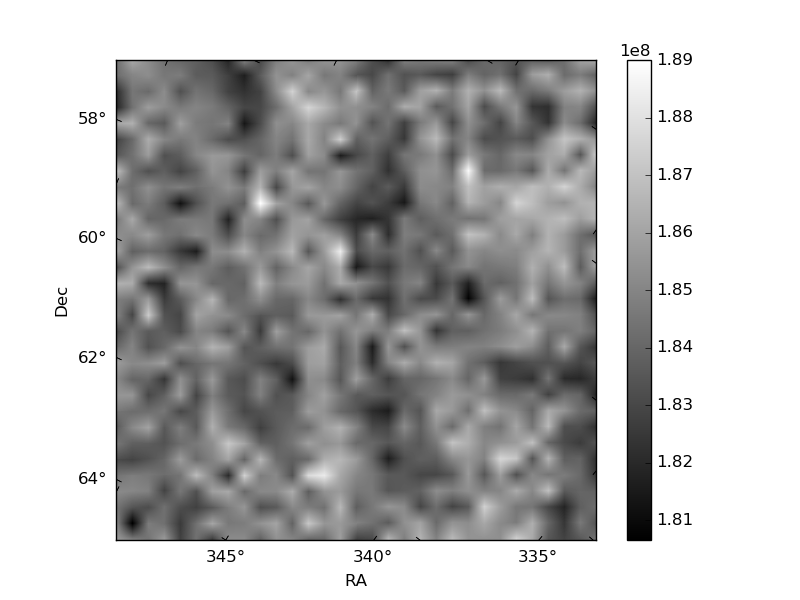
Histogram calculated using DETX and DETY for each event in the final _common_clean file
| Quadrant A |  |
 |
Quadrant B |
|---|---|---|---|
| Quadrant D | 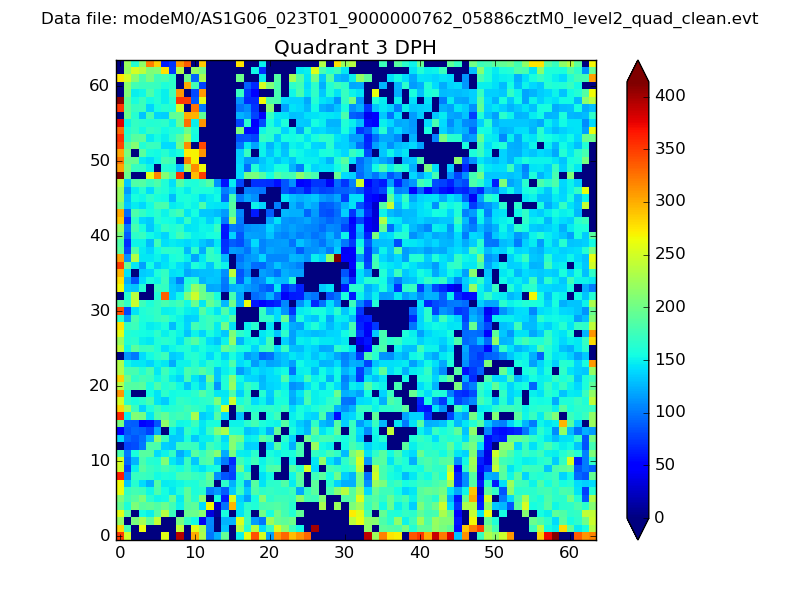 |
 |
Quadrant C |
| Plot type | Count rate plots | Images |
|---|---|---|
| Comparison with Poisson distribution Blue bars denote a histogram of data divided into 1 sec bins. Red curve is a Poisson curve with rate = median count rate of data. |
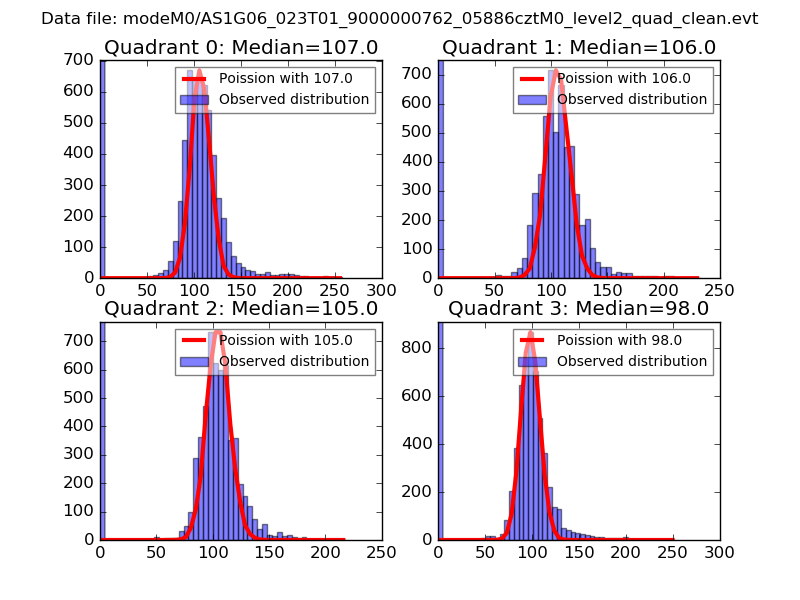 |
 |
| Quadrant-wise count rates Data is divided into 100 sec bins |
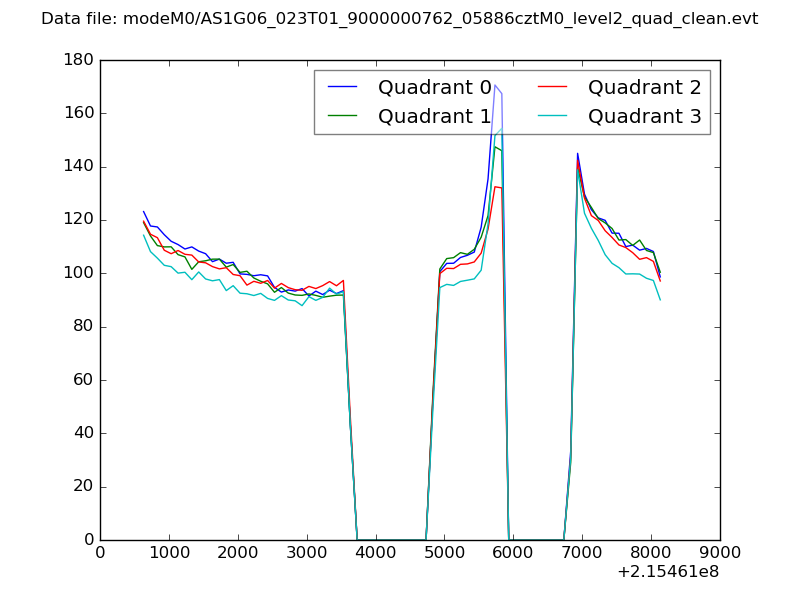 |
|
| Module-wise count rates for Quadrant A Data is divided into 100 sec bins |
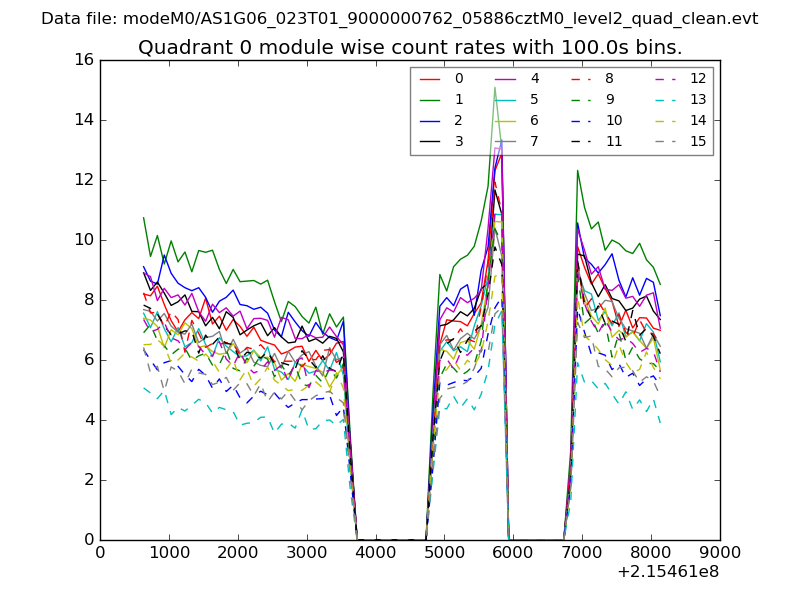 |
 |
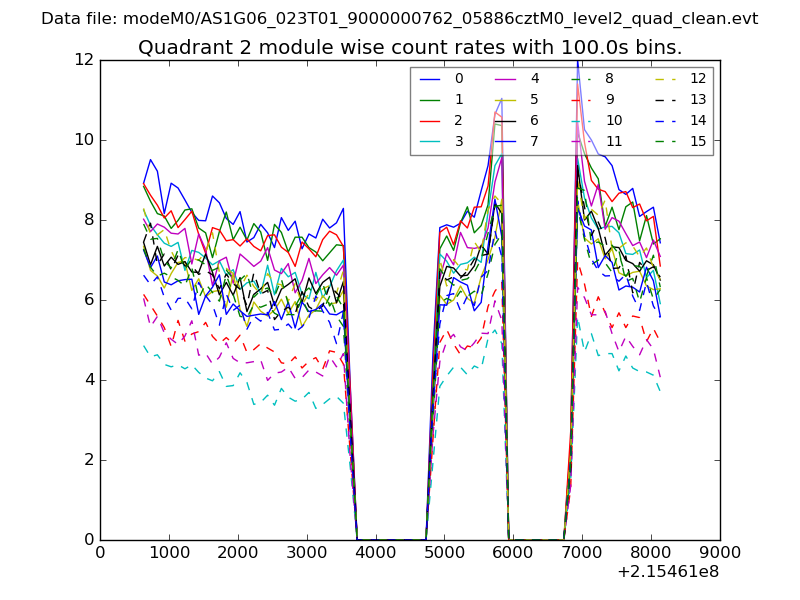
| Module-wise count rates for Quadrant B Data is divided into 100 sec bins |
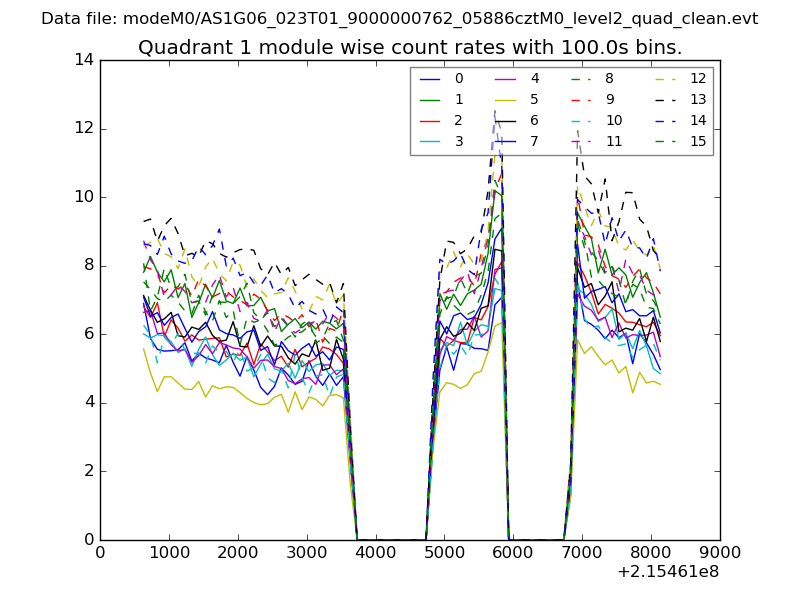 |
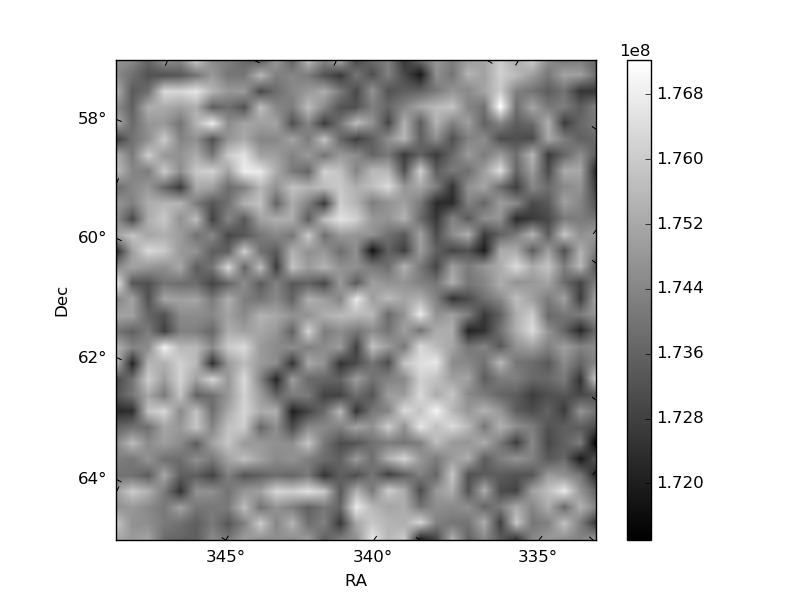 |
| Module-wise count rates for Quadrant C Data is divided into 100 sec bins |
 |
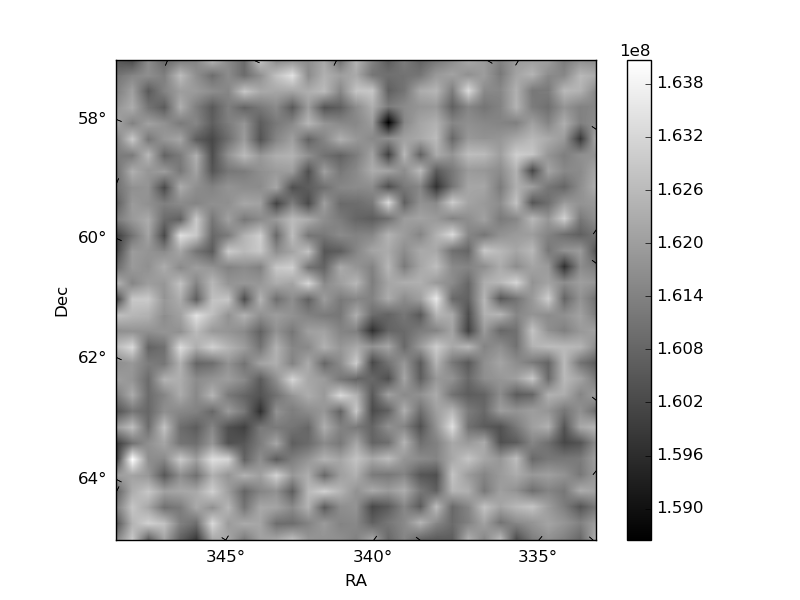 |
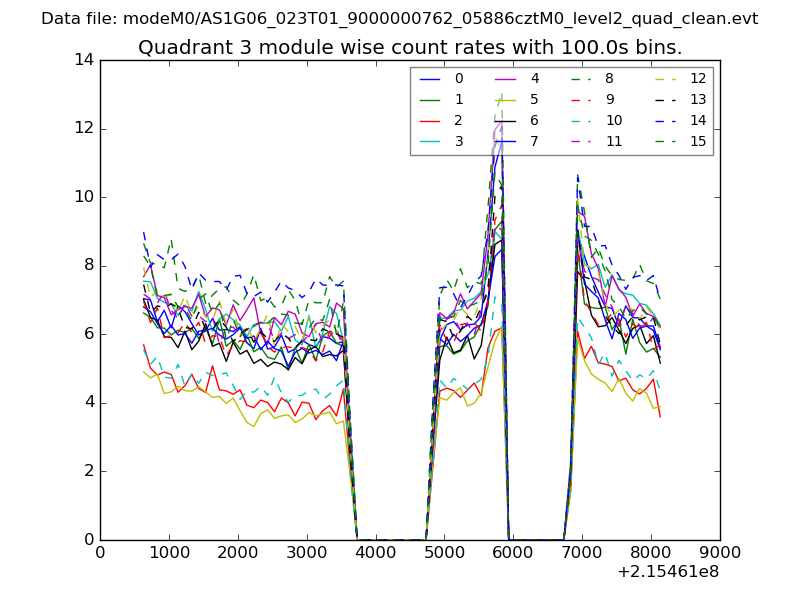
| Module-wise count rates for Quadrant D Data is divided into 100 sec bins |
 |
 |
| Parameter | Plot |
|---|---|
| CZT HV Monitor | 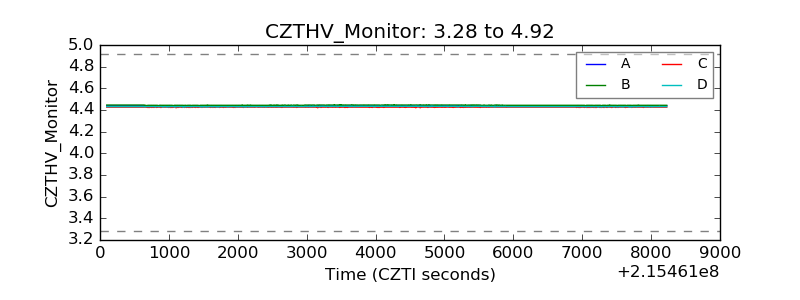 |
| D_VDD | 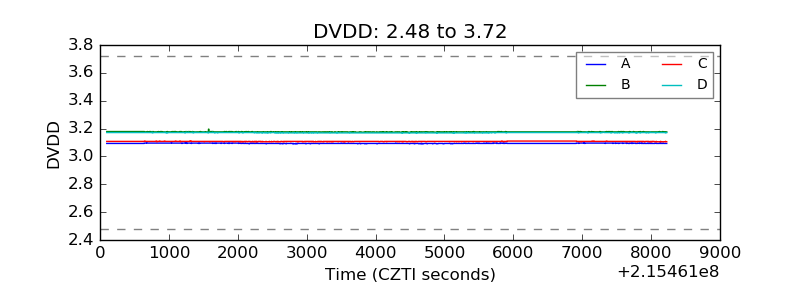 |
| Temperature 1 | 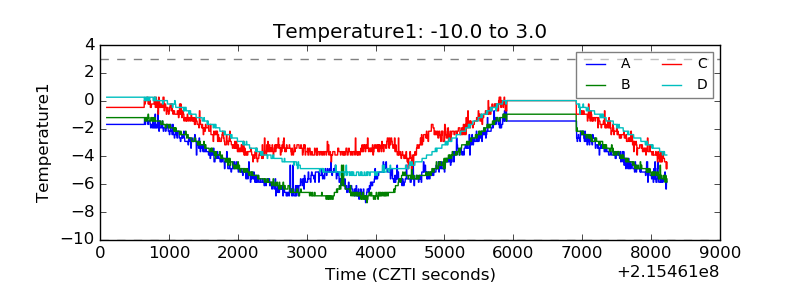 |
| Veto HV Monitor | 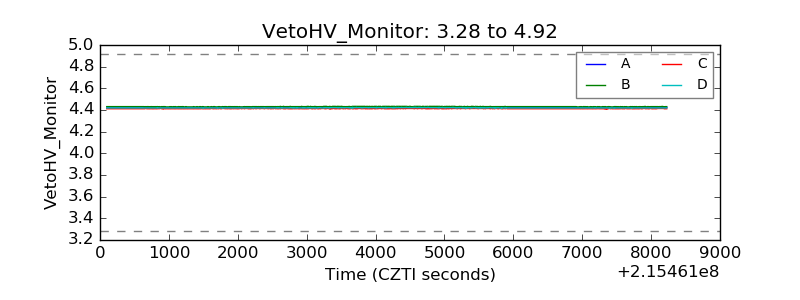 |
| Veto LLD |  |
| Alpha Counter | 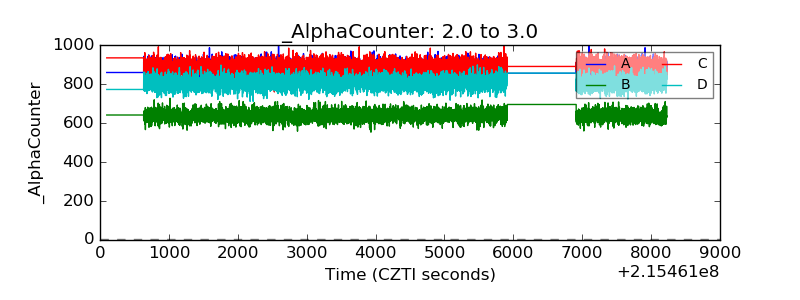 |
| _CPM_Rate | 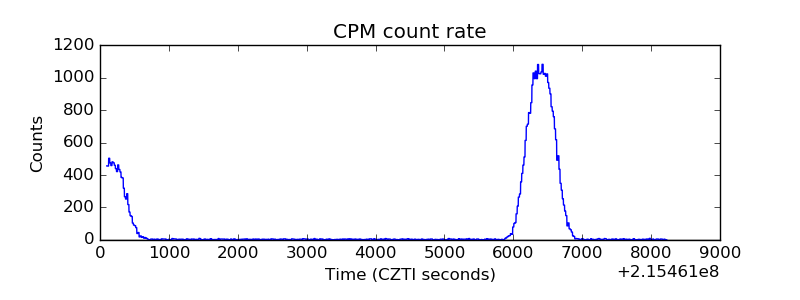 |
| CZT Counter | 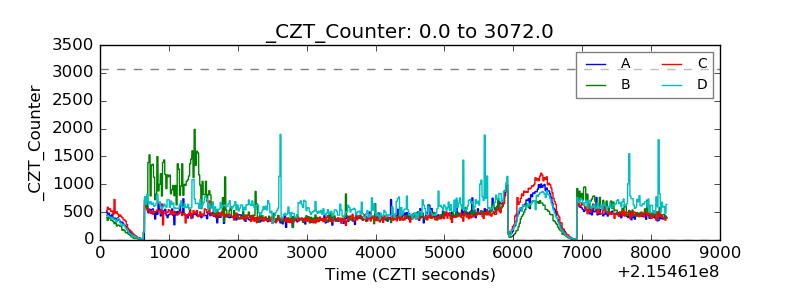 |
| +2.5 Volts monitor |  |
| +5 Volts monitor | 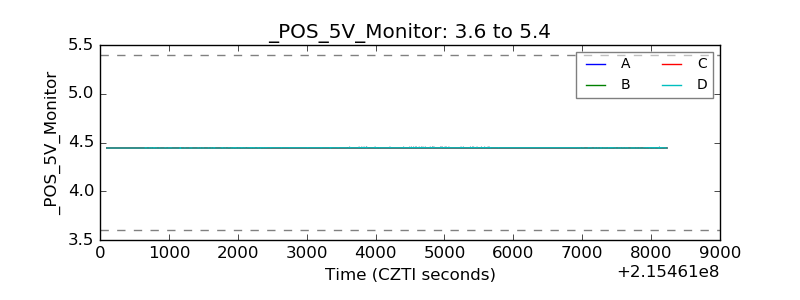 |
| _ROLL_ROT | 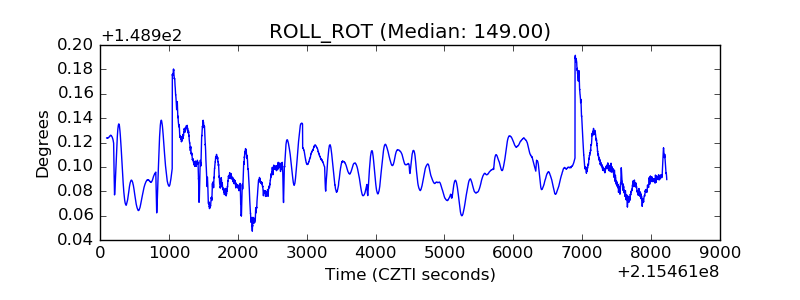 |
| _Roll_DEC | 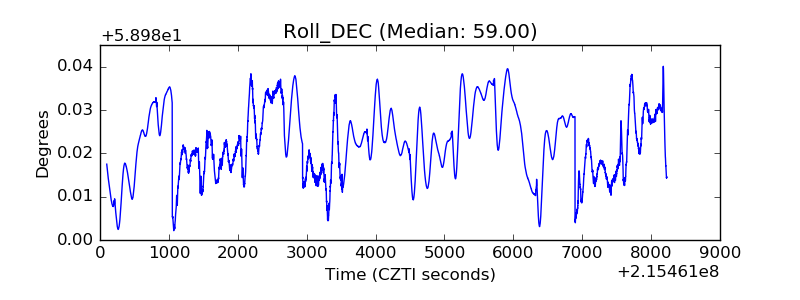 |
| _Roll_RA | 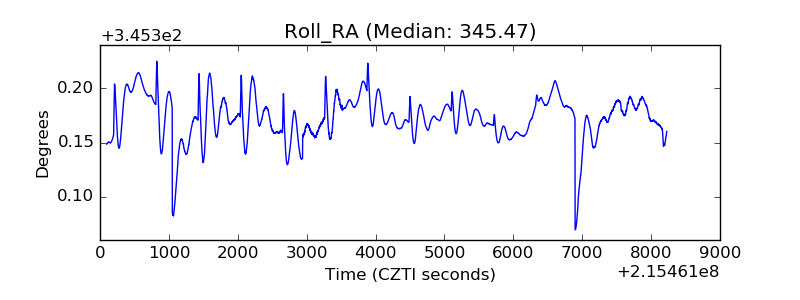 |
| Veto Counter | 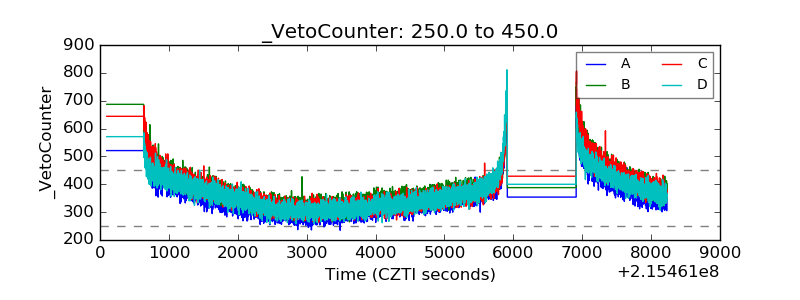 |