| Param | Original file | Final file |
|---|---|---|
| Filename | modeM0/AS1G06_023T01_9000000762_05888cztM0_level2.evt | modeM0/AS1G06_023T01_9000000762_05888cztM0_level2_quad_clean.evt |
| Size (bytes) | 384,252,480 | 73,448,640 |
| Size | 366.5 MB | 70.0 MB |
| Events in quadrant A | 2,410,912 | 477,453 |
| Events in quadrant B | 2,681,445 | 472,311 |
| Events in quadrant C | 2,404,055 | 463,376 |
| Events in quadrant D | 3,769,551 | 429,244 |
| Mode SS | |||
|---|---|---|---|
| Quadrant | BADHDUFLAG | Total packets | Discarded packets |
| A | 0 | 112 | 0 |
| B | 0 | 112 | 0 |
| C | 0 | 112 | 0 |
| D | 0 | 112 | 0 |
| Mode M0 | |||
|---|---|---|---|
| Quadrant | BADHDUFLAG | Total packets | Discarded packets |
| A | 0 | 11271 | 2 |
| B | 0 | 12009 | 2 |
| C | 0 | 11299 | 2 |
| D | 0 | 14924 | 2 |
| Mode M9 | |||
|---|---|---|---|
| Quadrant | BADHDUFLAG | Total packets | Discarded packets |
| A | 0 | 22 | 0 |
| B | 0 | 22 | 0 |
| C | 0 | 22 | 0 |
| D | 0 | 22 | 0 |
| Quadrant | Total seconds | Saturated seconds | Saturation percentage |
|---|---|---|---|
| A | 5456 | 25 | 0.458211% |
| B | 5456 | 45 | 0.824780% |
| C | 5456 | 32 | 0.586510% |
| D | 5456 | 263 | 4.820381% |
Noise dominated data is calculated using 1-second bins in cleaned event files. If a bin has >2000 counts, and if more than 50% of those come from <1% of pixels, then it is considered to be noise-dominated and hence unusable.
| Quadrant | # 1 sec bins | Bins with >0 counts | Bins with >2000 counts | High rate bins dominated by noise | Noise dominated (total time) | Noise dominated (detector-on time) | Marked lightcurve |
|---|---|---|---|---|---|---|---|
| A | 7596 | 5458 | 0 | 0 | 0.00% | 0.00% | 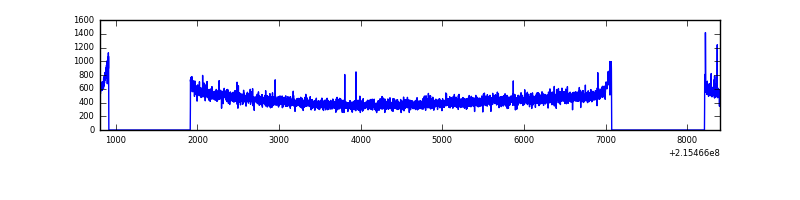 |
| B | 7596 | 5458 | 0 | 0 | 0.00% | 0.00% | 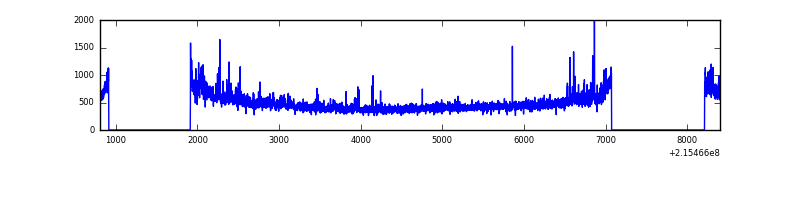 |
| C | 7596 | 5458 | 0 | 0 | 0.00% | 0.00% | 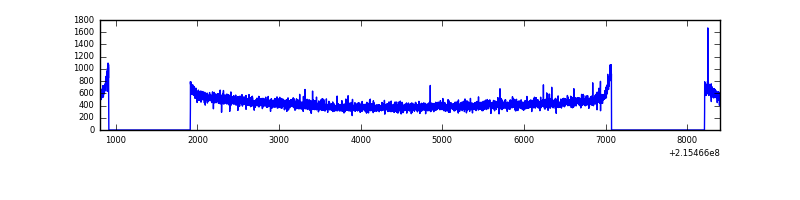 |
| D | 7595 | 5457 | 108 | 108 | 1.42% | 1.98% | 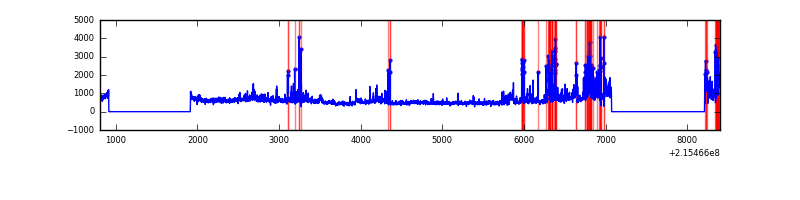 |
Top three noisy pixels from each quadrant. If the there are fewer than three noisy pixels in the level2.evt file, extra rows are filled as -1
| Pixel properties | Quadrant properties | ||||||
|---|---|---|---|---|---|---|---|
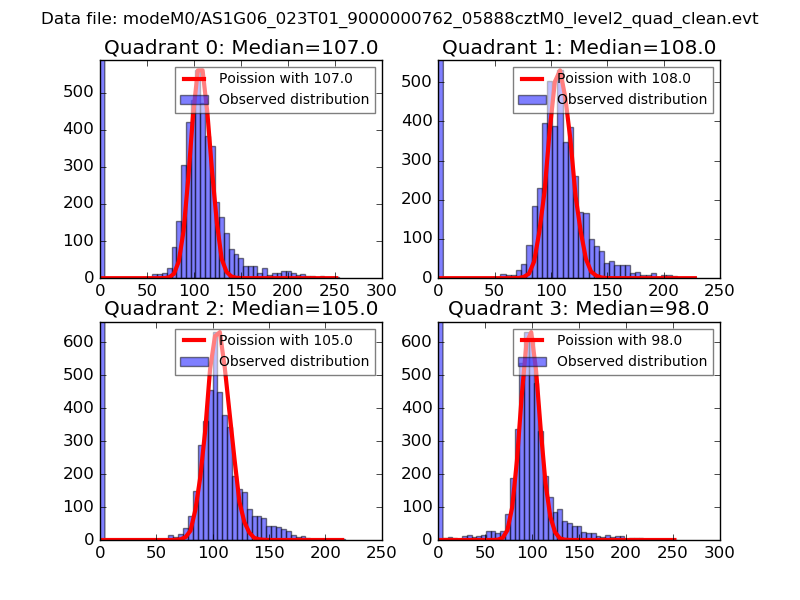
| Quadrant | DetID | PixID | Counts | Sigma | Mean | Median | Sigma |
| A | 15 | 236 | 6693 | 47.87 | 624 | 609 | 127.1 |
| A | 0 | 226 | 6081 | 43.05 | 624 | 609 | 127.1 |
| A | 12 | 194 | 6006 | 42.46 | 624 | 609 | 127.1 |
| B | 15 | 204 | 97238 | 805.97 | 631 | 617 | 119.9 |
| B | 4 | 200 | 44553 | 366.49 | 631 | 617 | 119.9 |
| B | 0 | 245 | 27566 | 224.8 | 631 | 617 | 119.9 |
| C | 1 | 16 | 16081 | 108.43 | 609 | 613 | 142.7 |
| C | 8 | 208 | 7047 | 45.1 | 609 | 613 | 142.7 |
| C | 13 | 61 | 4890 | 29.98 | 609 | 613 | 142.7 |
| D | 1 | 20 | 708992 | 4862.8 | 592 | 572 | 145.7 |
| D | 2 | 152 | 351252 | 2407.17 | 592 | 572 | 145.7 |
| D | 2 | 14 | 127887 | 873.93 | 592 | 572 | 145.7 |
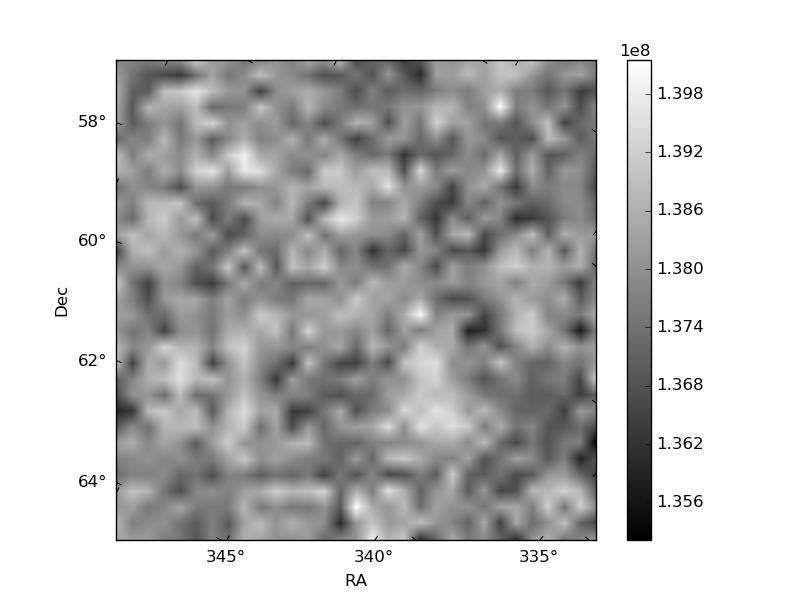
Histogram calculated using DETX and DETY for each event in the final _common_clean file
| Quadrant A | 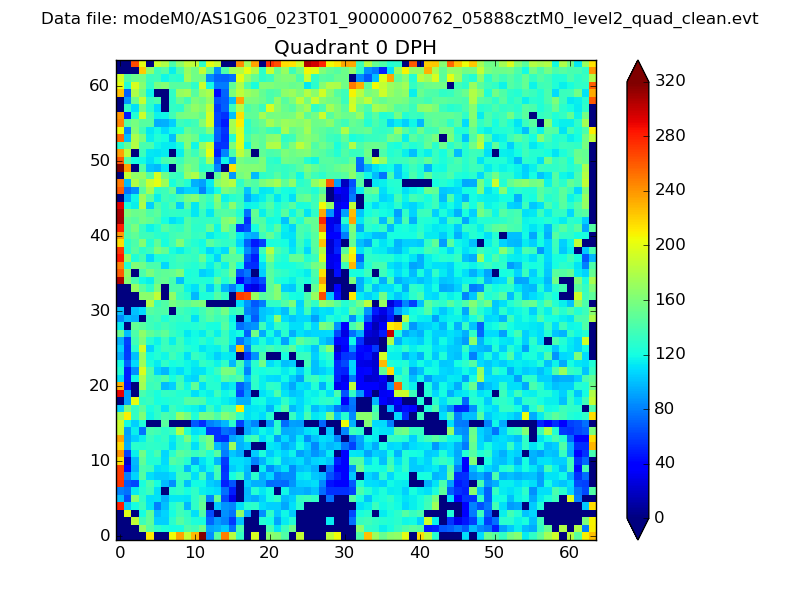 |
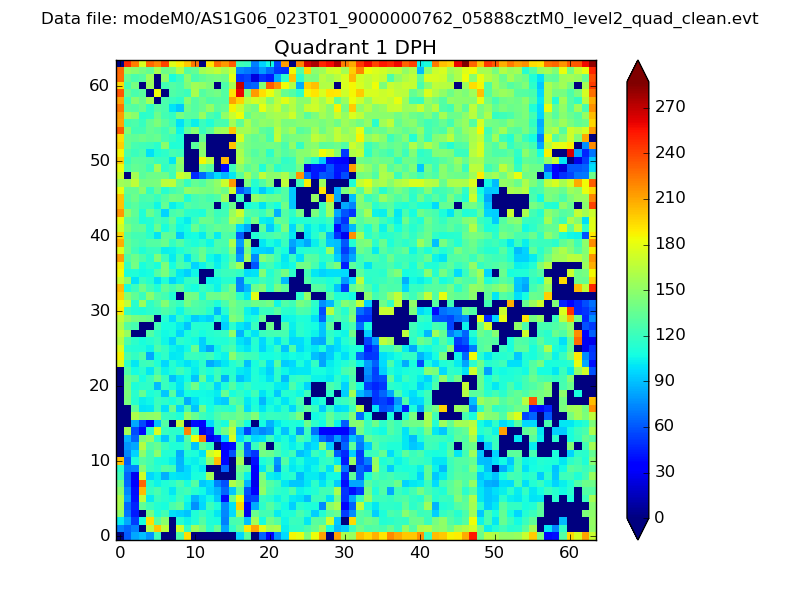 |
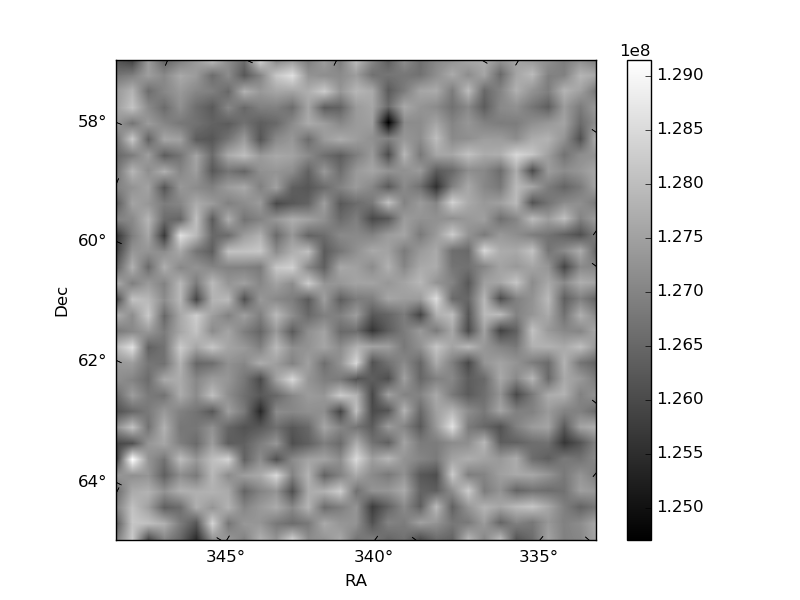
Quadrant B |
|---|---|---|---|
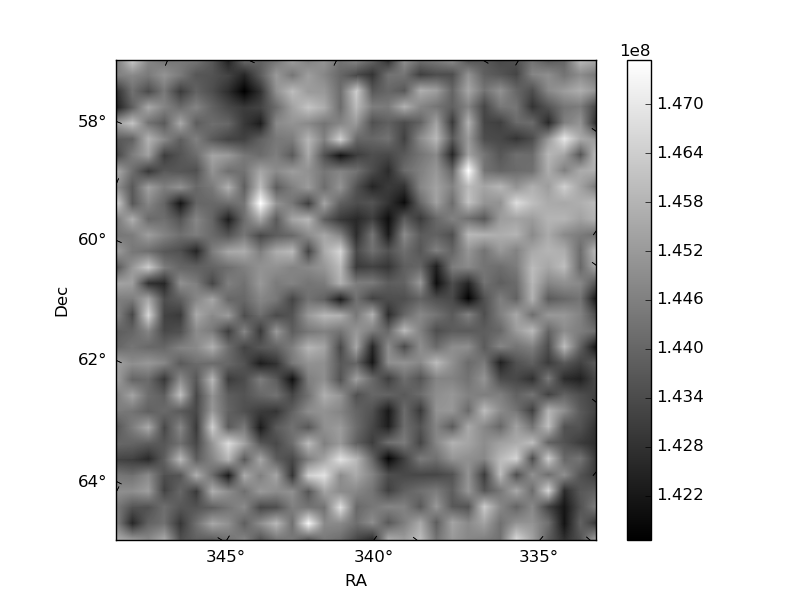
| Quadrant D | 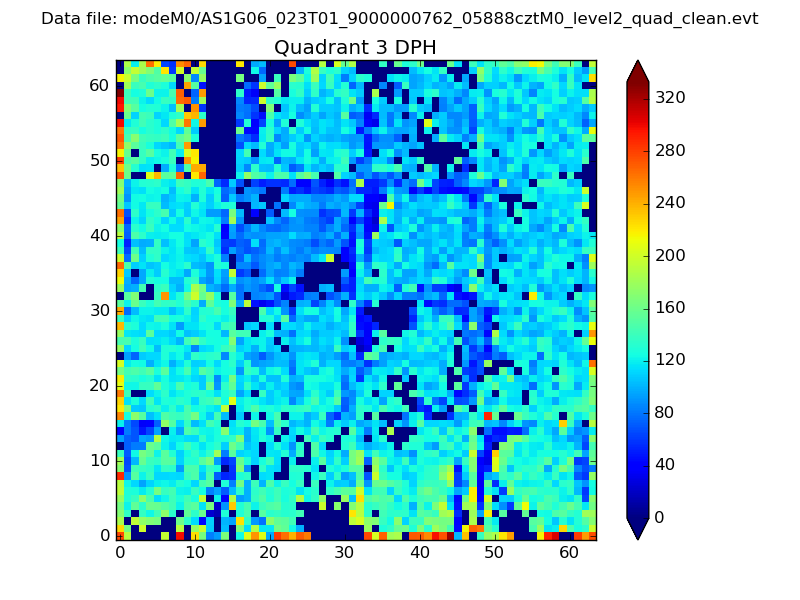 |
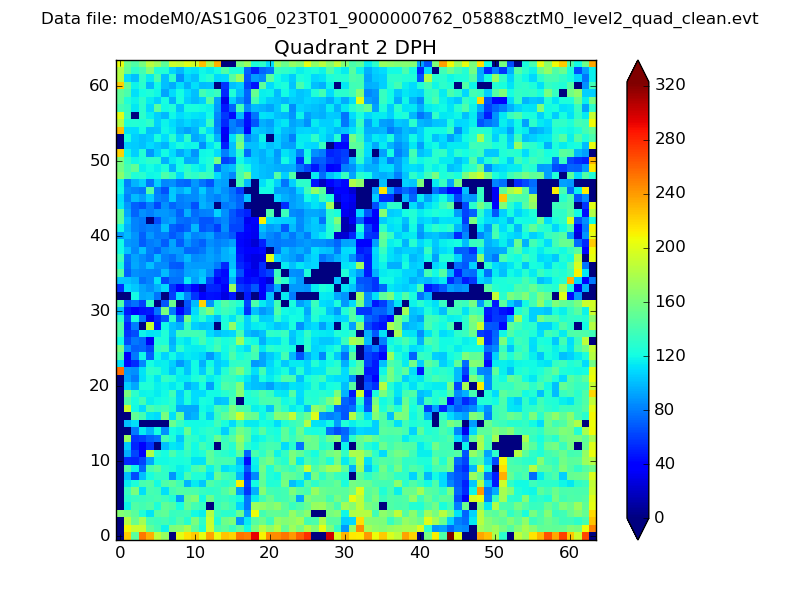 |
Quadrant C |
| Plot type | Count rate plots | Images |
|---|---|---|
| Comparison with Poisson distribution Blue bars denote a histogram of data divided into 1 sec bins. Red curve is a Poisson curve with rate = median count rate of data. |
 |
 |
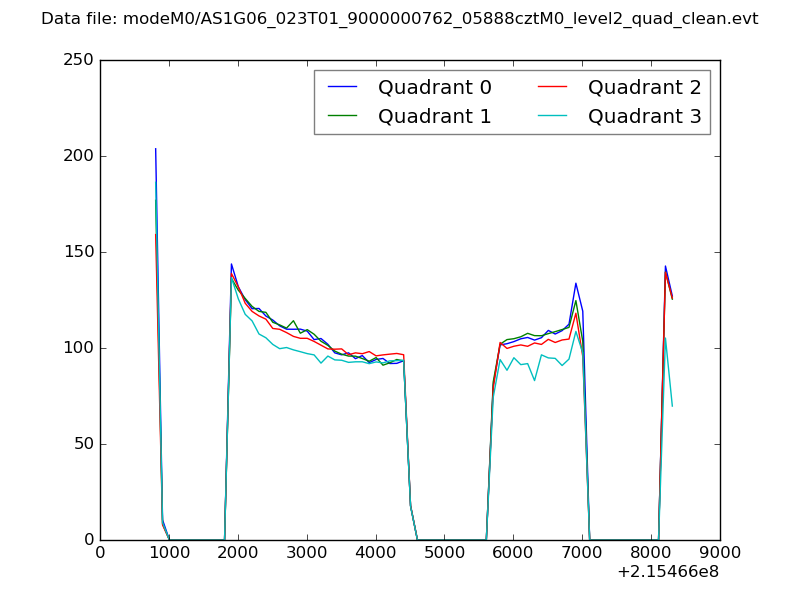
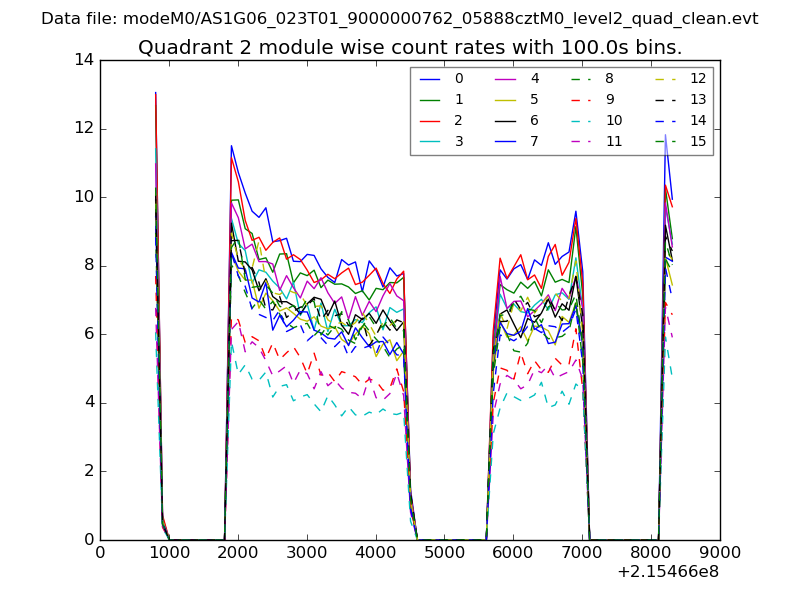
| Quadrant-wise count rates Data is divided into 100 sec bins |
 |
|
| Module-wise count rates for Quadrant A Data is divided into 100 sec bins |
 |
 |
| Module-wise count rates for Quadrant B Data is divided into 100 sec bins |
 |
 |
| Module-wise count rates for Quadrant C Data is divided into 100 sec bins |
 |
 |
| Module-wise count rates for Quadrant D Data is divided into 100 sec bins |
 |
 |
| Parameter | Plot |
|---|---|
| CZT HV Monitor | 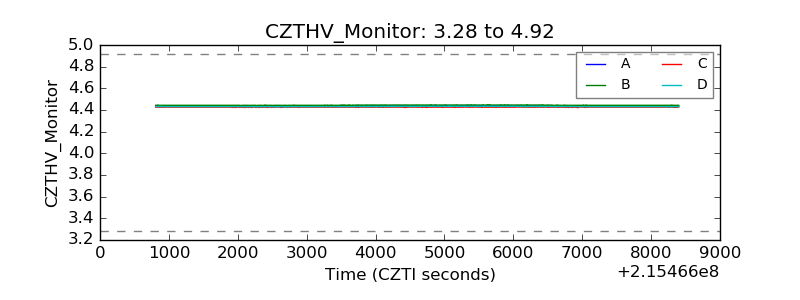 |
| D_VDD | 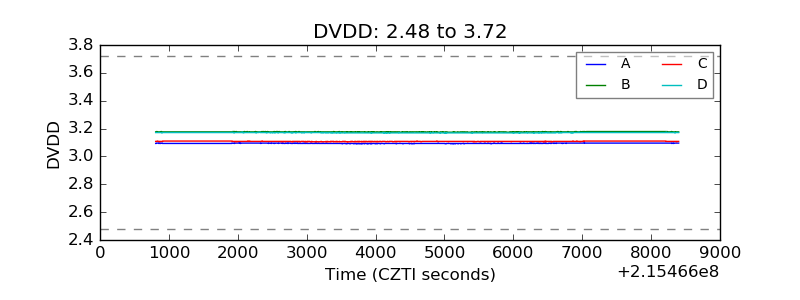 |
| Temperature 1 | 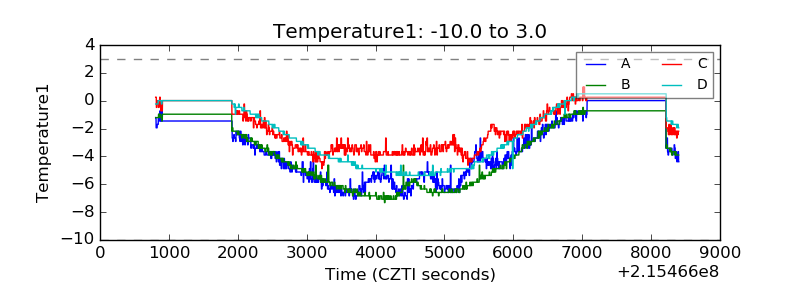 |
| Veto HV Monitor | 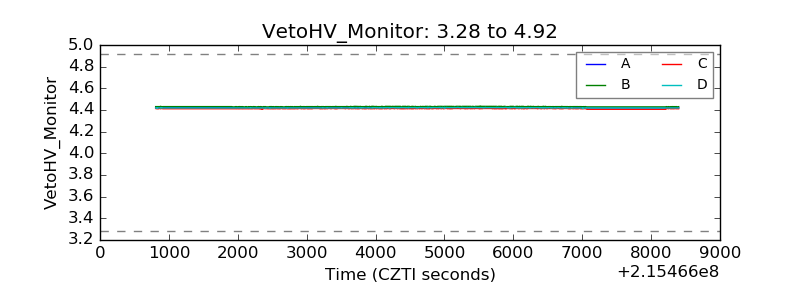 |
| Veto LLD |  |
| Alpha Counter | 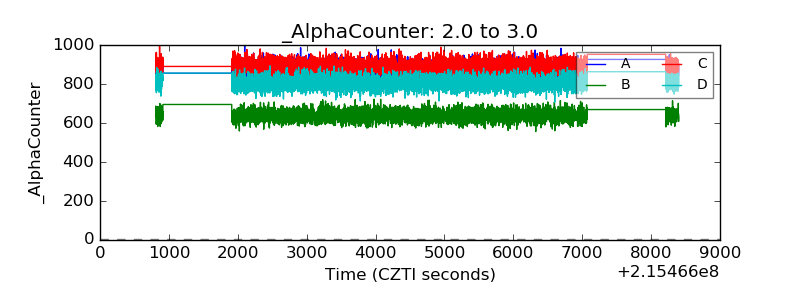 |
| _CPM_Rate | 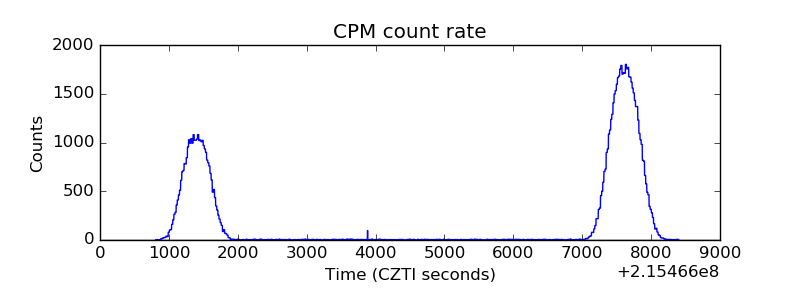 |
| CZT Counter | 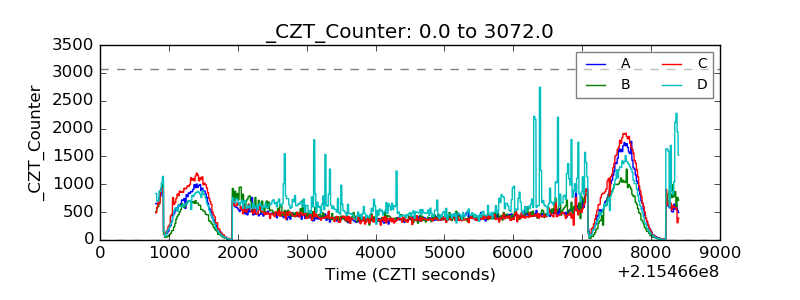 |
| +2.5 Volts monitor |  |
| +5 Volts monitor |  |
| _ROLL_ROT |  |
| _Roll_DEC | 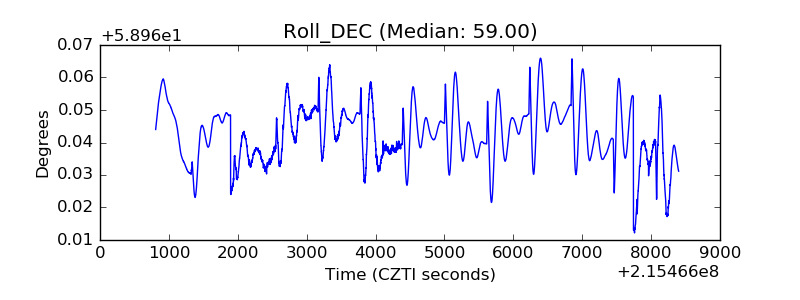 |
| _Roll_RA | 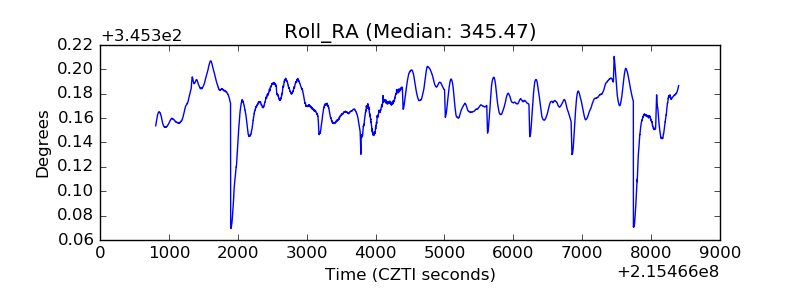 |
| Veto Counter |  |