| Param | Original file | Final file |
|---|---|---|
| Filename | modeM0/AS1A02_114T01_9000000764cztM0_level2.fits | modeM0/AS1A02_114T01_9000000764cztM0_level2_quad_clean.evt |
| Size (bytes) | 576,532,800 | 576,144,000 |
| Size | 549.8 MB | 549.5 MB |
| Events in quadrant A | 3,423,238 | 3,401,129 |
| Events in quadrant B | 3,355,276 | 3,413,674 |
| Events in quadrant C | 3,427,808 | 3,290,147 |
| Events in quadrant D | 2,918,128 | 3,008,727 |
| Mode M9 | |||
|---|---|---|---|
| Quadrant | BADHDUFLAG | Total packets | Discarded packets |
| A | 0 | 87 | 0 |
| B | 0 | 87 | 0 |
| C | 0 | 87 | 0 |
| D | 0 | 88 | 0 |
| Mode SS | |||
|---|---|---|---|
| Quadrant | BADHDUFLAG | Total packets | Discarded packets |
| A | 0 | 1286 | 0 |
| B | 0 | 1288 | 0 |
| C | 0 | 1288 | 0 |
| D | 0 | 1288 | 0 |
| Mode M0 | |||
|---|---|---|---|
| Quadrant | BADHDUFLAG | Total packets | Discarded packets |
| A | 0 | 130200 | 0 |
| B | 0 | 132065 | 0 |
| C | 0 | 129675 | 0 |
| D | 0 | 152223 | 0 |
| Quadrant | Total seconds | Saturated seconds | Saturation percentage |
|---|---|---|---|
| A | 63183 | 1035 | 1.638099% |
| B | 63186 | 1165 | 1.843763% |
| C | 63205 | 775 | 1.226169% |
| D | 63189 | 1631 | 2.581145% |
Noise dominated data is calculated using 1-second bins in cleaned event files. If a bin has >2000 counts, and if more than 50% of those come from <1% of pixels, then it is considered to be noise-dominated and hence unusable.
| Quadrant | # 1 sec bins | Bins with >0 counts | Bins with >2000 counts | High rate bins dominated by noise | Noise dominated (total time) | Noise dominated (detector-on time) | Marked lightcurve |
|---|---|---|---|---|---|---|---|
| A | 81520 | 63227 | 0 | 0 | 0.00% | 0.00% | 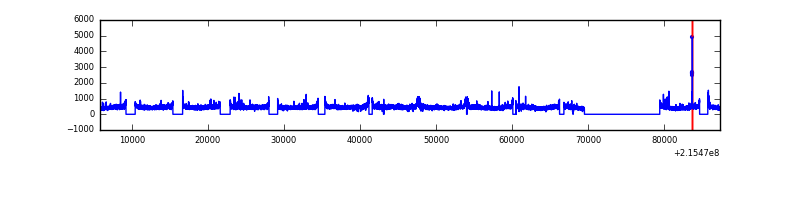 |
| B | 81520 | 63231 | 0 | 0 | 0.00% | 0.00% | 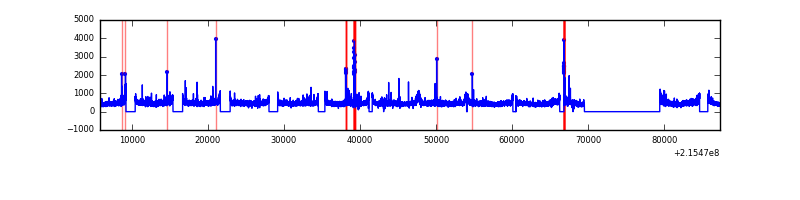 |
| C | 81520 | 63232 | 0 | 0 | 0.00% | 0.00% | 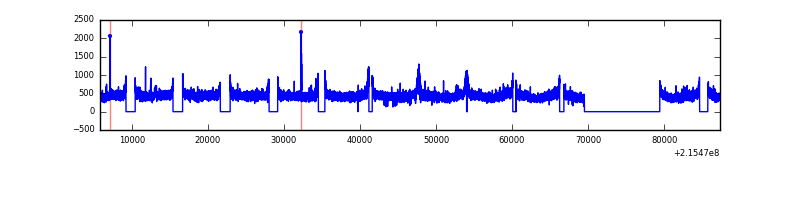 |
| D | 81520 | 63205 | 0 | 0 | 0.00% | 0.00% | 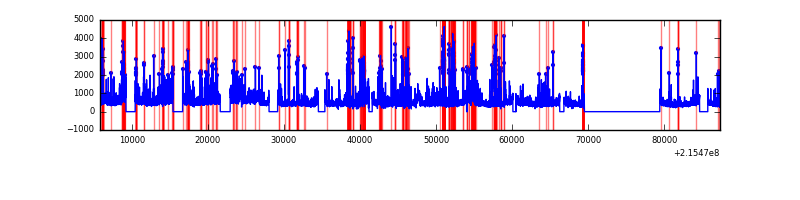 |
Top three noisy pixels from each quadrant. If the there are fewer than three noisy pixels in the level2.evt file, extra rows are filled as -1
| Pixel properties | Quadrant properties | ||||||
|---|---|---|---|---|---|---|---|
| Quadrant | DetID | PixID | Counts | Sigma | Mean | Median | Sigma |
| A | 14 | 188 | 3462 | 11.59 | 886 | 826 | 227.4 |
| A | 0 | 29 | 3401 | 11.33 | 886 | 826 | 227.4 |
| A | 14 | 204 | 2968 | 9.42 | 886 | 826 | 227.4 |
| B | 2 | 9 | 2915 | 11.5 | 883 | 837 | 180.7 |
| B | 14 | 254 | 2322 | 8.22 | 883 | 837 | 180.7 |
| B | 3 | 17 | 2308 | 8.14 | 883 | 837 | 180.7 |
| C | 1 | 80 | 2536 | 7.05 | 904 | 835 | 241.3 |
| C | 1 | 81 | 2470 | 6.78 | 904 | 835 | 241.3 |
| C | 12 | 241 | 2391 | 6.45 | 904 | 835 | 241.3 |
| D | 3 | 14 | 2241 | 6.63 | 831 | 751 | 224.6 |
| D | 6 | 231 | 2200 | 6.45 | 831 | 751 | 224.6 |
| D | 7 | 5 | 2125 | 6.12 | 831 | 751 | 224.6 |
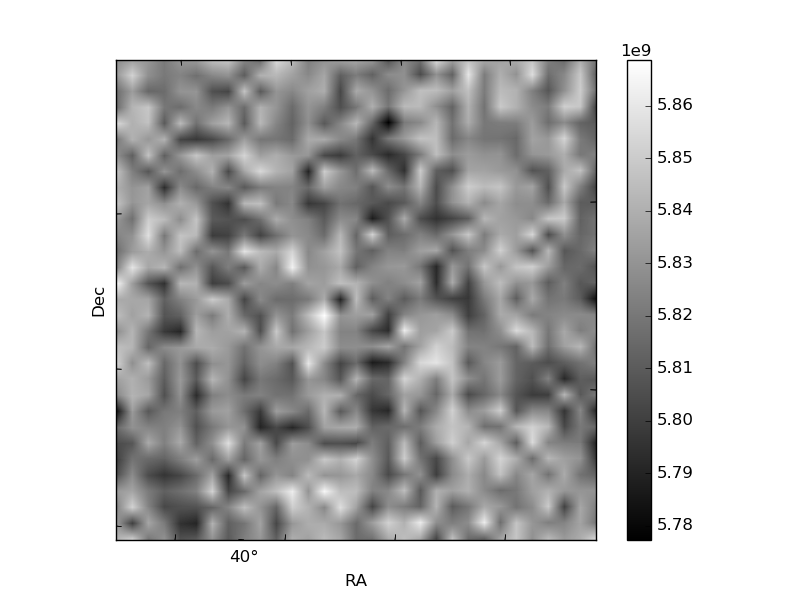
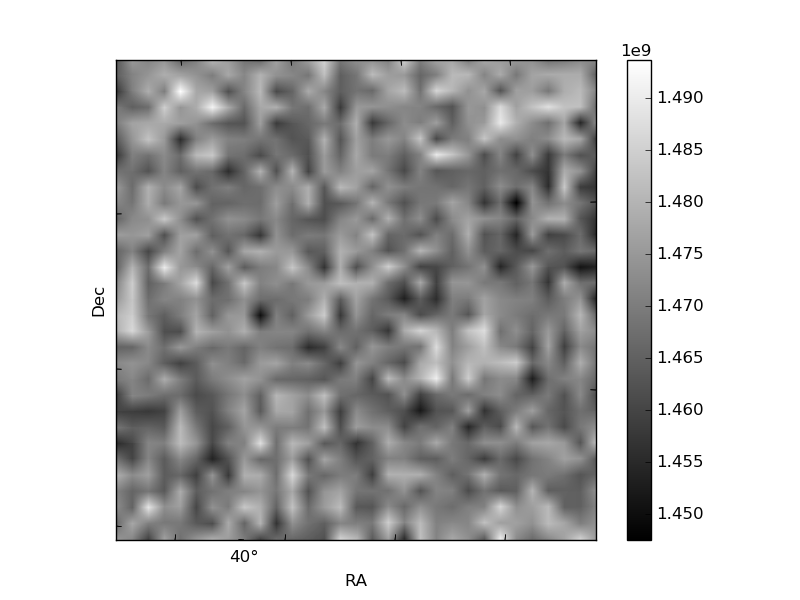
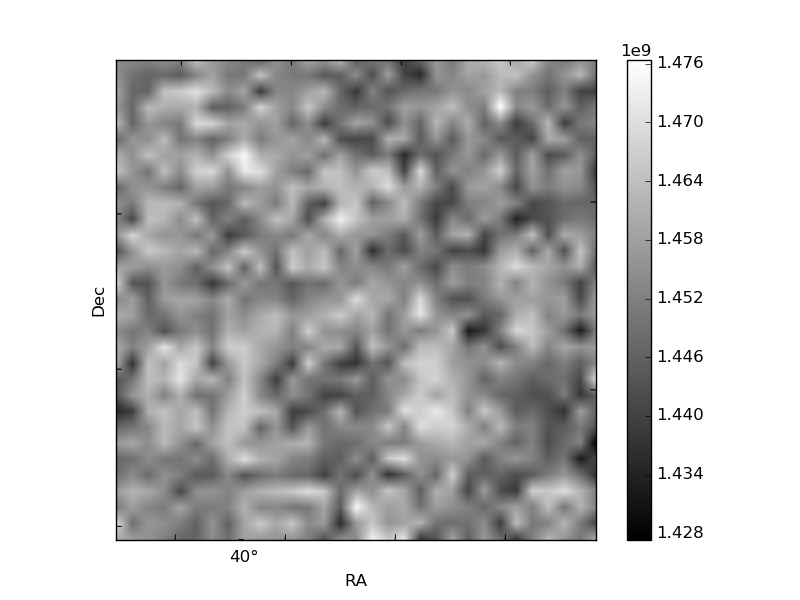
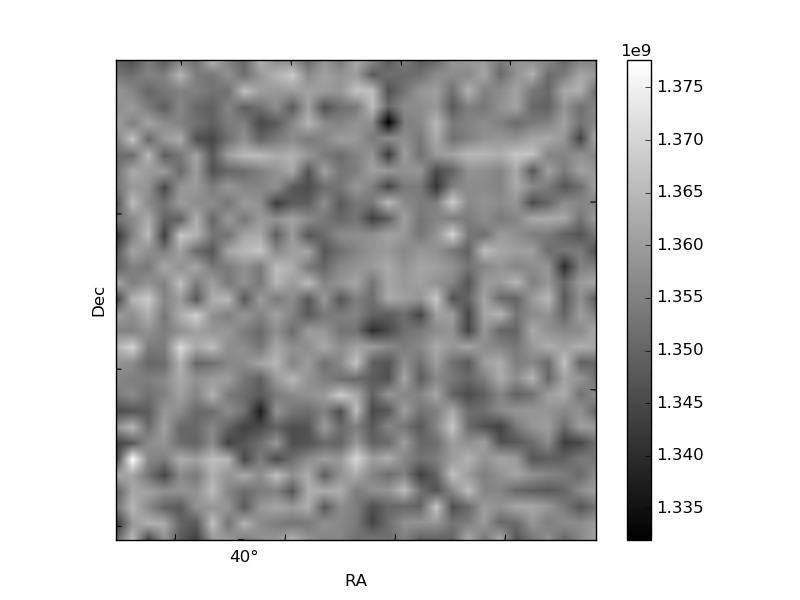
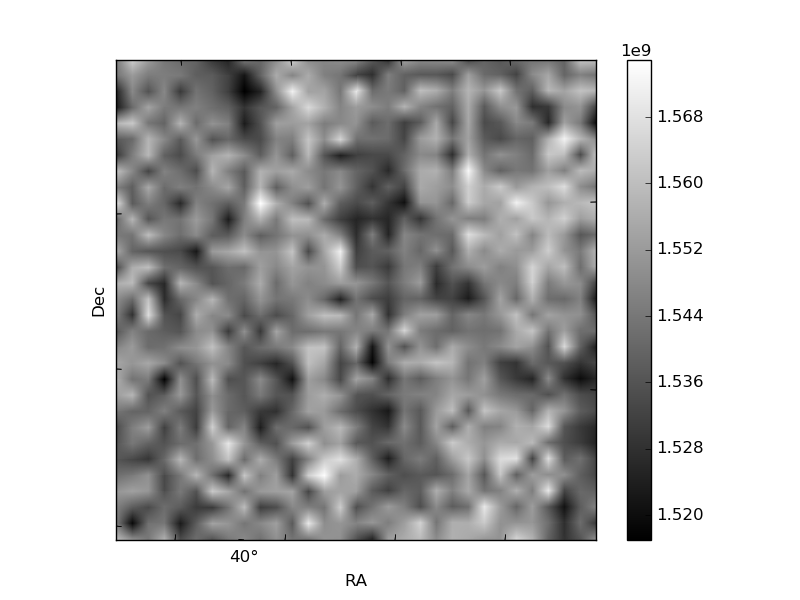
Histogram calculated using DETX and DETY for each event in the final _common_clean file
| Quadrant A | 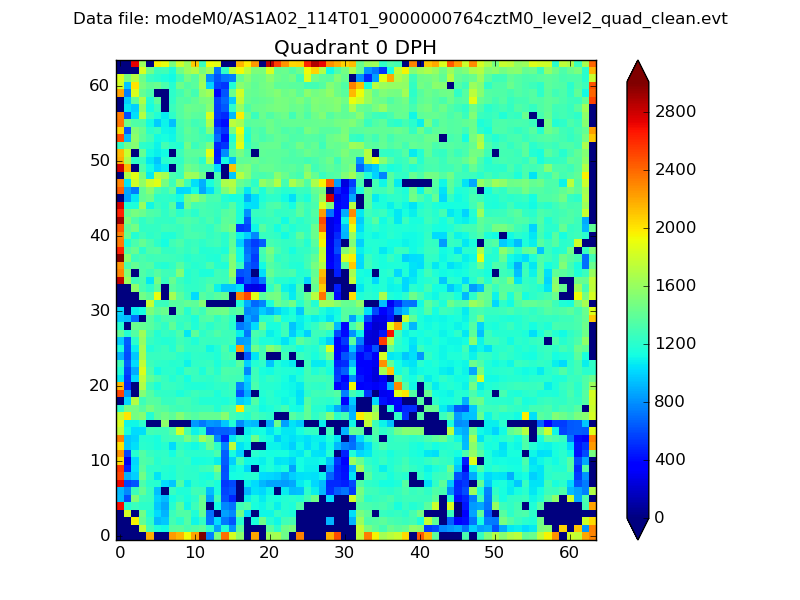 |
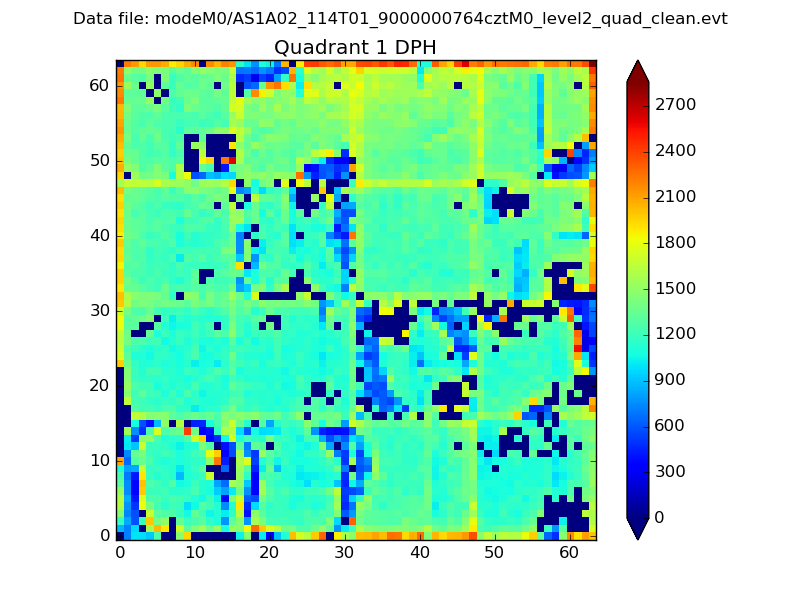 |
Quadrant B |
|---|---|---|---|
| Quadrant D | 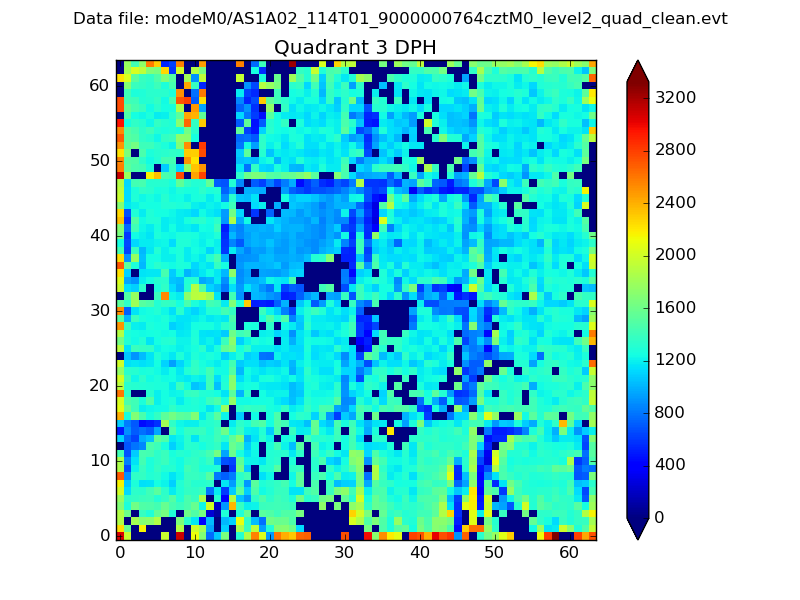 |
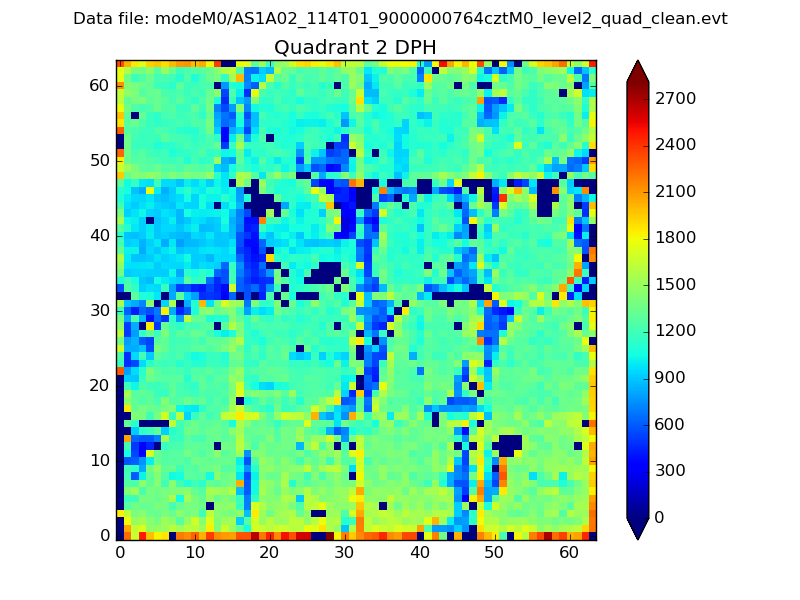 |
Quadrant C |
| Plot type | Count rate plots | Images |
|---|---|---|
| Comparison with Poisson distribution Blue bars denote a histogram of data divided into 1 sec bins. Red curve is a Poisson curve with rate = median count rate of data. |
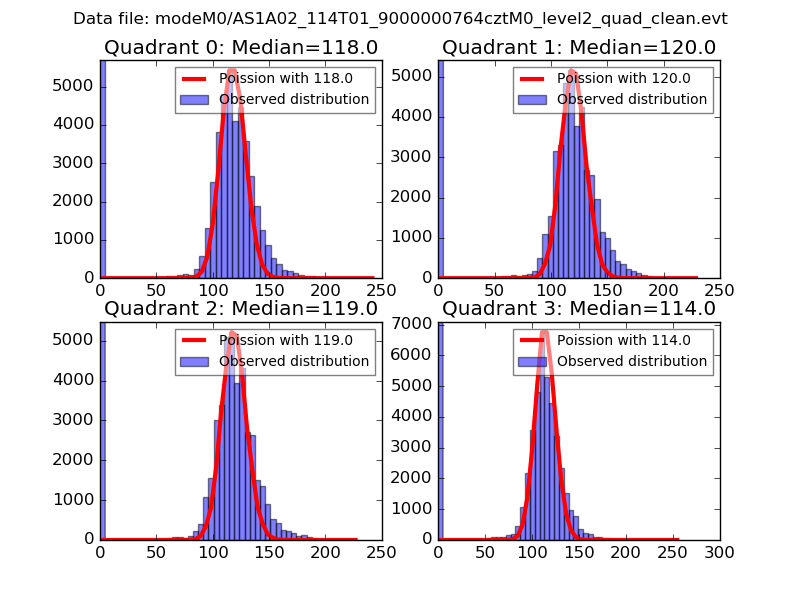 |
 |
| Quadrant-wise count rates Data is divided into 100 sec bins |
 |
|
| Module-wise count rates for Quadrant A Data is divided into 100 sec bins |
 |
 |
| Module-wise count rates for Quadrant B Data is divided into 100 sec bins |
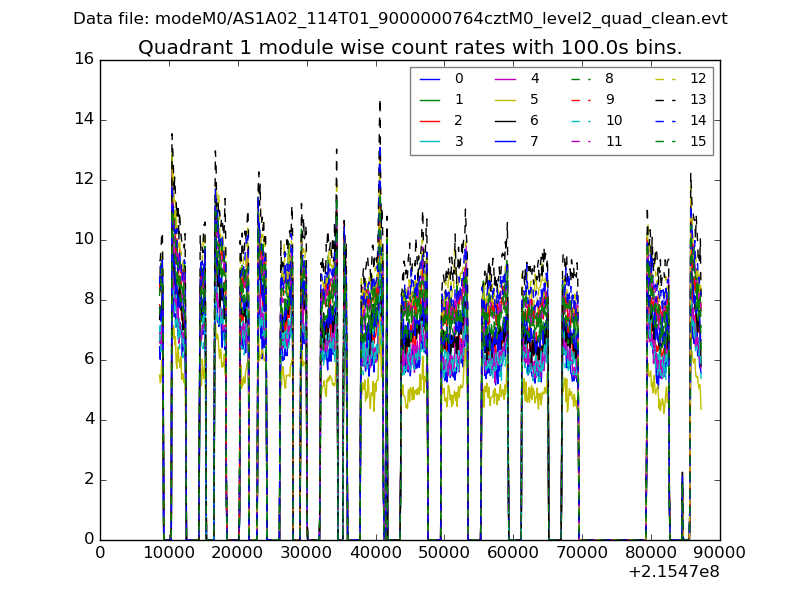 |
 |
| Module-wise count rates for Quadrant C Data is divided into 100 sec bins |
 |
 |
| Module-wise count rates for Quadrant D Data is divided into 100 sec bins |
 |
 |
| Parameter | Plot |
|---|---|
| CZT HV Monitor |  |
| D_VDD | 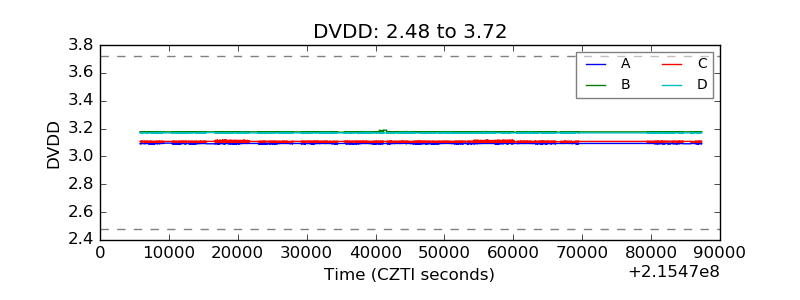 |
| Temperature 1 | 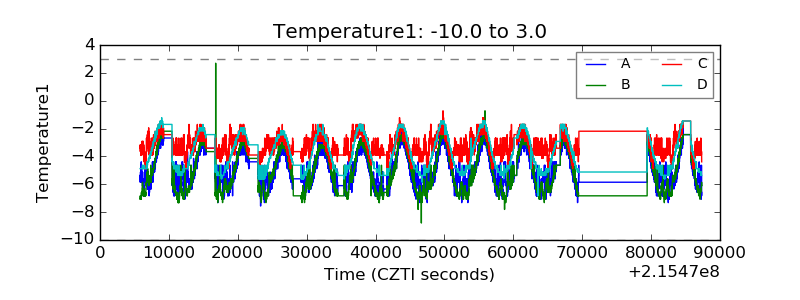 |
| Veto HV Monitor | 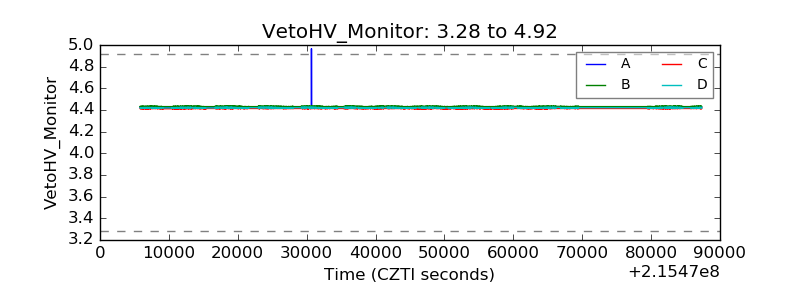 |
| Veto LLD | 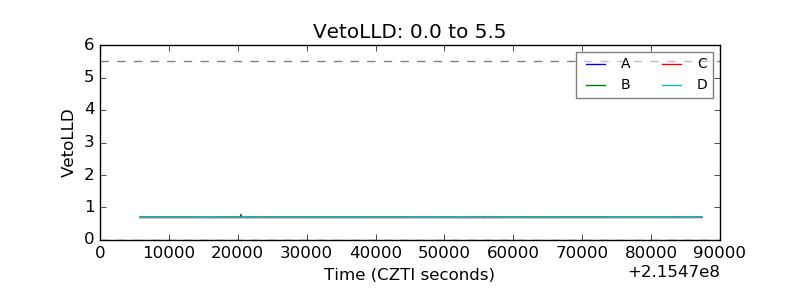 |
| Alpha Counter |  |
| _CPM_Rate |  |
| CZT Counter | 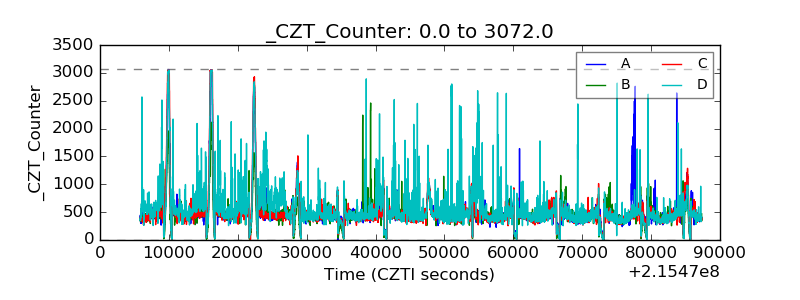 |
| +2.5 Volts monitor | 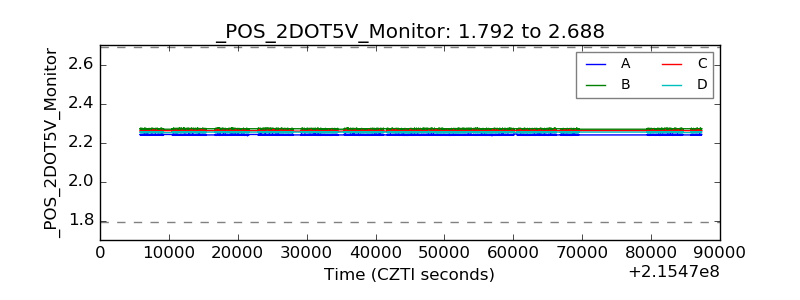 |
| +5 Volts monitor |  |
| _ROLL_ROT | 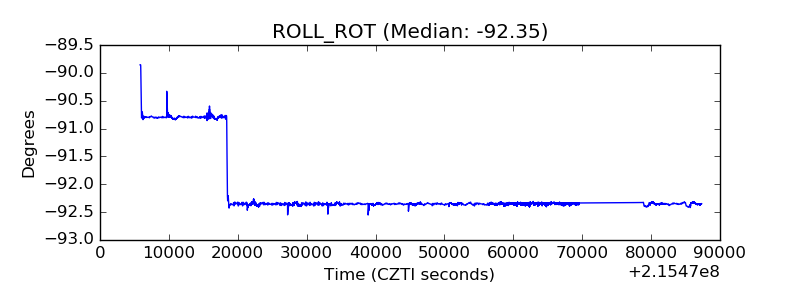 |
| _Roll_DEC | 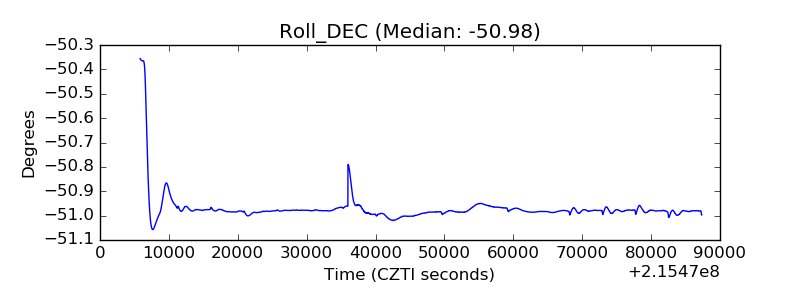 |
| _Roll_RA | 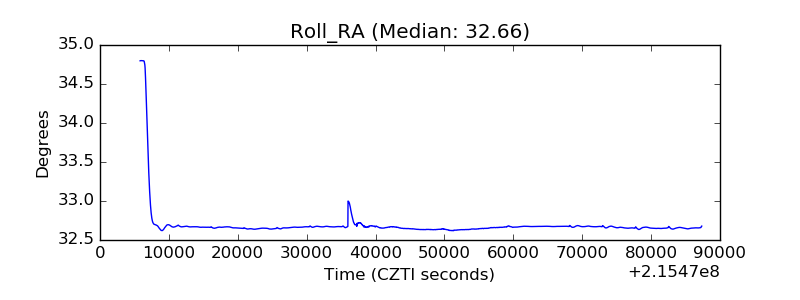 |
| Veto Counter | 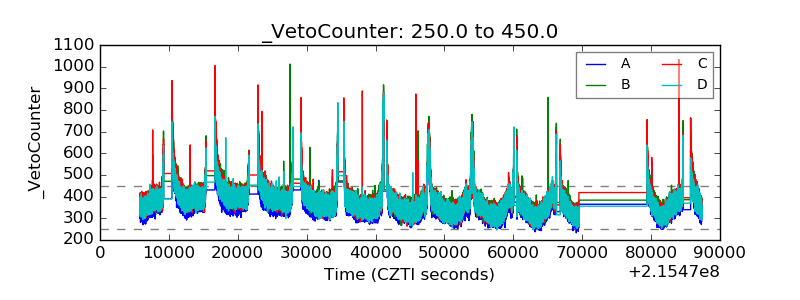 |