| Param | Original file | Final file |
|---|---|---|
| Filename | modeM0/AS1A02_114T01_9000000764_05889cztM0_level2.evt | modeM0/AS1A02_114T01_9000000764_05889cztM0_level2_quad_clean.evt |
| Size (bytes) | 339,880,320 | 52,263,360 |
| Size | 324.1 MB | 49.8 MB |
| Events in quadrant A | 2,197,837 | 312,257 |
| Events in quadrant B | 2,322,682 | 321,530 |
| Events in quadrant C | 2,213,592 | 313,279 |
| Events in quadrant D | 3,224,086 | 290,124 |
| Mode M9 | |||
|---|---|---|---|
| Quadrant | BADHDUFLAG | Total packets | Discarded packets |
| A | 0 | 12 | 0 |
| B | 0 | 12 | 0 |
| C | 0 | 12 | 0 |
| D | 0 | 12 | 0 |
| Mode SS | |||
|---|---|---|---|
| Quadrant | BADHDUFLAG | Total packets | Discarded packets |
| A | 0 | 100 | 0 |
| B | 0 | 100 | 0 |
| C | 0 | 100 | 0 |
| D | 0 | 100 | 0 |
| Mode M0 | |||
|---|---|---|---|
| Quadrant | BADHDUFLAG | Total packets | Discarded packets |
| A | 0 | 10011 | 2 |
| B | 0 | 10214 | 1 |
| C | 0 | 10006 | 1 |
| D | 0 | 12788 | 1 |
| Quadrant | Total seconds | Saturated seconds | Saturation percentage |
|---|---|---|---|
| A | 4918 | 9 | 0.183001% |
| B | 4918 | 27 | 0.549004% |
| C | 4918 | 7 | 0.142334% |
| D | 4918 | 77 | 1.565677% |
Noise dominated data is calculated using 1-second bins in cleaned event files. If a bin has >2000 counts, and if more than 50% of those come from <1% of pixels, then it is considered to be noise-dominated and hence unusable.
| Quadrant | # 1 sec bins | Bins with >0 counts | Bins with >2000 counts | High rate bins dominated by noise | Noise dominated (total time) | Noise dominated (detector-on time) | Marked lightcurve |
|---|---|---|---|---|---|---|---|
| A | 6138 | 4919 | 0 | 0 | 0.00% | 0.00% | 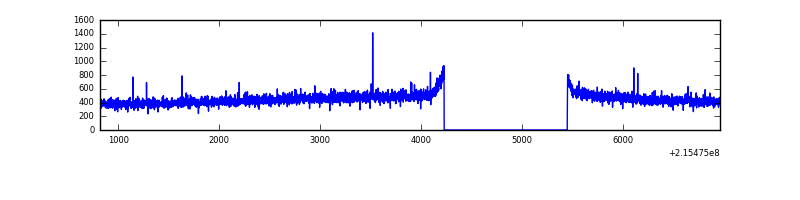 |
| B | 6138 | 4919 | 2 | 2 | 0.03% | 0.04% | 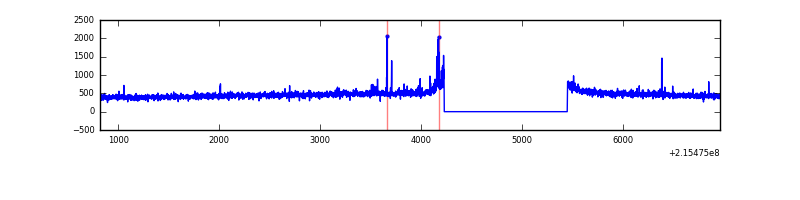 |
| C | 6138 | 4919 | 1 | 1 | 0.02% | 0.02% | 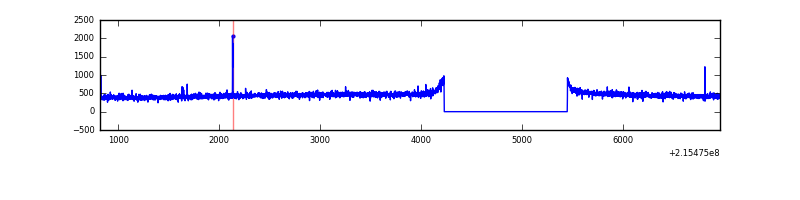 |
| D | 6138 | 4919 | 51 | 51 | 0.83% | 1.04% | 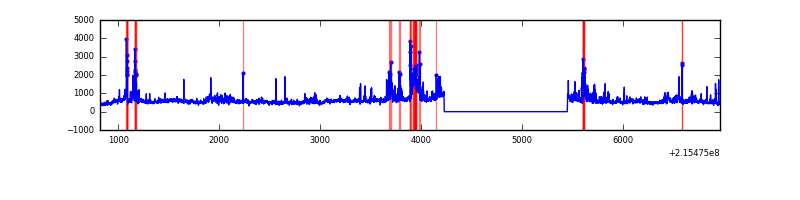 |
Top three noisy pixels from each quadrant. If the there are fewer than three noisy pixels in the level2.evt file, extra rows are filled as -1
| Pixel properties | Quadrant properties | ||||||
|---|---|---|---|---|---|---|---|
| Quadrant | DetID | PixID | Counts | Sigma | Mean | Median | Sigma |
| A | 7 | 16 | 5519 | 42.84 | 568 | 555 | 115.9 |
| A | 12 | 194 | 5286 | 40.83 | 568 | 555 | 115.9 |
| A | 0 | 226 | 5260 | 40.6 | 568 | 555 | 115.9 |
| B | 15 | 255 | 33965 | 300.48 | 580 | 566 | 111.2 |
| B | 15 | 204 | 23573 | 206.98 | 580 | 566 | 111.2 |
| B | 12 | 111 | 10380 | 88.29 | 580 | 566 | 111.2 |
| C | 8 | 208 | 8097 | 57.63 | 564 | 566 | 130.7 |
| C | 13 | 61 | 4453 | 29.74 | 564 | 566 | 130.7 |
| C | 1 | 16 | 2627 | 15.77 | 564 | 566 | 130.7 |
| D | 1 | 20 | 536275 | 3929.19 | 552 | 537 | 136.3 |
| D | 2 | 152 | 263427 | 1928.08 | 552 | 537 | 136.3 |
| D | 12 | 233 | 180850 | 1322.45 | 552 | 537 | 136.3 |
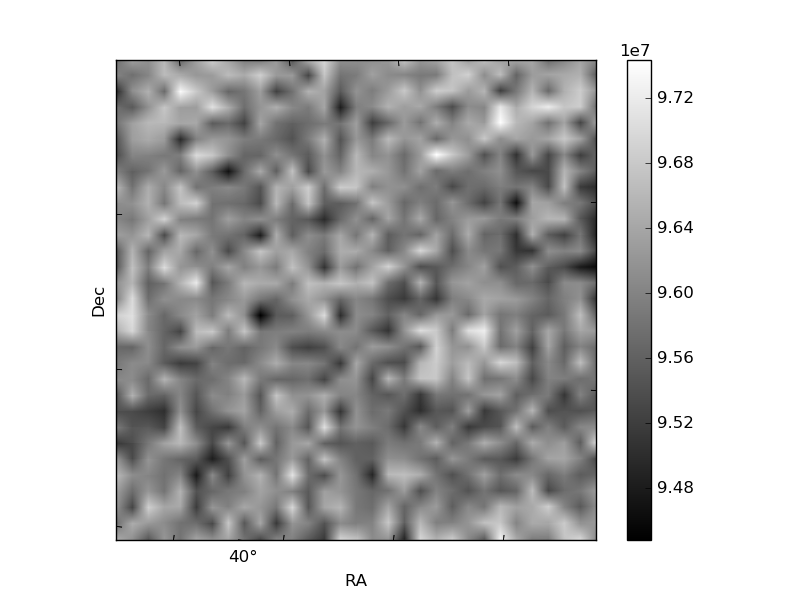
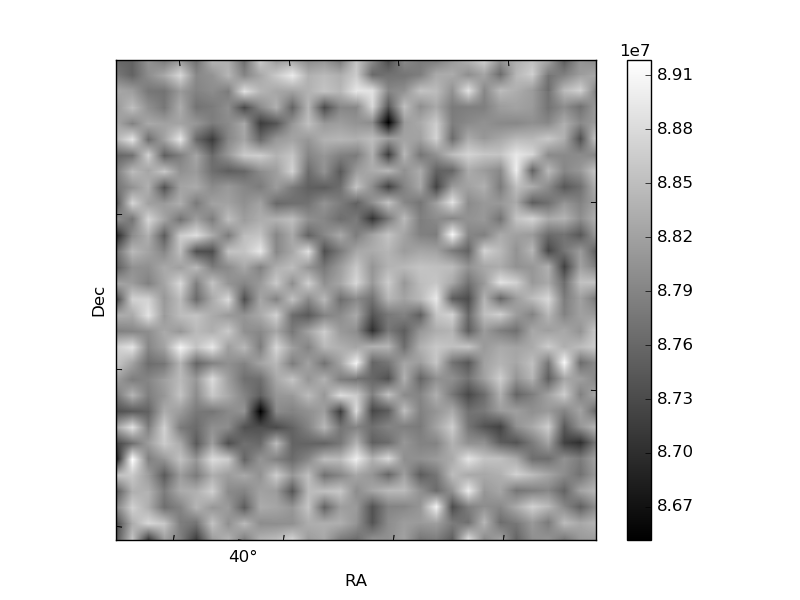
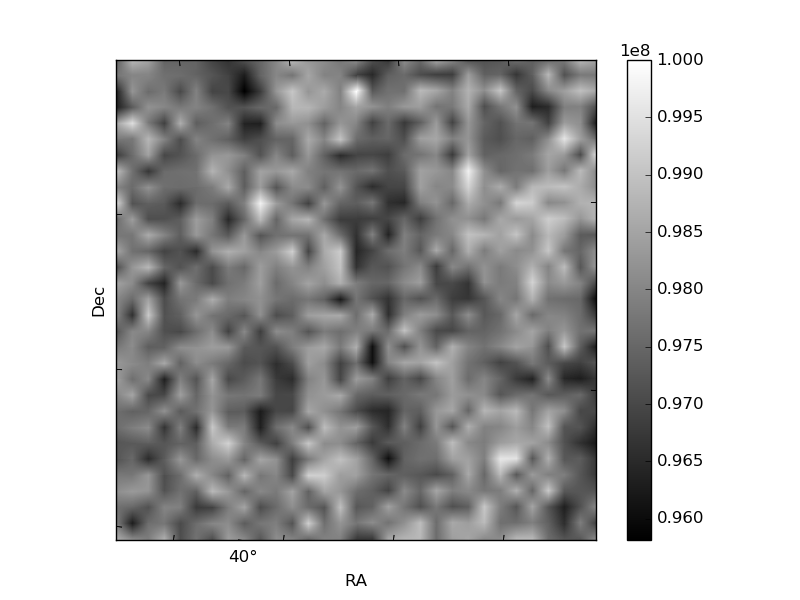
Histogram calculated using DETX and DETY for each event in the final _common_clean file
| Quadrant A | 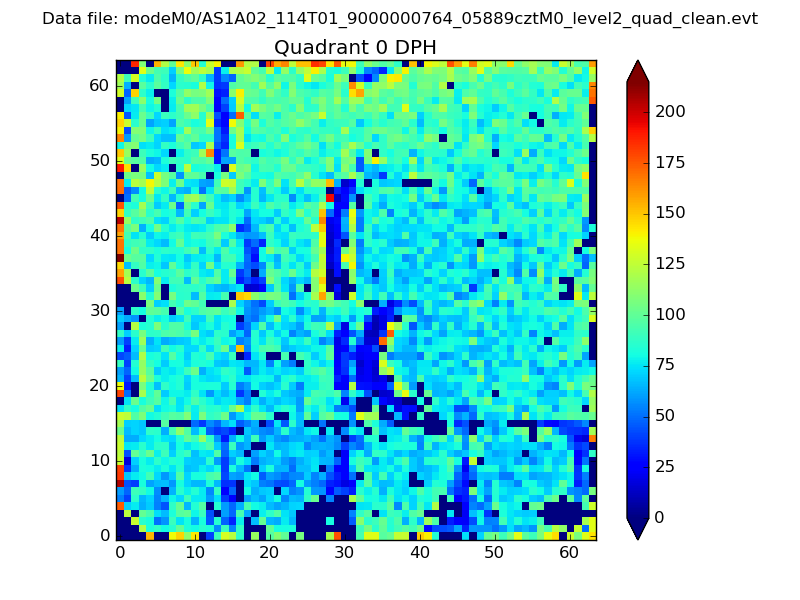 |
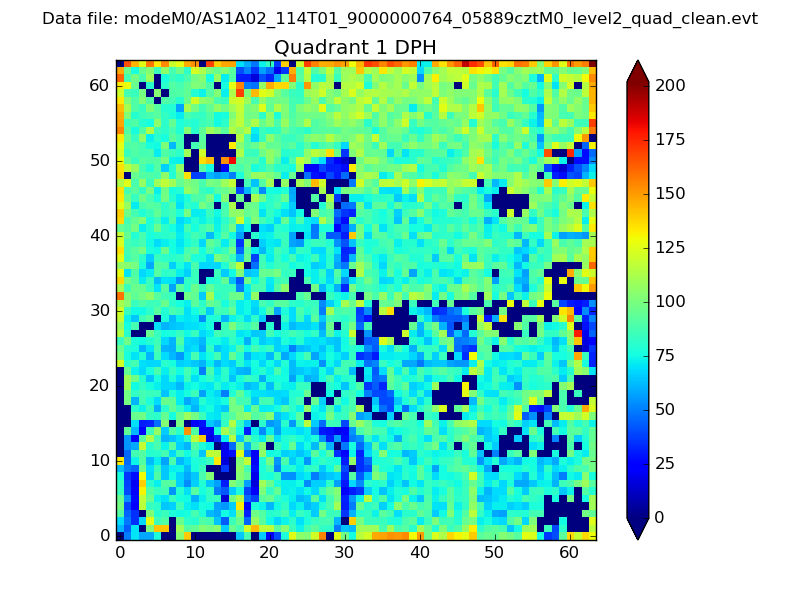 |
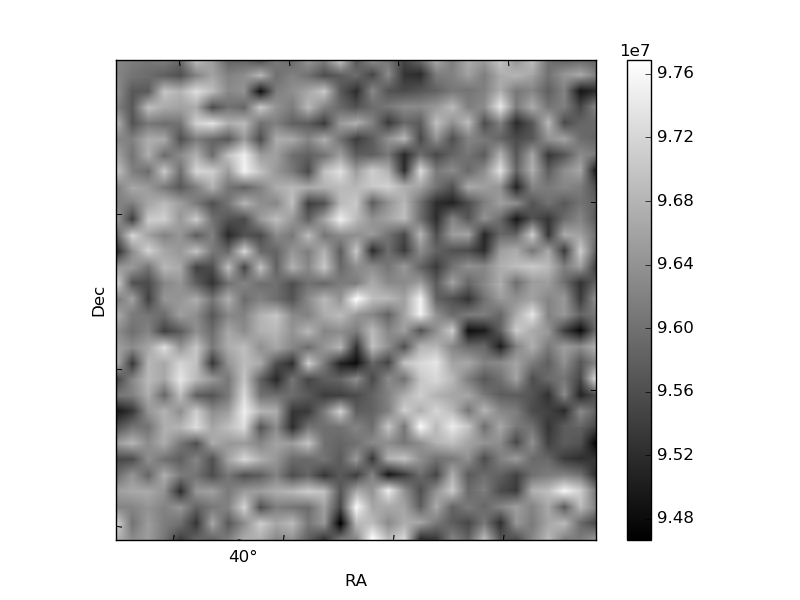
Quadrant B |
|---|---|---|---|
| Quadrant D |  |
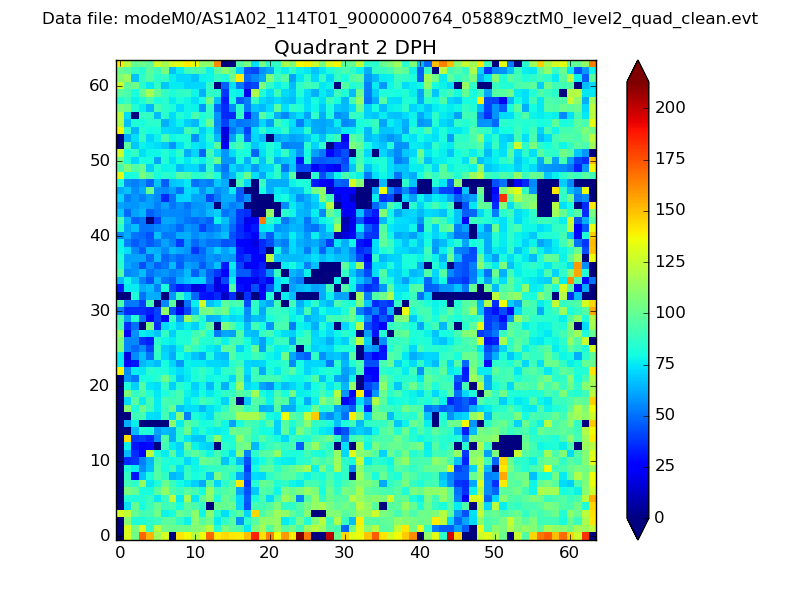 |
Quadrant C |
| Plot type | Count rate plots | Images |
|---|---|---|
| Comparison with Poisson distribution Blue bars denote a histogram of data divided into 1 sec bins. Red curve is a Poisson curve with rate = median count rate of data. |
 |
 |
| Quadrant-wise count rates Data is divided into 100 sec bins |
 |
|
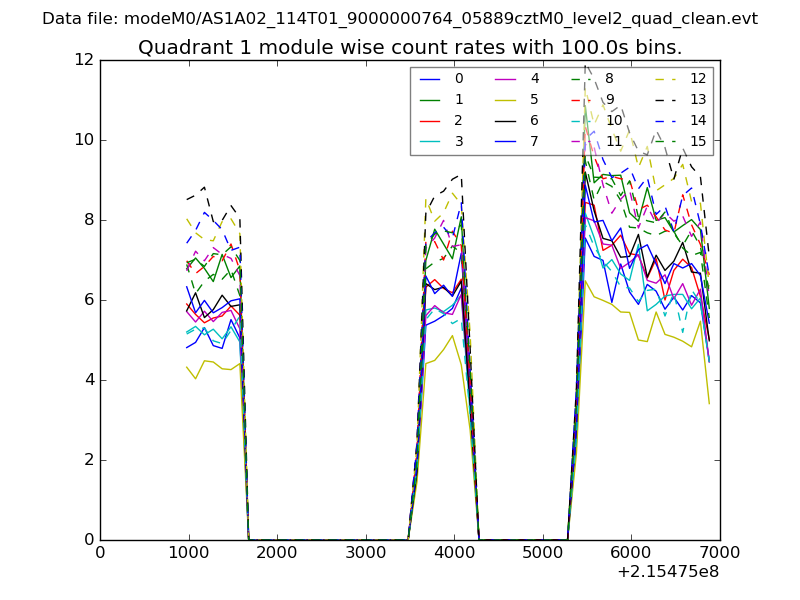
| Module-wise count rates for Quadrant A Data is divided into 100 sec bins |
 |
 |
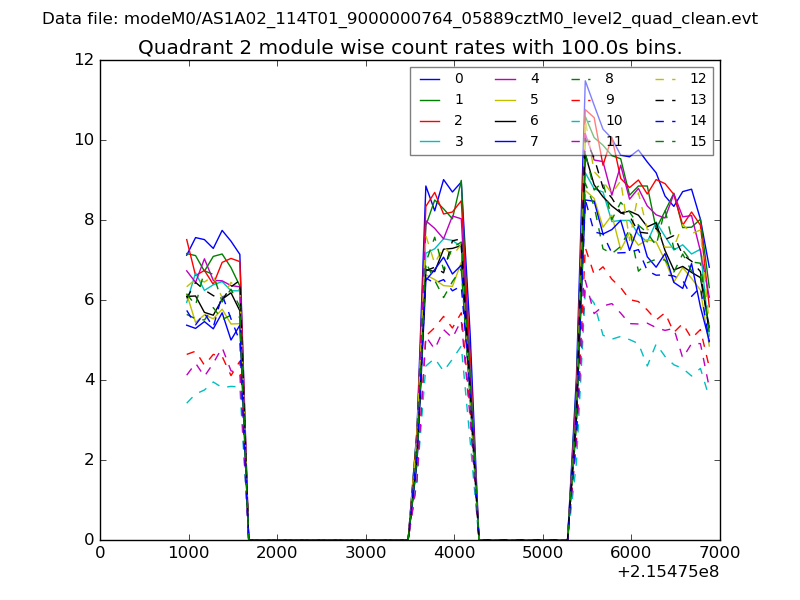
| Module-wise count rates for Quadrant B Data is divided into 100 sec bins |
 |
 |
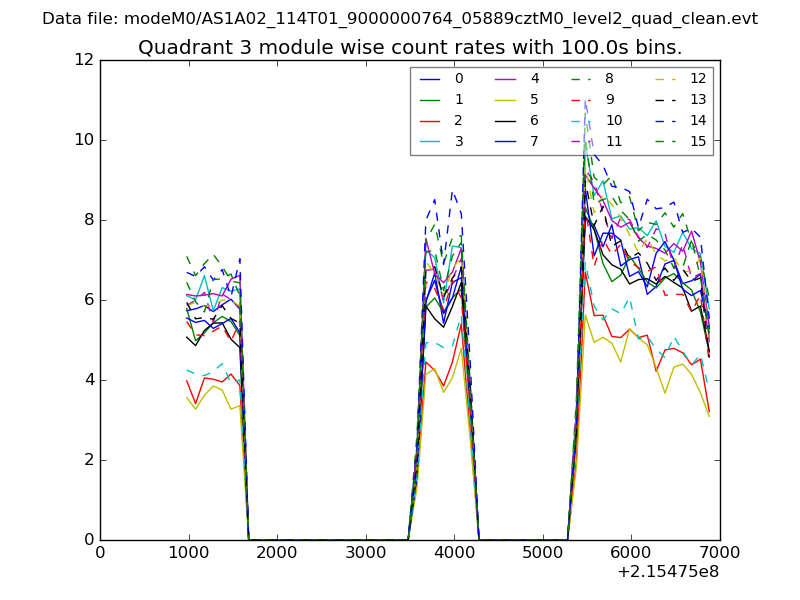
| Module-wise count rates for Quadrant C Data is divided into 100 sec bins |
 |
 |
| Module-wise count rates for Quadrant D Data is divided into 100 sec bins |
 |
 |
| Parameter | Plot |
|---|---|
| CZT HV Monitor | 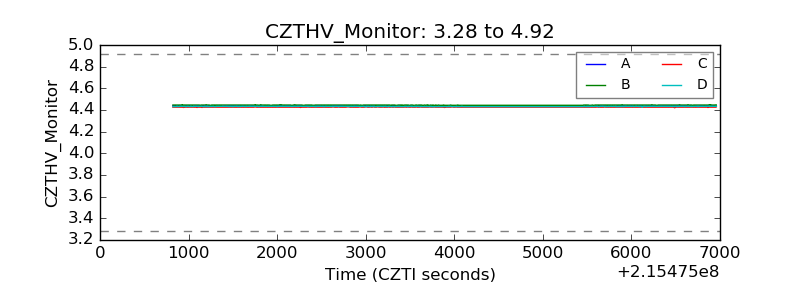 |
| D_VDD | 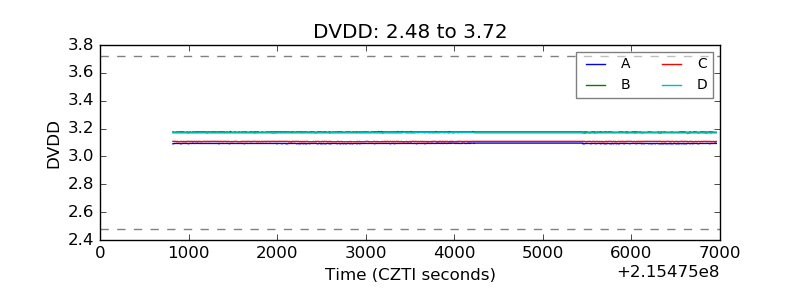 |
| Temperature 1 |  |
| Veto HV Monitor | 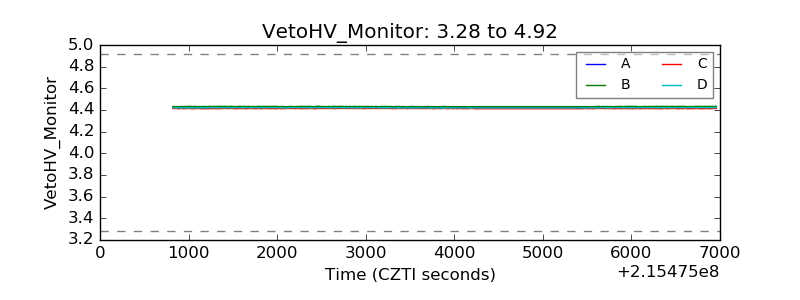 |
| Veto LLD | 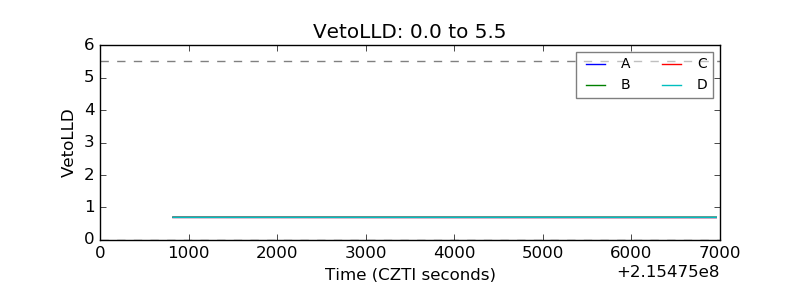 |
| Alpha Counter | 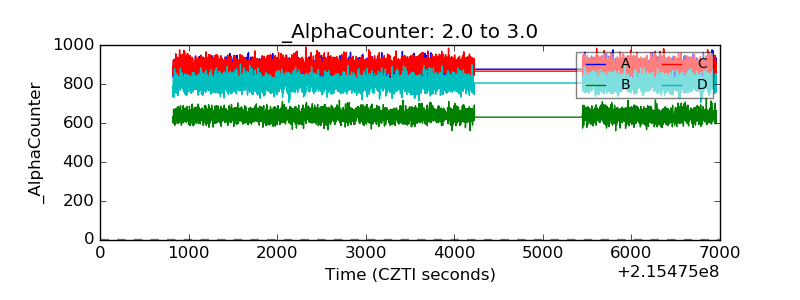 |
| _CPM_Rate | 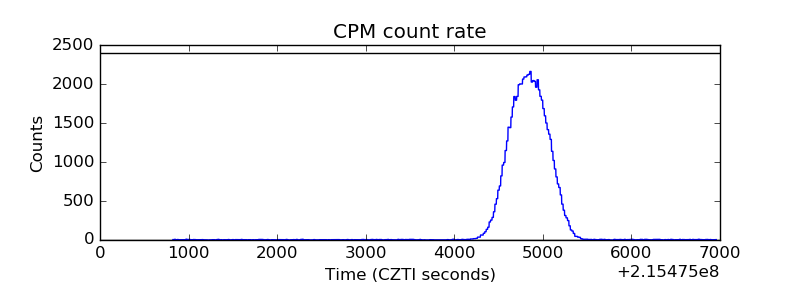 |
| CZT Counter | 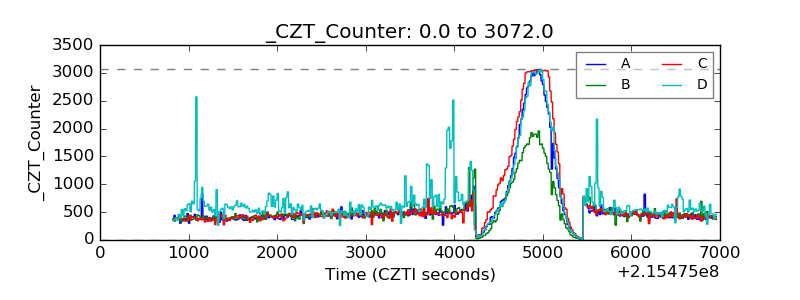 |
| +2.5 Volts monitor |  |
| +5 Volts monitor |  |
| _ROLL_ROT | 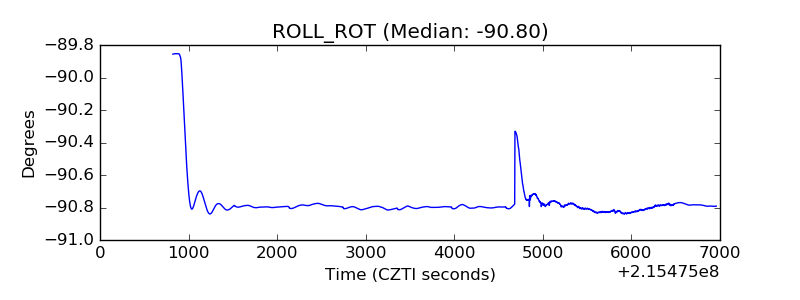 |
| _Roll_DEC | 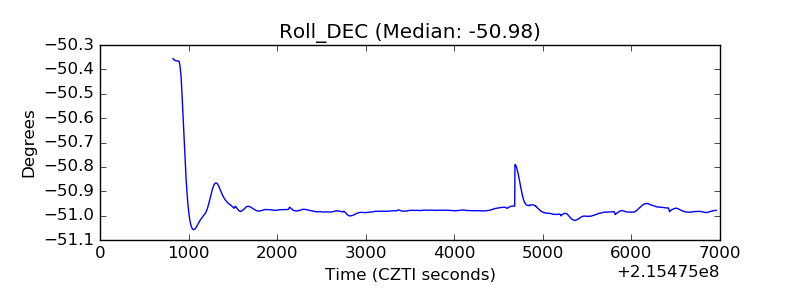 |
| _Roll_RA | 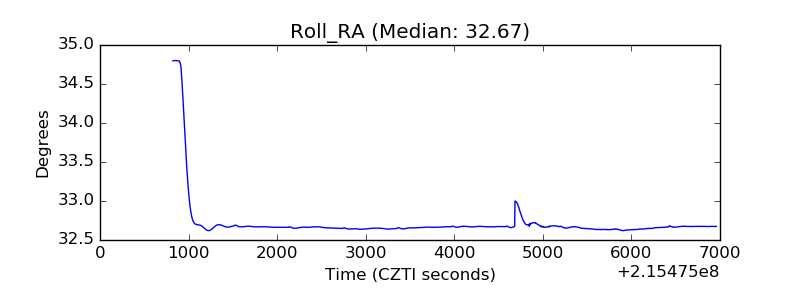 |
| Veto Counter | 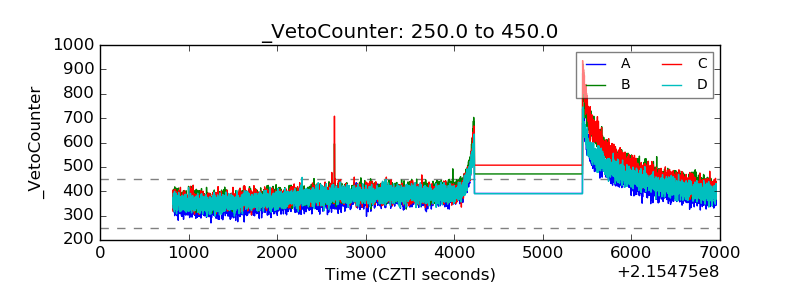 |