| Param | Original file | Final file |
|---|---|---|
| Filename | modeM0/AS1A02_114T01_9000000764_05892cztM0_level2.evt | modeM0/AS1A02_114T01_9000000764_05892cztM0_level2_quad_clean.evt |
| Size (bytes) | 452,960,640 | 73,500,480 |
| Size | 432.0 MB | 70.1 MB |
| Events in quadrant A | 2,901,770 | 449,983 |
| Events in quadrant B | 3,025,231 | 459,145 |
| Events in quadrant C | 2,889,504 | 451,292 |
| Events in quadrant D | 4,472,737 | 424,615 |
| Mode M9 | |||
|---|---|---|---|
| Quadrant | BADHDUFLAG | Total packets | Discarded packets |
| A | 0 | 16 | 0 |
| B | 0 | 16 | 0 |
| C | 0 | 16 | 0 |
| D | 0 | 17 | 0 |
| Mode SS | |||
|---|---|---|---|
| Quadrant | BADHDUFLAG | Total packets | Discarded packets |
| A | 0 | 128 | 0 |
| B | 0 | 128 | 0 |
| C | 0 | 128 | 0 |
| D | 0 | 128 | 0 |
| Mode M0 | |||
|---|---|---|---|
| Quadrant | BADHDUFLAG | Total packets | Discarded packets |
| A | 0 | 13011 | 42 |
| B | 0 | 13047 | 31 |
| C | 0 | 12945 | 31 |
| D | 0 | 17802 | 57 |
| Quadrant | Total seconds | Saturated seconds | Saturation percentage |
|---|---|---|---|
| A | 6309 | 45 | 0.713267% |
| B | 6311 | 82 | 1.299319% |
| C | 6313 | 68 | 1.077142% |
| D | 6309 | 88 | 1.394833% |
Noise dominated data is calculated using 1-second bins in cleaned event files. If a bin has >2000 counts, and if more than 50% of those come from <1% of pixels, then it is considered to be noise-dominated and hence unusable.
| Quadrant | # 1 sec bins | Bins with >0 counts | Bins with >2000 counts | High rate bins dominated by noise | Noise dominated (total time) | Noise dominated (detector-on time) | Marked lightcurve |
|---|---|---|---|---|---|---|---|
| A | 7459 | 6322 | 0 | 0 | 0.00% | 0.00% | 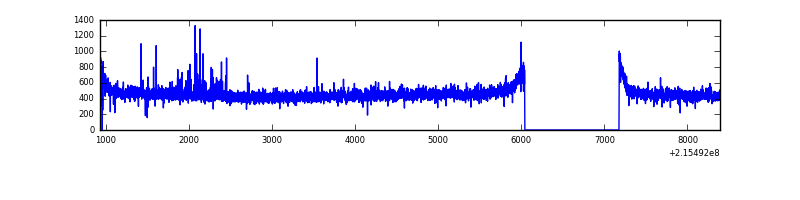 |
| B | 7459 | 6325 | 0 | 0 | 0.00% | 0.00% | 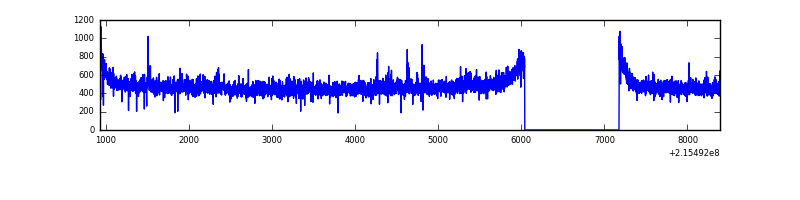 |
| C | 7459 | 6322 | 0 | 0 | 0.00% | 0.00% |  |
| D | 7459 | 6322 | 13 | 13 | 0.17% | 0.21% | 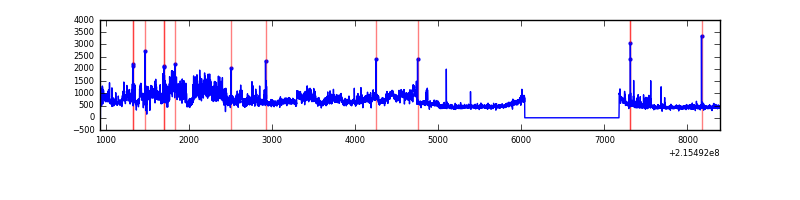 |
Top three noisy pixels from each quadrant. If the there are fewer than three noisy pixels in the level2.evt file, extra rows are filled as -1
| Pixel properties | Quadrant properties | ||||||
|---|---|---|---|---|---|---|---|
| Quadrant | DetID | PixID | Counts | Sigma | Mean | Median | Sigma |
| A | 15 | 234 | 30308 | 195.95 | 743 | 726 | 151.0 |
| A | 10 | 1 | 8697 | 52.8 | 743 | 726 | 151.0 |
| A | 12 | 194 | 6982 | 41.44 | 743 | 726 | 151.0 |
| B | 15 | 204 | 56170 | 384.56 | 756 | 737 | 144.1 |
| B | 0 | 219 | 20125 | 134.5 | 756 | 737 | 144.1 |
| B | 15 | 255 | 14618 | 96.3 | 756 | 737 | 144.1 |
| C | 13 | 61 | 5782 | 29.4 | 740 | 743 | 171.4 |
| C | 12 | 4 | 2035 | 7.54 | 740 | 743 | 171.4 |
| C | 3 | 202 | 1895 | 6.72 | 740 | 743 | 171.4 |
| D | 1 | 20 | 1503711 | 8491.96 | 730 | 709 | 177.0 |
| D | 2 | 152 | 145387 | 817.43 | 730 | 709 | 177.0 |
| D | 2 | 136 | 25385 | 139.42 | 730 | 709 | 177.0 |
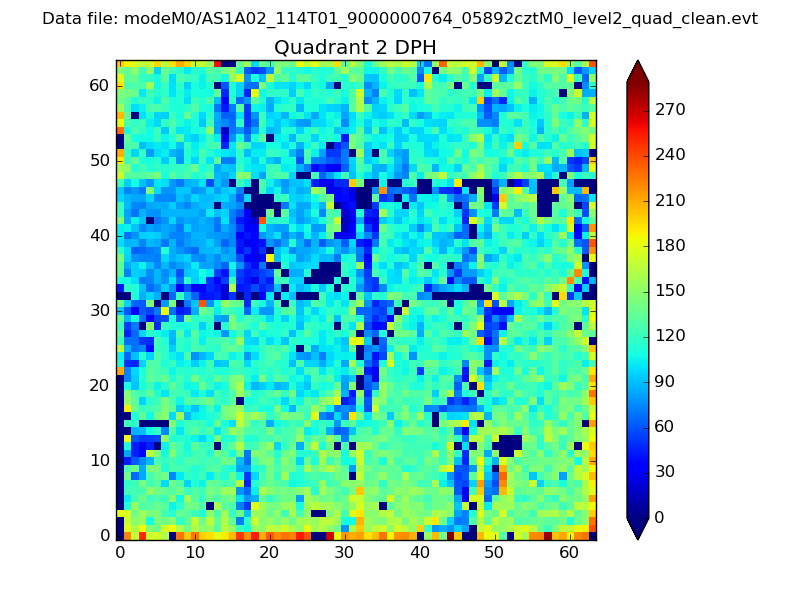
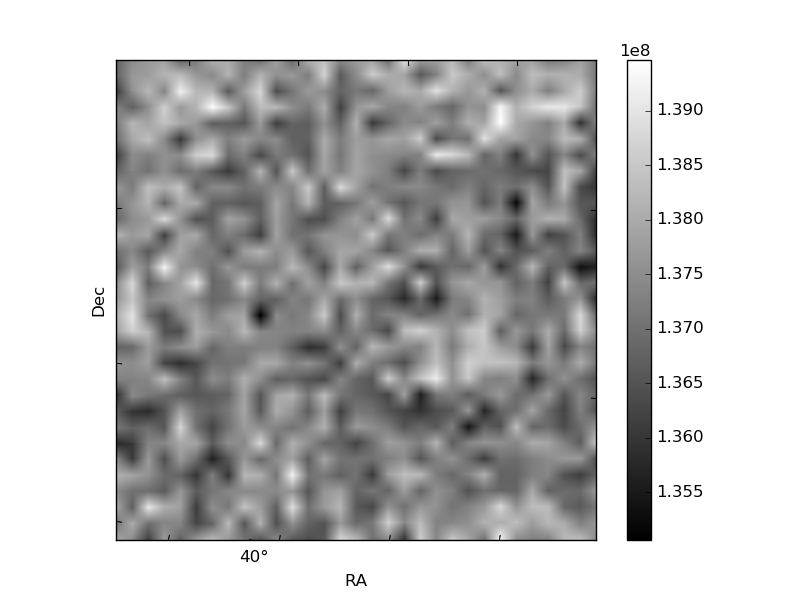
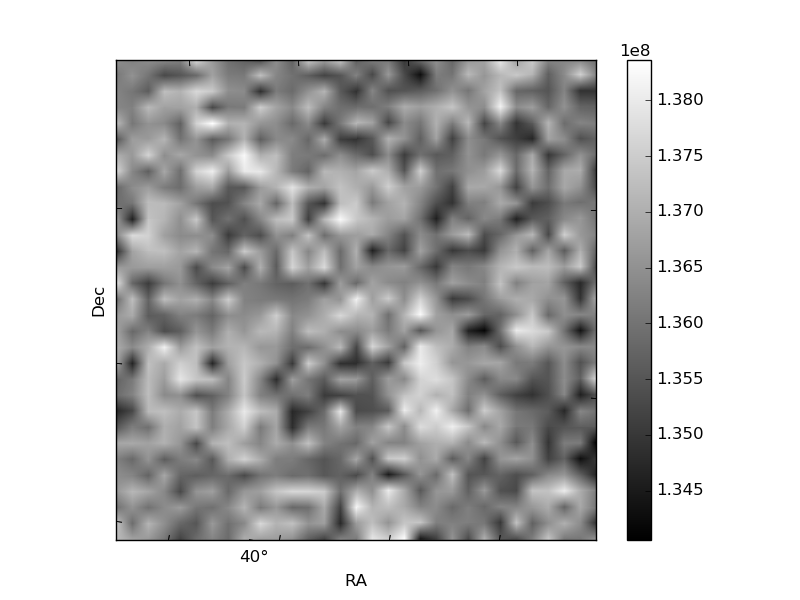
Histogram calculated using DETX and DETY for each event in the final _common_clean file
| Quadrant A | 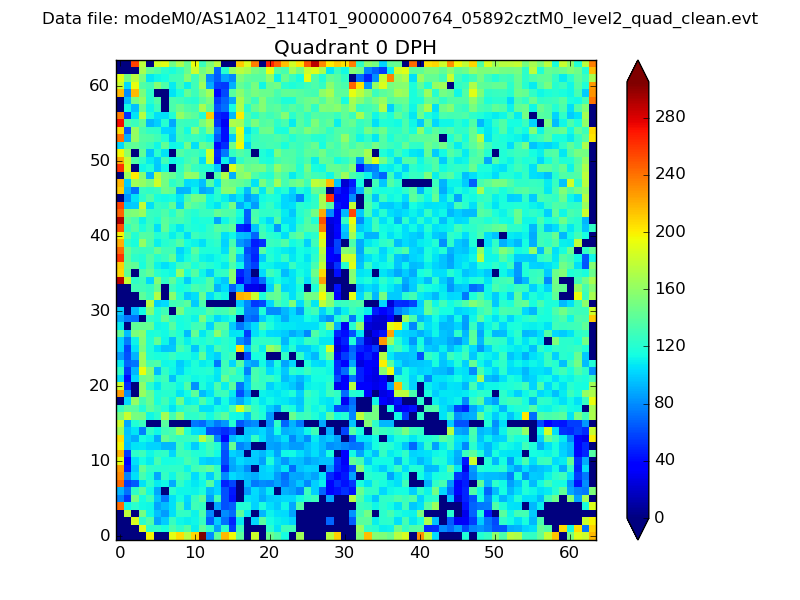 |
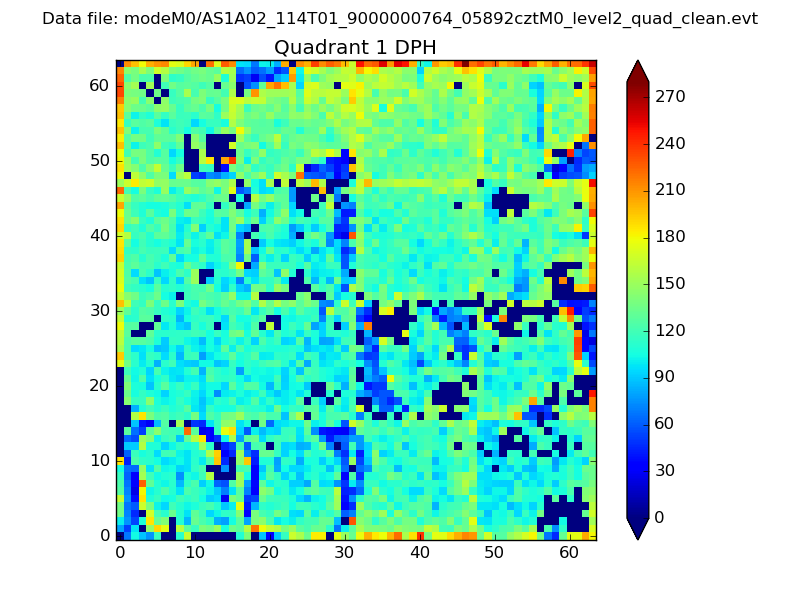 |
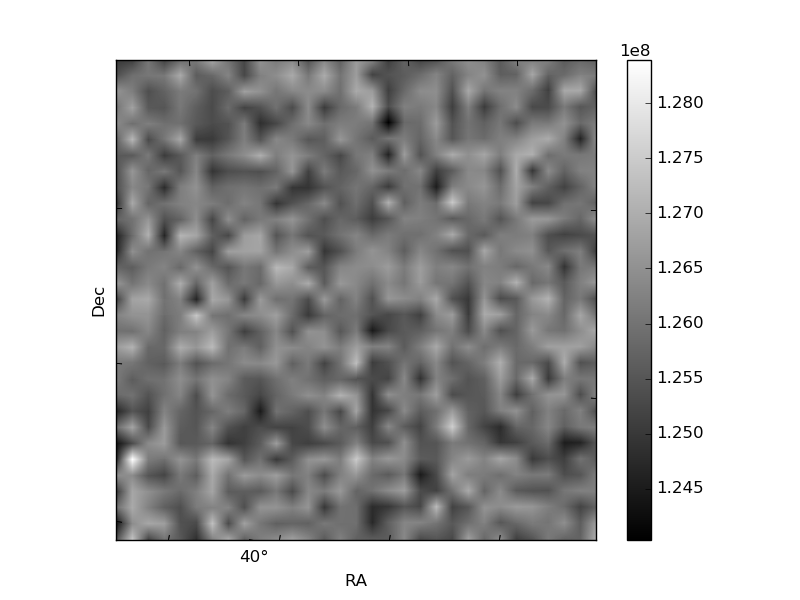
Quadrant B |
|---|---|---|---|
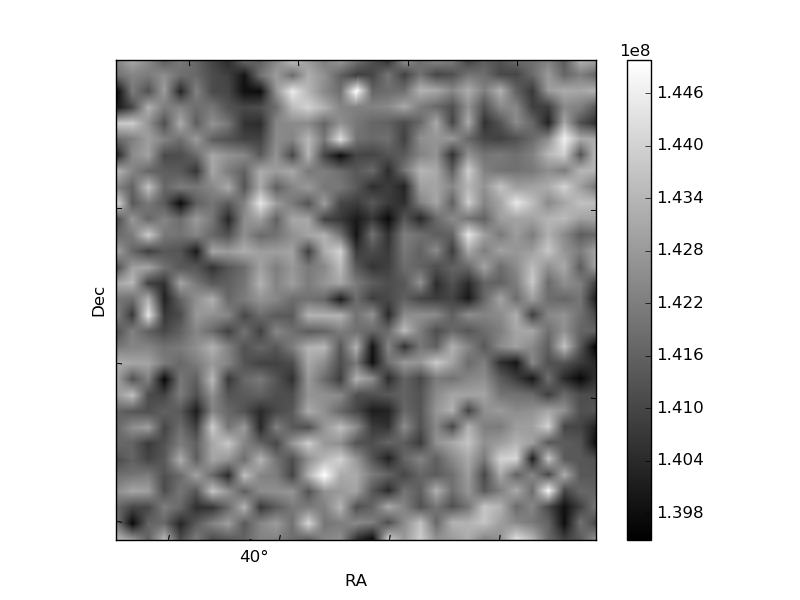
| Quadrant D |  |
 |
Quadrant C |
| Plot type | Count rate plots | Images |
|---|---|---|
| Comparison with Poisson distribution Blue bars denote a histogram of data divided into 1 sec bins. Red curve is a Poisson curve with rate = median count rate of data. |
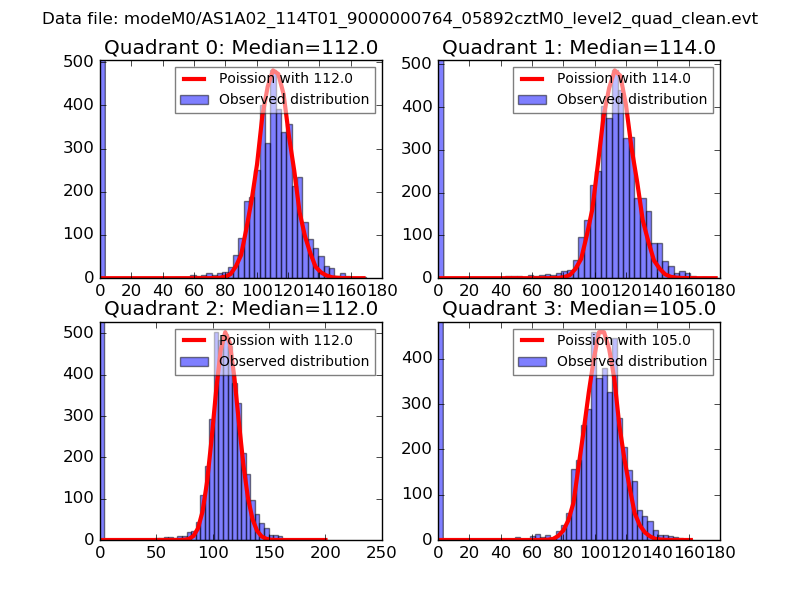 |
 |
| Quadrant-wise count rates Data is divided into 100 sec bins |
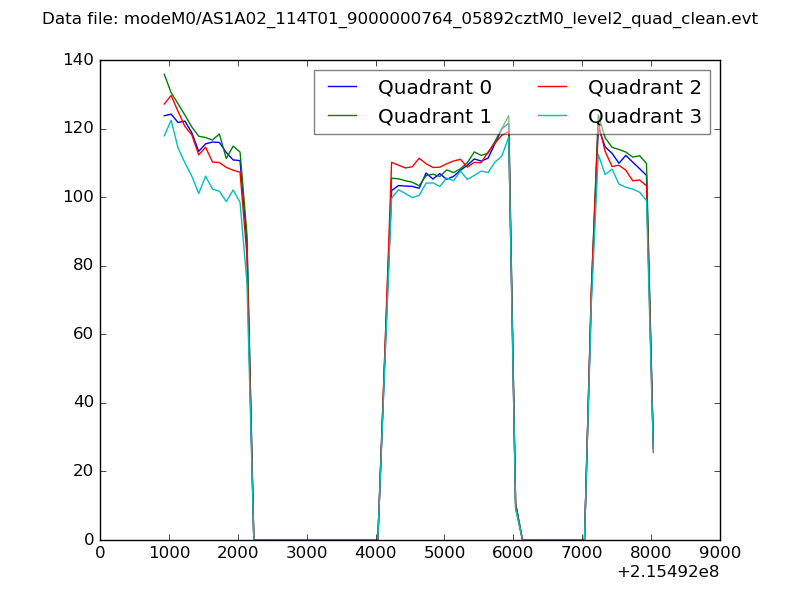 |
|
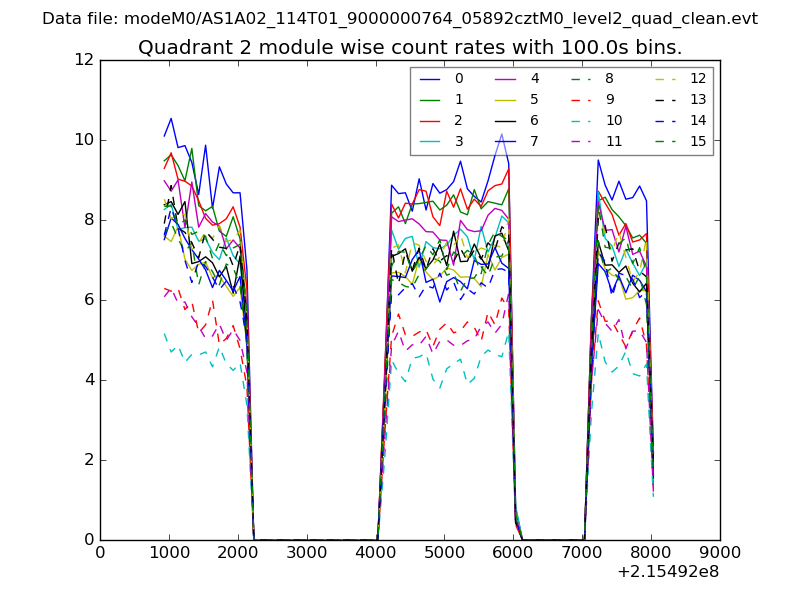
| Module-wise count rates for Quadrant A Data is divided into 100 sec bins |
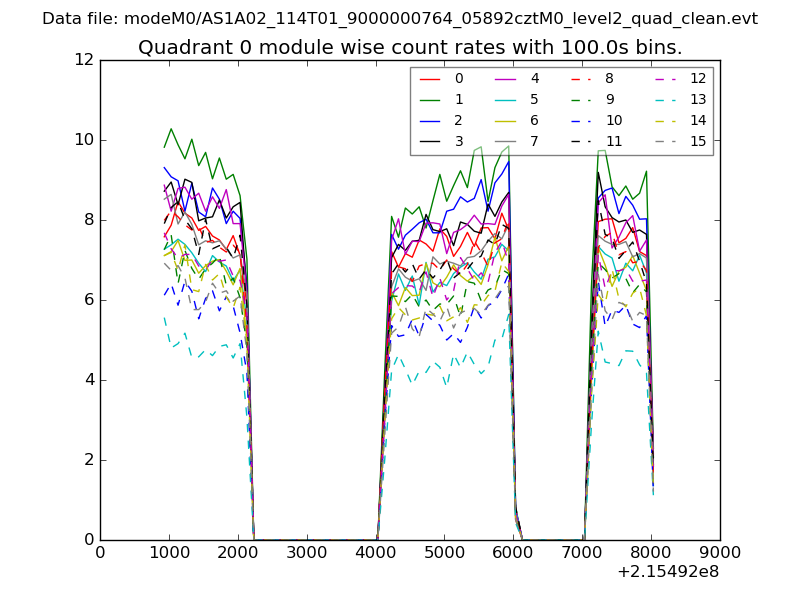 |
 |
| Module-wise count rates for Quadrant B Data is divided into 100 sec bins |
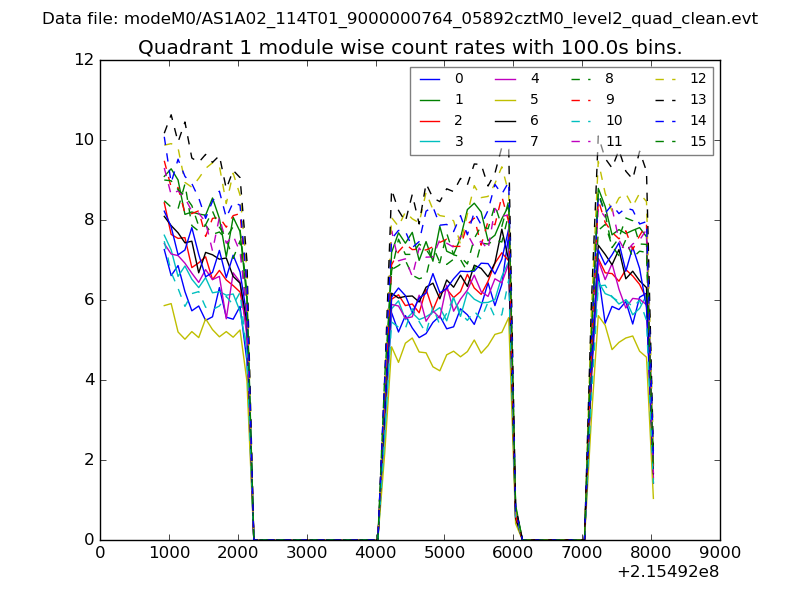 |
 |
| Module-wise count rates for Quadrant C Data is divided into 100 sec bins |
 |
 |
| Module-wise count rates for Quadrant D Data is divided into 100 sec bins |
 |
 |
| Parameter | Plot |
|---|---|
| CZT HV Monitor | 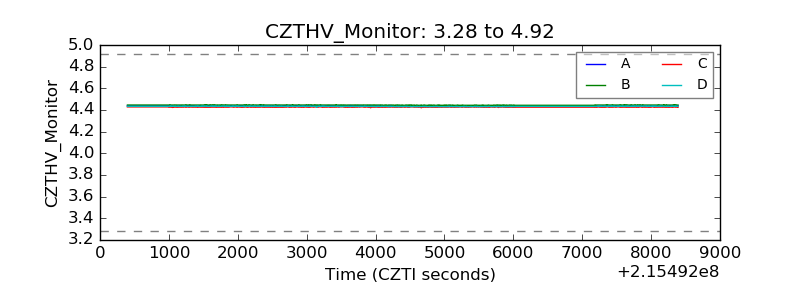 |
| D_VDD | 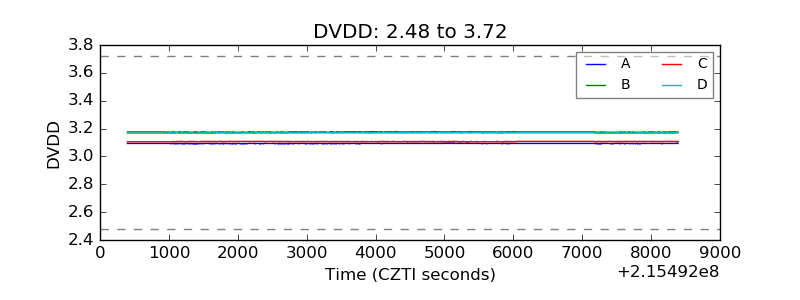 |
| Temperature 1 | 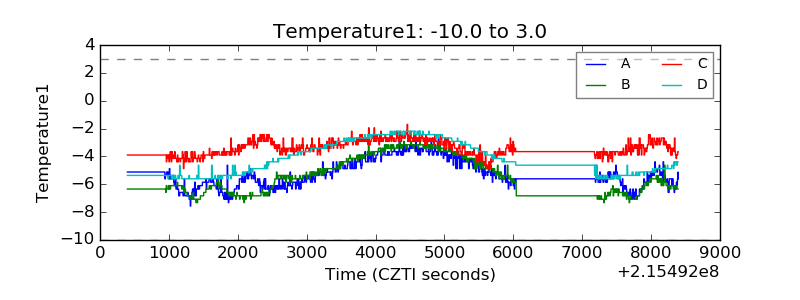 |
| Veto HV Monitor | 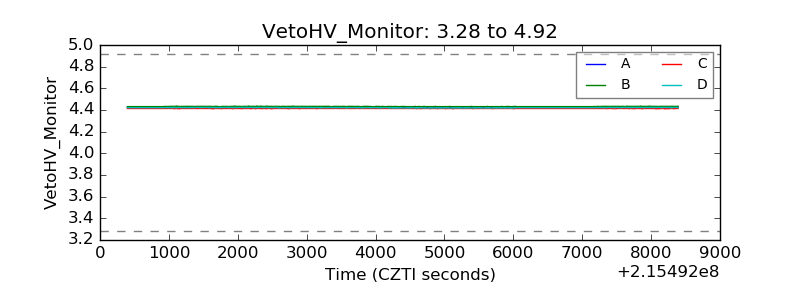 |
| Veto LLD | 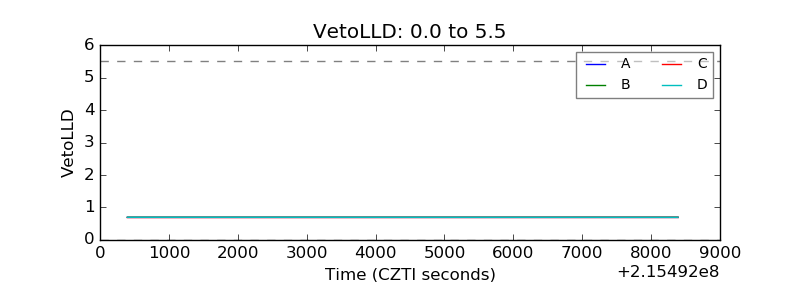 |
| Alpha Counter | 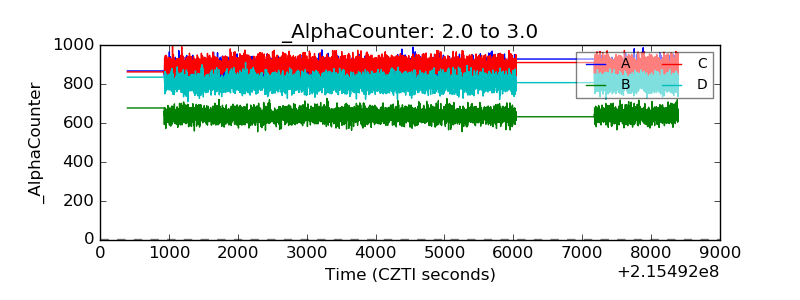 |
| _CPM_Rate | 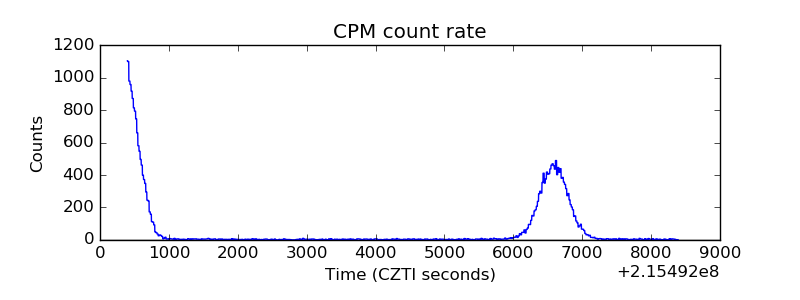 |
| CZT Counter | 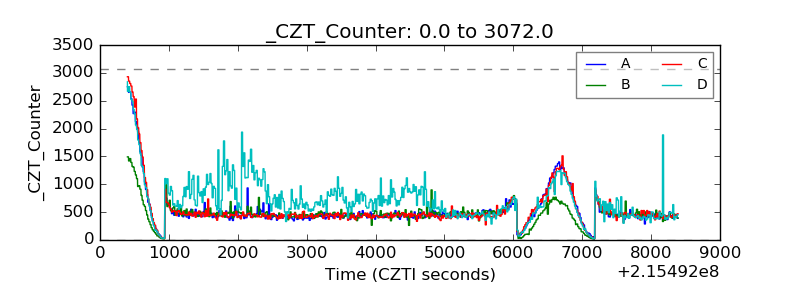 |
| +2.5 Volts monitor |  |
| +5 Volts monitor | 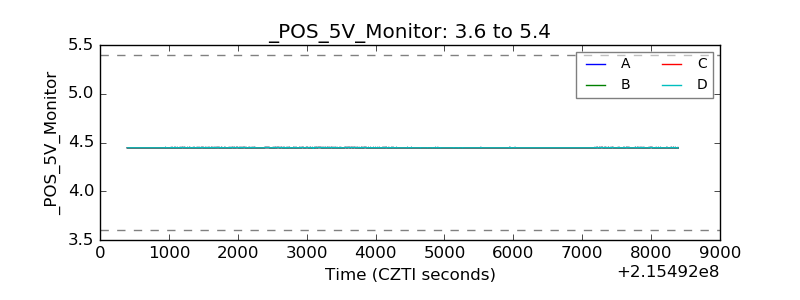 |
| _ROLL_ROT | 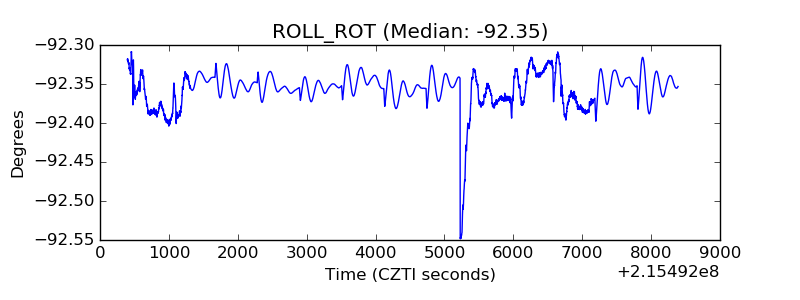 |
| _Roll_DEC | 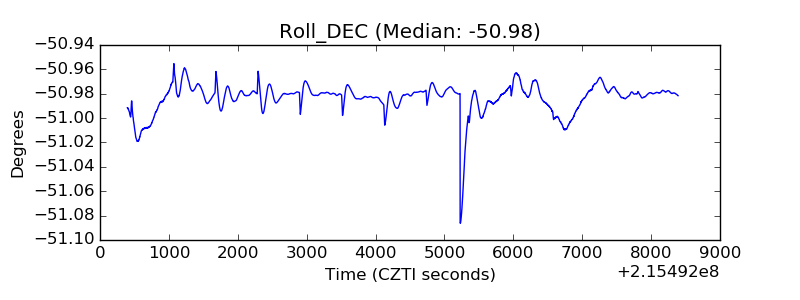 |
| _Roll_RA | 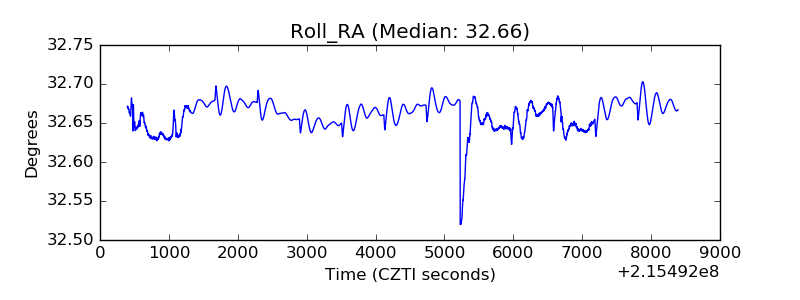 |
| Veto Counter | 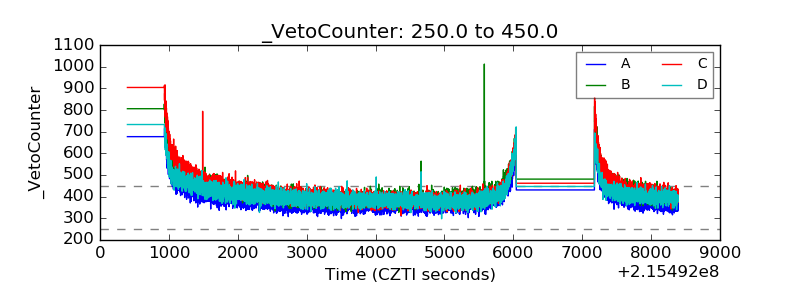 |