| Param | Original file | Final file |
|---|---|---|
| Filename | modeM0/AS1A02_114T01_9000000764_05893cztM0_level2.evt | modeM0/AS1A02_114T01_9000000764_05893cztM0_level2_quad_clean.evt |
| Size (bytes) | 474,240,960 | 82,382,400 |
| Size | 452.3 MB | 78.6 MB |
| Events in quadrant A | 3,422,043 | 499,315 |
| Events in quadrant B | 3,507,622 | 502,964 |
| Events in quadrant C | 3,366,747 | 498,945 |
| Events in quadrant D | 3,567,634 | 482,901 |
| Mode M9 | |||
|---|---|---|---|
| Quadrant | BADHDUFLAG | Total packets | Discarded packets |
| A | 0 | 19 | 0 |
| B | 0 | 19 | 0 |
| C | 0 | 19 | 0 |
| D | 0 | 19 | 0 |
| Mode SS | |||
|---|---|---|---|
| Quadrant | BADHDUFLAG | Total packets | Discarded packets |
| A | 0 | 152 | 0 |
| B | 0 | 152 | 0 |
| C | 0 | 152 | 0 |
| D | 0 | 152 | 0 |
| Mode M0 | |||
|---|---|---|---|
| Quadrant | BADHDUFLAG | Total packets | Discarded packets |
| A | 0 | 15191 | 3 |
| B | 0 | 15284 | 9 |
| C | 0 | 15194 | 4 |
| D | 0 | 15801 | 2 |
| Quadrant | Total seconds | Saturated seconds | Saturation percentage |
|---|---|---|---|
| A | 7323 | 152 | 2.075652% |
| B | 7319 | 188 | 2.568657% |
| C | 7322 | 162 | 2.212510% |
| D | 7323 | 161 | 2.198553% |
Noise dominated data is calculated using 1-second bins in cleaned event files. If a bin has >2000 counts, and if more than 50% of those come from <1% of pixels, then it is considered to be noise-dominated and hence unusable.
| Quadrant | # 1 sec bins | Bins with >0 counts | Bins with >2000 counts | High rate bins dominated by noise | Noise dominated (total time) | Noise dominated (detector-on time) | Marked lightcurve |
|---|---|---|---|---|---|---|---|
| A | 9323 | 7325 | 0 | 0 | 0.00% | 0.00% | 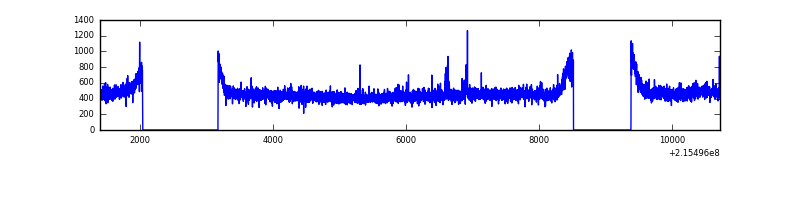 |
| B | 9323 | 7324 | 0 | 0 | 0.00% | 0.00% | 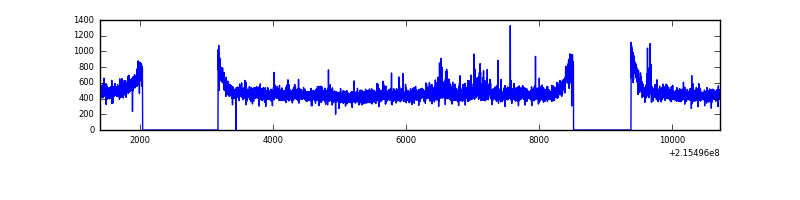 |
| C | 9323 | 7325 | 1 | 1 | 0.01% | 0.01% | 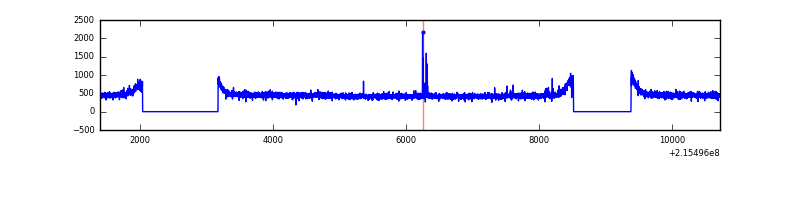 |
| D | 9323 | 7325 | 16 | 16 | 0.17% | 0.22% | 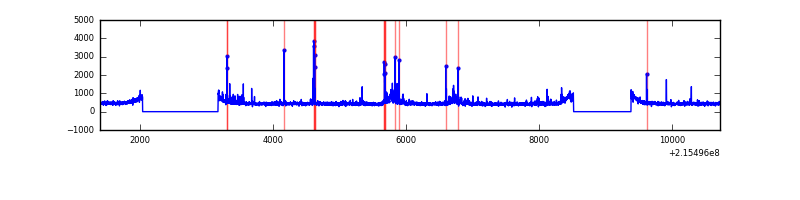 |
Top three noisy pixels from each quadrant. If the there are fewer than three noisy pixels in the level2.evt file, extra rows are filled as -1
| Pixel properties | Quadrant properties | ||||||
|---|---|---|---|---|---|---|---|
| Quadrant | DetID | PixID | Counts | Sigma | Mean | Median | Sigma |
| A | 15 | 236 | 70113 | 389.39 | 867 | 846 | 177.9 |
| A | 7 | 16 | 14188 | 75.0 | 867 | 846 | 177.9 |
| A | 0 | 226 | 8203 | 41.36 | 867 | 846 | 177.9 |
| B | 15 | 204 | 90765 | 533.4 | 878 | 855 | 168.6 |
| B | 12 | 111 | 16332 | 91.82 | 878 | 855 | 168.6 |
| B | 11 | 111 | 12855 | 71.19 | 878 | 855 | 168.6 |
| C | 9 | 247 | 17804 | 85.14 | 856 | 858 | 199.0 |
| C | 13 | 61 | 6777 | 29.74 | 856 | 858 | 199.0 |
| C | 9 | 16 | 5517 | 23.41 | 856 | 858 | 199.0 |
| D | 2 | 152 | 224409 | 1080.76 | 851 | 826 | 206.9 |
| D | 2 | 136 | 46826 | 222.36 | 851 | 826 | 206.9 |
| D | 1 | 239 | 39119 | 185.1 | 851 | 826 | 206.9 |
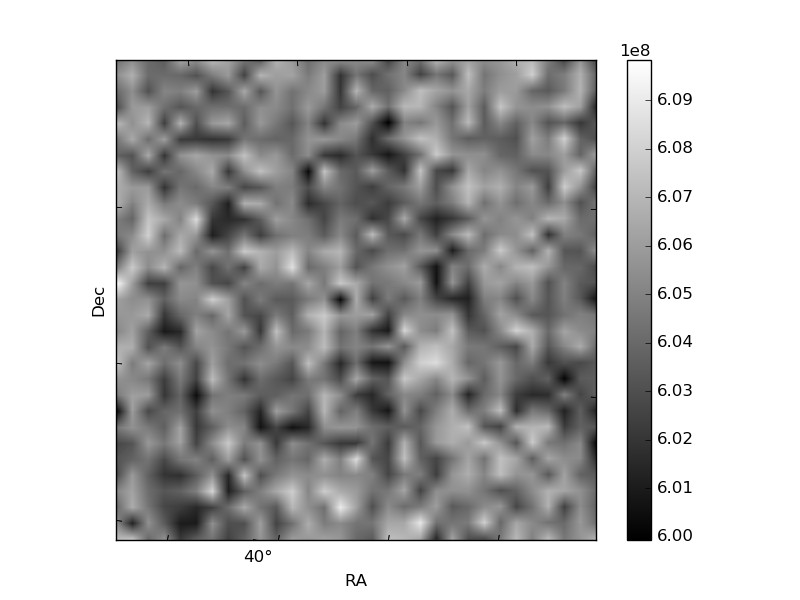
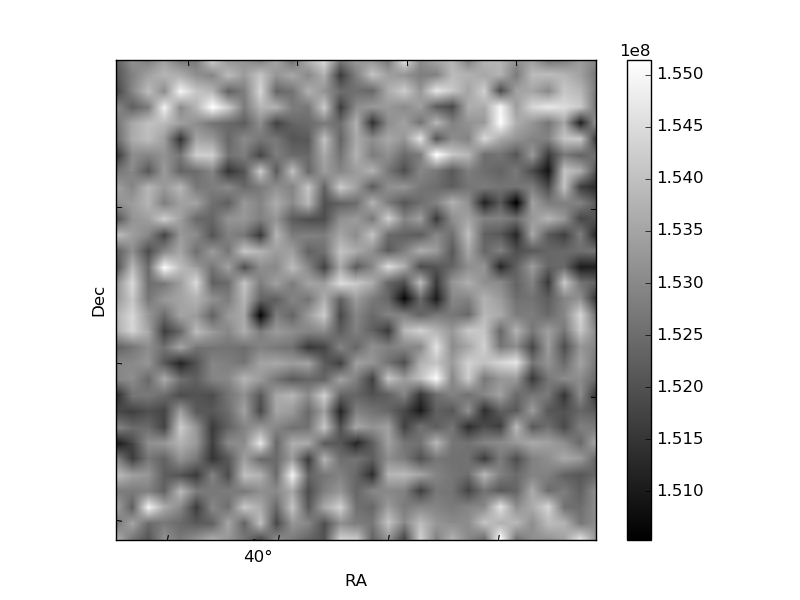
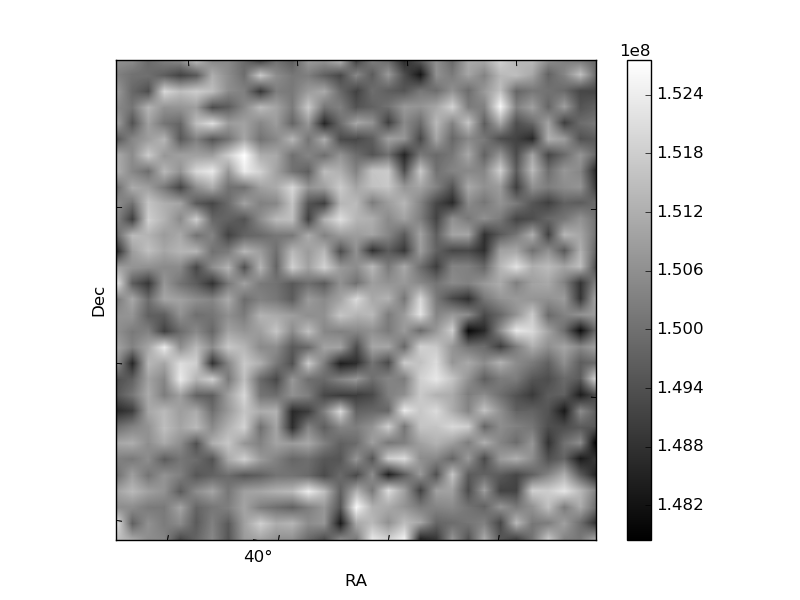
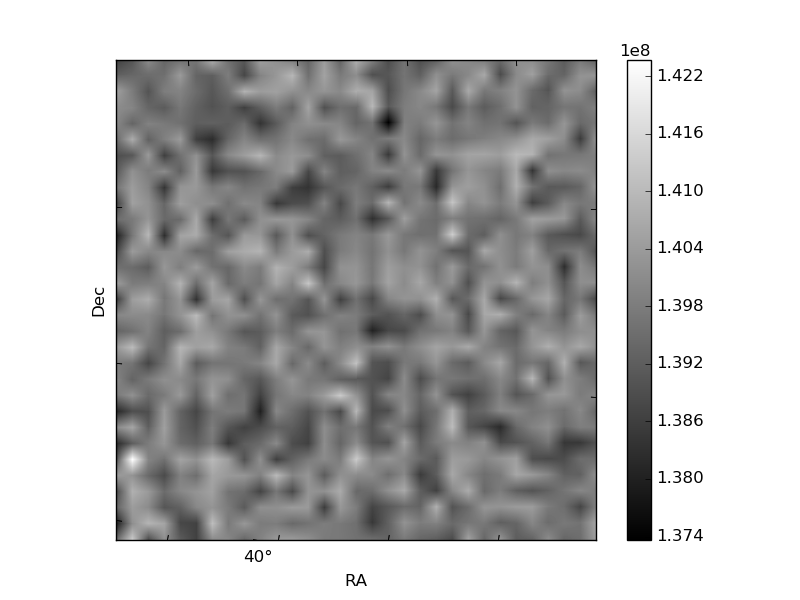
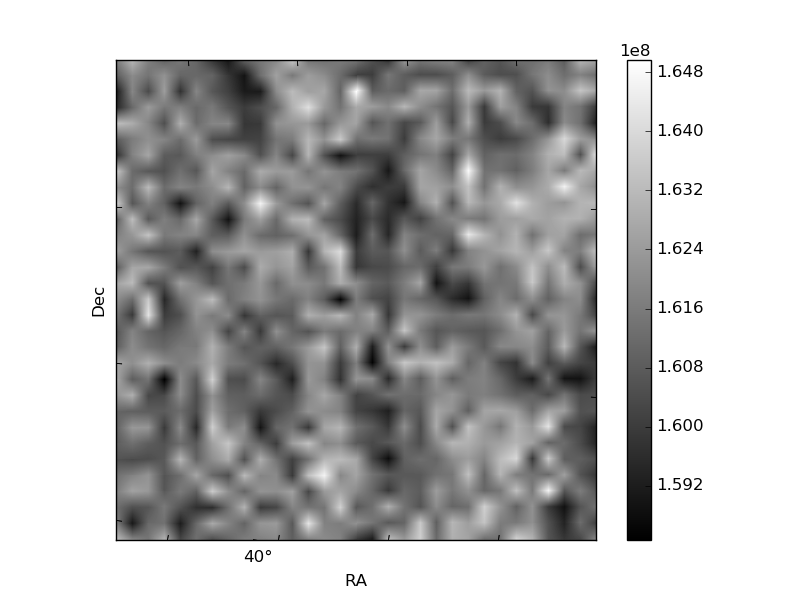
Histogram calculated using DETX and DETY for each event in the final _common_clean file
| Quadrant A | 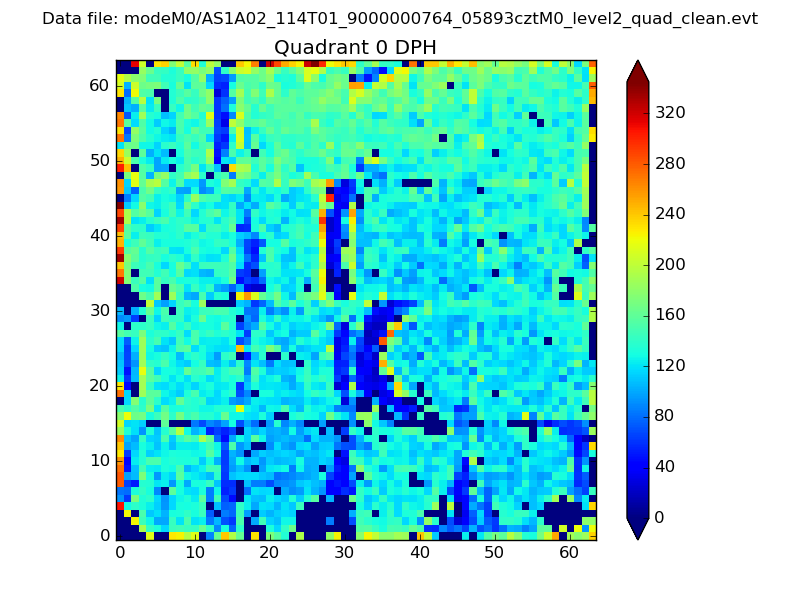 |
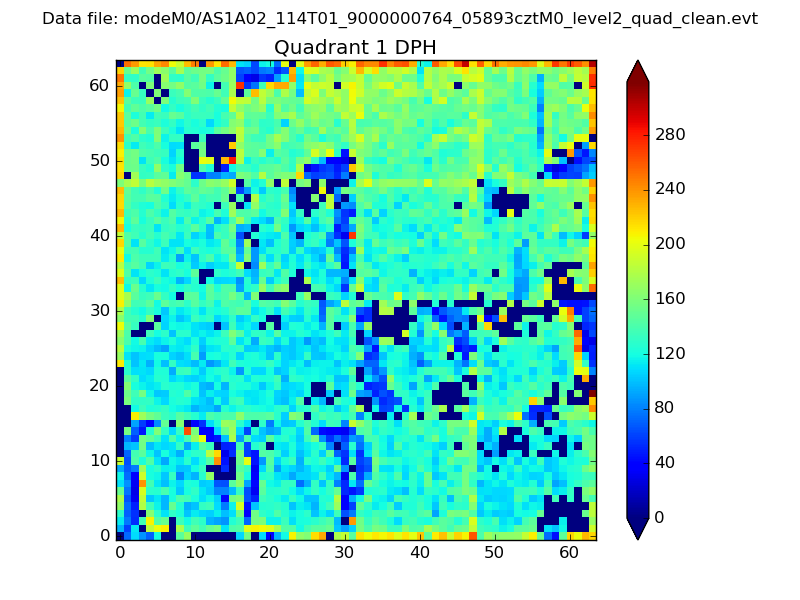 |
Quadrant B |
|---|---|---|---|
| Quadrant D | 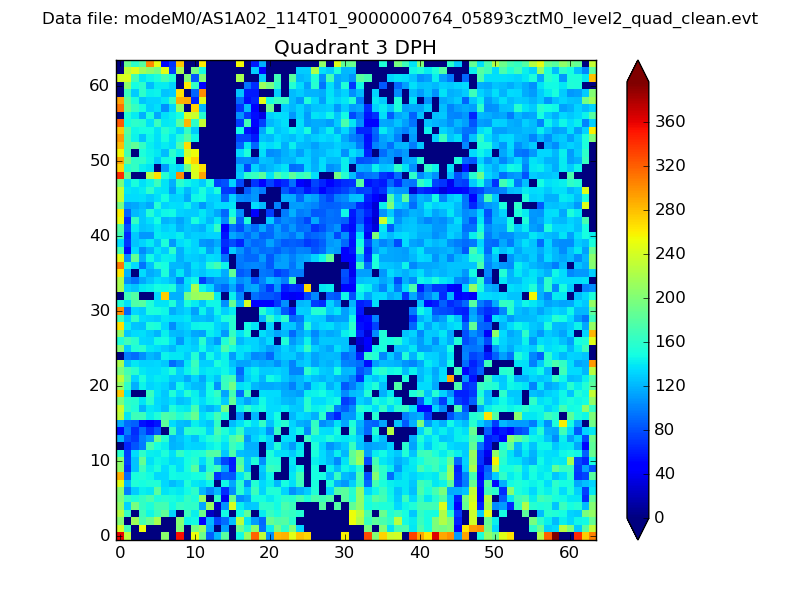 |
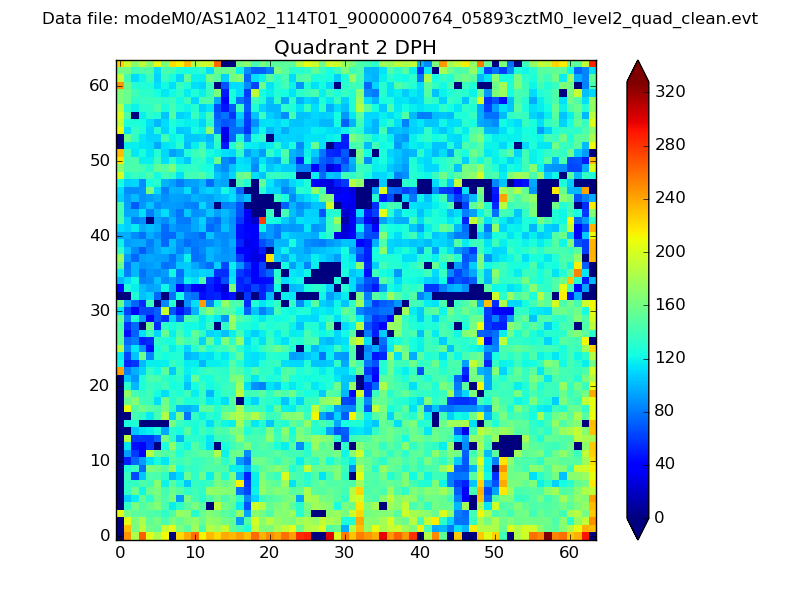 |
Quadrant C |
| Plot type | Count rate plots | Images |
|---|---|---|
| Comparison with Poisson distribution Blue bars denote a histogram of data divided into 1 sec bins. Red curve is a Poisson curve with rate = median count rate of data. |
 |
 |
| Quadrant-wise count rates Data is divided into 100 sec bins |
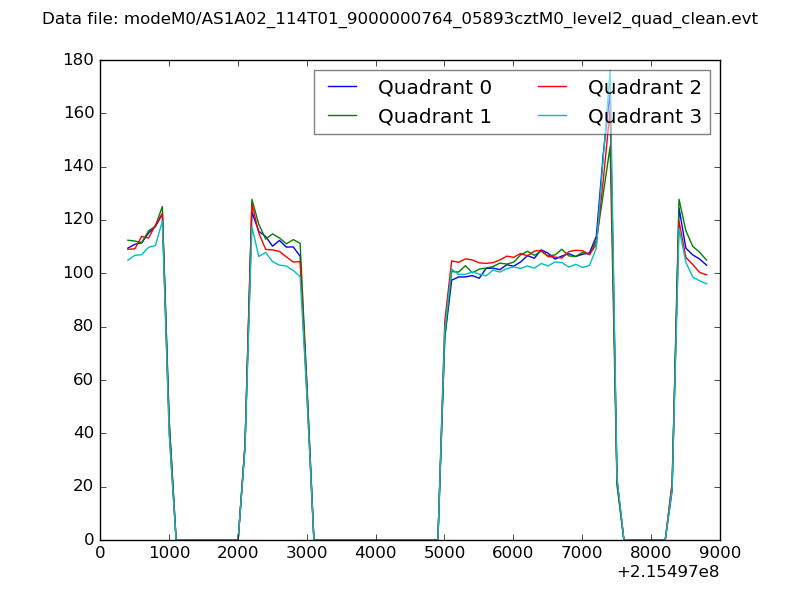 |
|
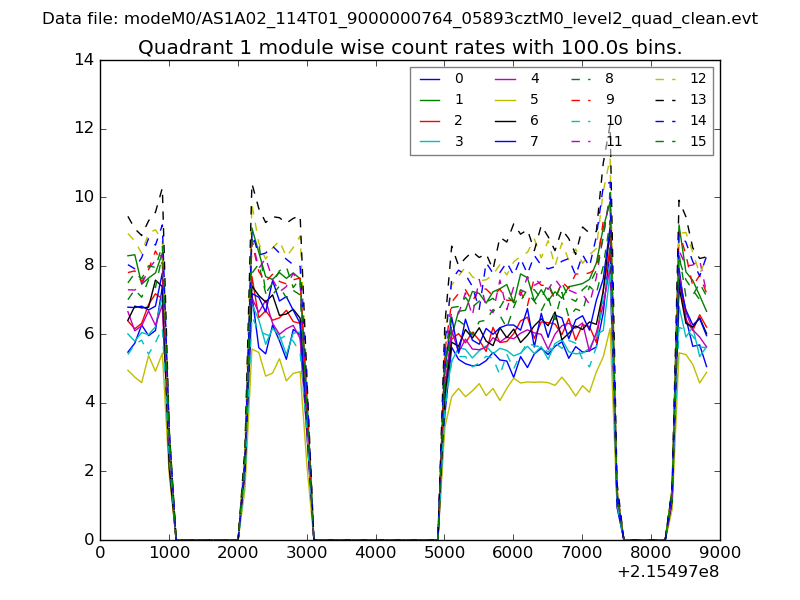
| Module-wise count rates for Quadrant A Data is divided into 100 sec bins |
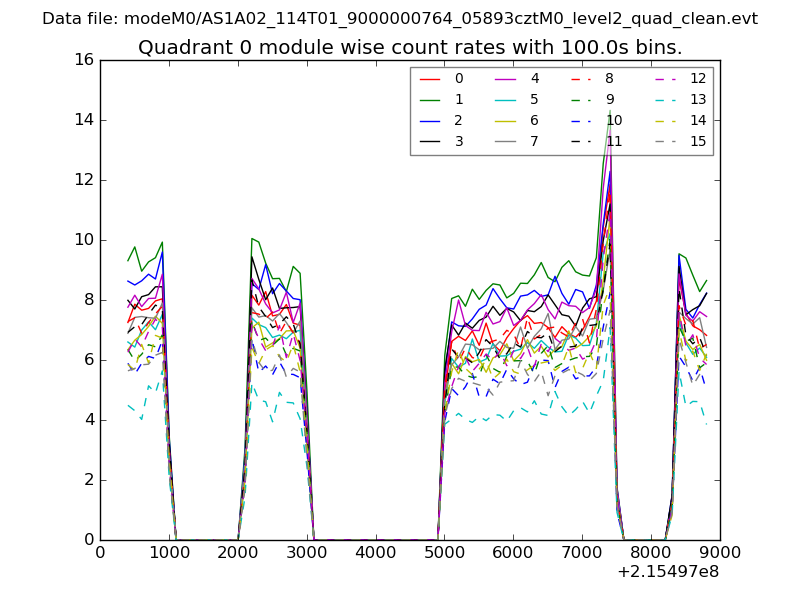 |
 |
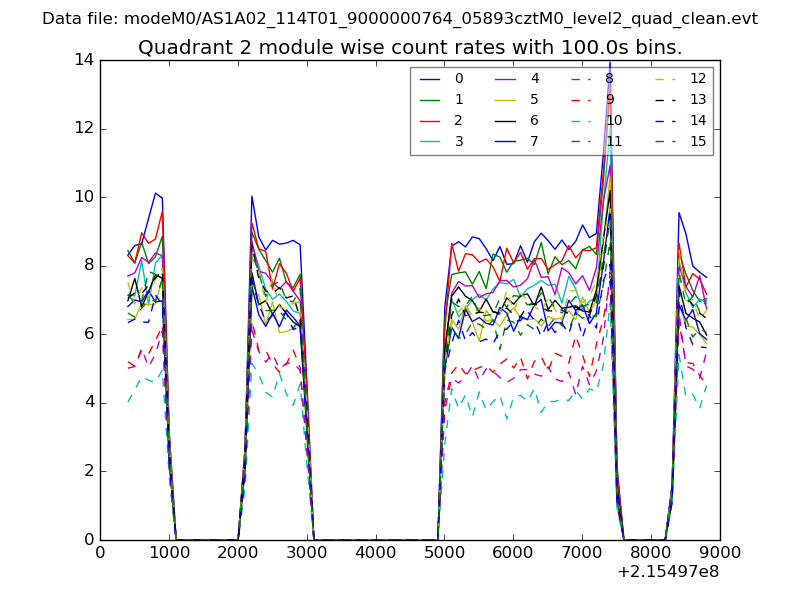
| Module-wise count rates for Quadrant B Data is divided into 100 sec bins |
 |
 |
| Module-wise count rates for Quadrant C Data is divided into 100 sec bins |
 |
 |
| Module-wise count rates for Quadrant D Data is divided into 100 sec bins |
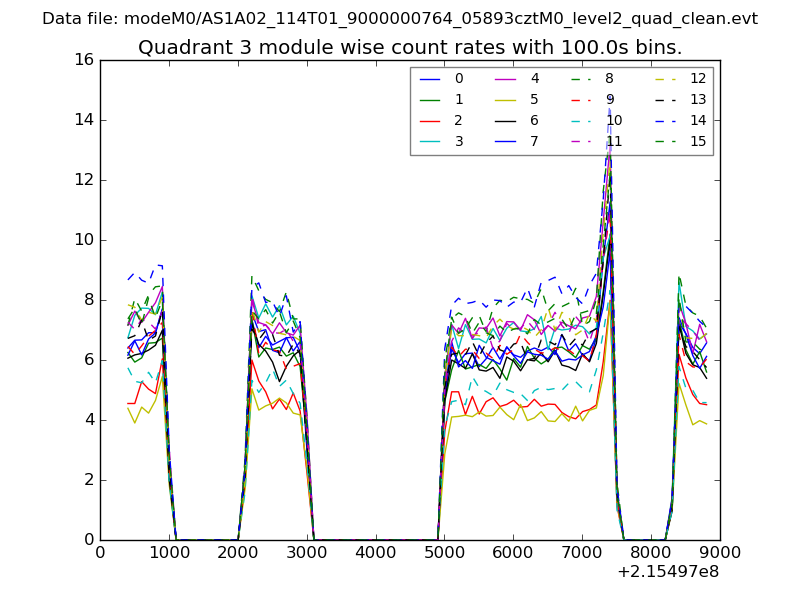 |
 |
| Parameter | Plot |
|---|---|
| CZT HV Monitor | 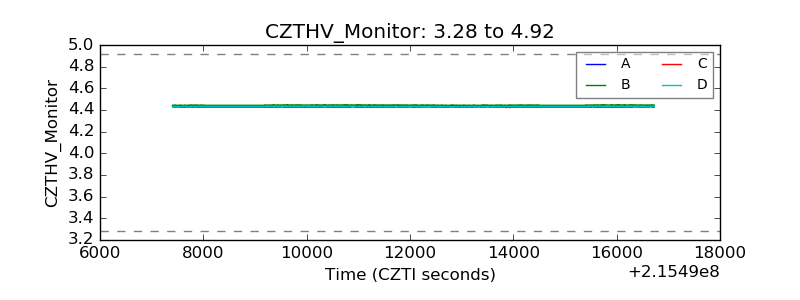 |
| D_VDD | 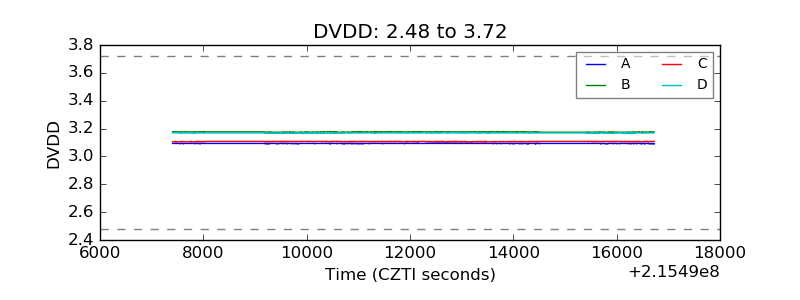 |
| Temperature 1 | 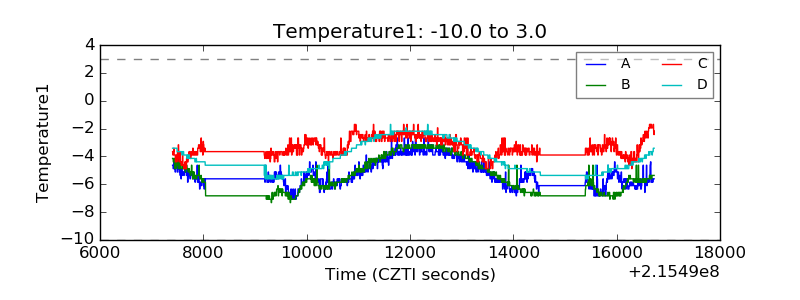 |
| Veto HV Monitor | 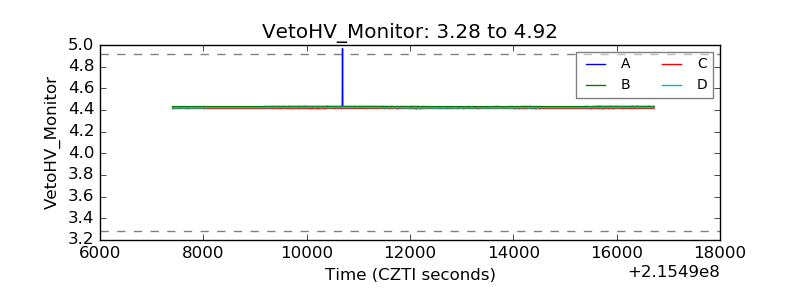 |
| Veto LLD | 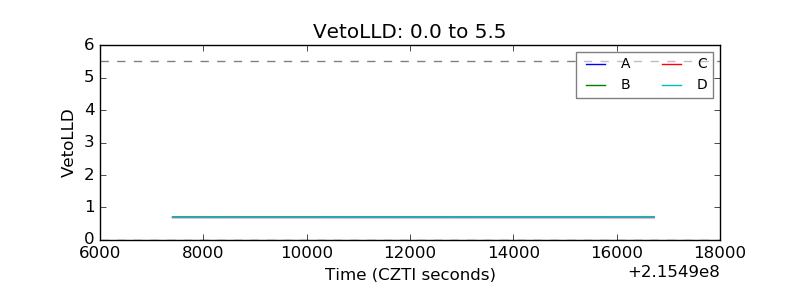 |
| Alpha Counter | 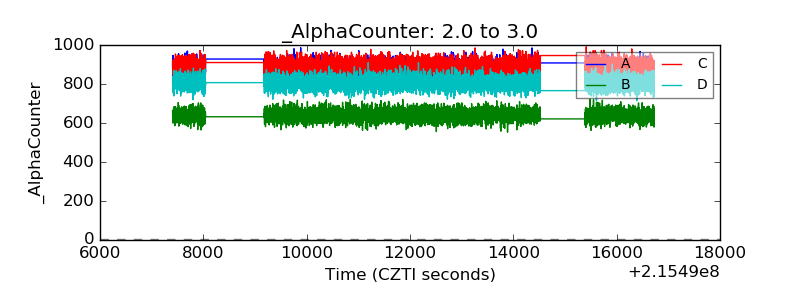 |
| _CPM_Rate | 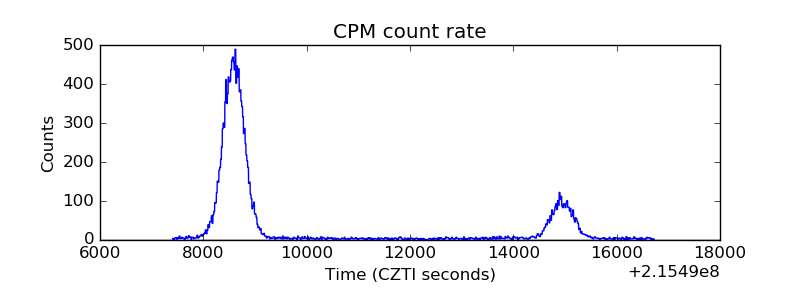 |
| CZT Counter | 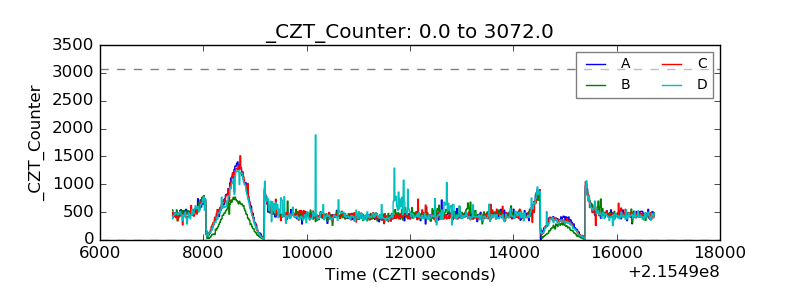 |
| +2.5 Volts monitor | 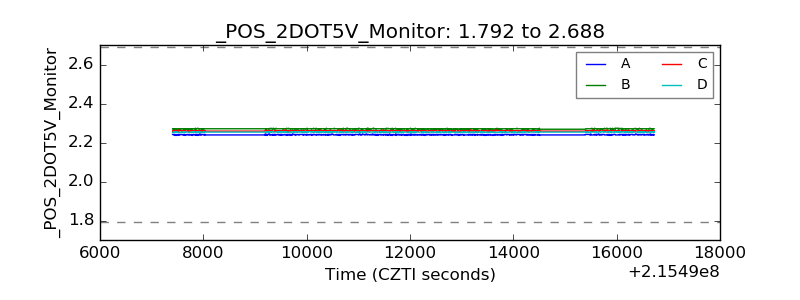 |
| +5 Volts monitor |  |
| _ROLL_ROT | 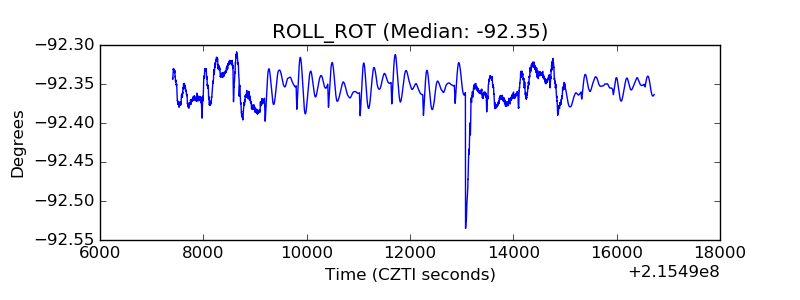 |
| _Roll_DEC | 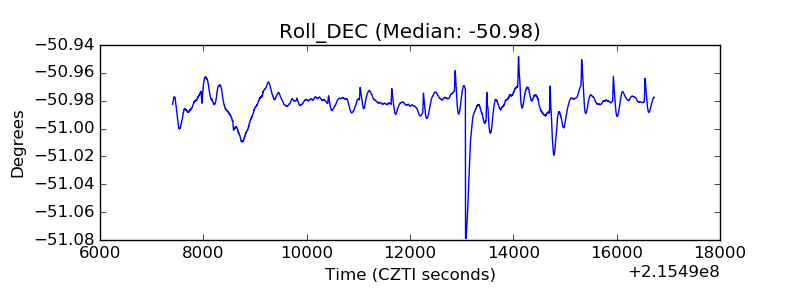 |
| _Roll_RA | 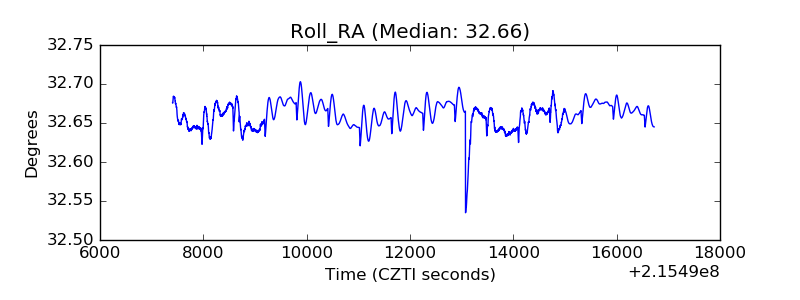 |
| Veto Counter | 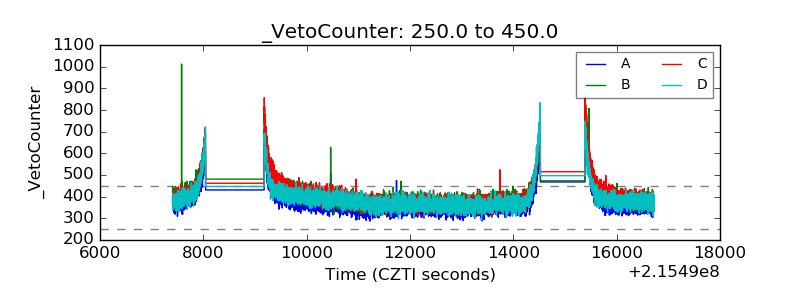 |