| Param | Original file | Final file |
|---|---|---|
| Filename | modeM0/AS1A02_114T01_9000000764_05894cztM0_level2.evt | modeM0/AS1A02_114T01_9000000764_05894cztM0_level2_quad_clean.evt |
| Size (bytes) | 497,525,760 | 72,757,440 |
| Size | 474.5 MB | 69.4 MB |
| Events in quadrant A | 3,486,321 | 432,171 |
| Events in quadrant B | 3,586,584 | 425,716 |
| Events in quadrant C | 3,308,007 | 429,976 |
| Events in quadrant D | 4,193,020 | 409,356 |
| Mode M9 | |||
|---|---|---|---|
| Quadrant | BADHDUFLAG | Total packets | Discarded packets |
| A | 0 | 7 | 0 |
| B | 0 | 7 | 0 |
| C | 0 | 7 | 0 |
| D | 0 | 8 | 0 |
| Mode SS | |||
|---|---|---|---|
| Quadrant | BADHDUFLAG | Total packets | Discarded packets |
| A | 0 | 148 | 0 |
| B | 0 | 148 | 0 |
| C | 0 | 148 | 0 |
| D | 0 | 148 | 0 |
| Mode M0 | |||
|---|---|---|---|
| Quadrant | BADHDUFLAG | Total packets | Discarded packets |
| A | 0 | 15200 | 28 |
| B | 0 | 15614 | 20 |
| C | 0 | 15138 | 17 |
| D | 0 | 17690 | 54 |
| Quadrant | Total seconds | Saturated seconds | Saturation percentage |
|---|---|---|---|
| A | 7258 | 196 | 2.700468% |
| B | 7261 | 214 | 2.947252% |
| C | 7263 | 169 | 2.326862% |
| D | 7249 | 294 | 4.055732% |
Noise dominated data is calculated using 1-second bins in cleaned event files. If a bin has >2000 counts, and if more than 50% of those come from <1% of pixels, then it is considered to be noise-dominated and hence unusable.
| Quadrant | # 1 sec bins | Bins with >0 counts | Bins with >2000 counts | High rate bins dominated by noise | Noise dominated (total time) | Noise dominated (detector-on time) | Marked lightcurve |
|---|---|---|---|---|---|---|---|
| A | 7710 | 7271 | 0 | 0 | 0.00% | 0.00% | 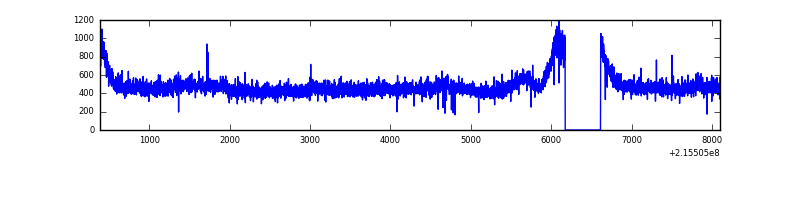 |
| B | 7710 | 7271 | 19 | 19 | 0.25% | 0.26% | 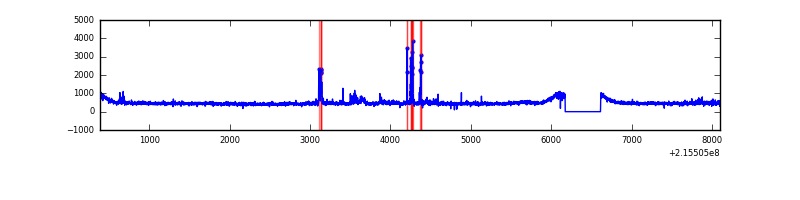 |
| C | 7710 | 7270 | 0 | 0 | 0.00% | 0.00% | 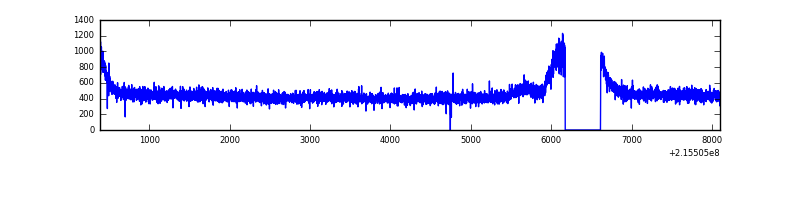 |
| D | 7710 | 7271 | 93 | 93 | 1.21% | 1.28% | 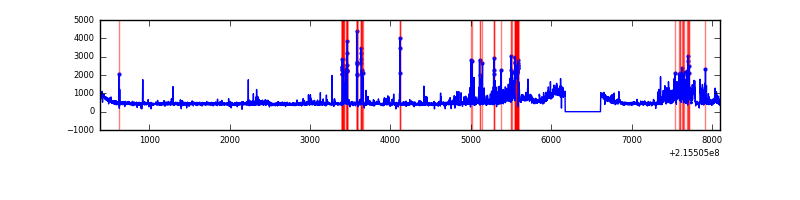 |
Top three noisy pixels from each quadrant. If the there are fewer than three noisy pixels in the level2.evt file, extra rows are filled as -1
| Pixel properties | Quadrant properties | ||||||
|---|---|---|---|---|---|---|---|
| Quadrant | DetID | PixID | Counts | Sigma | Mean | Median | Sigma |
| A | 15 | 236 | 188633 | 1070.36 | 855 | 835 | 175.5 |
| A | 12 | 194 | 8199 | 41.97 | 855 | 835 | 175.5 |
| A | 0 | 226 | 8076 | 41.27 | 855 | 835 | 175.5 |
| B | 15 | 255 | 165773 | 977.6 | 860 | 838 | 168.7 |
| B | 15 | 204 | 78126 | 458.1 | 860 | 838 | 168.7 |
| B | 12 | 111 | 16758 | 94.36 | 860 | 838 | 168.7 |
| C | 13 | 61 | 6707 | 29.59 | 846 | 848 | 198.0 |
| C | 9 | 247 | 5437 | 23.17 | 846 | 848 | 198.0 |
| C | 3 | 202 | 2067 | 6.15 | 846 | 848 | 198.0 |
| D | 13 | 105 | 423554 | 2062.7 | 832 | 806 | 204.9 |
| D | 2 | 152 | 204390 | 993.34 | 832 | 806 | 204.9 |
| D | 2 | 14 | 158386 | 768.87 | 832 | 806 | 204.9 |
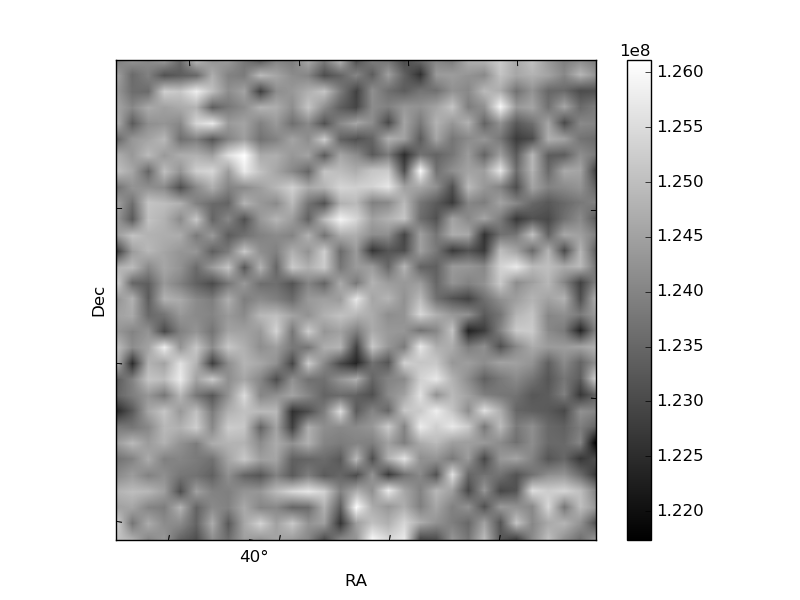
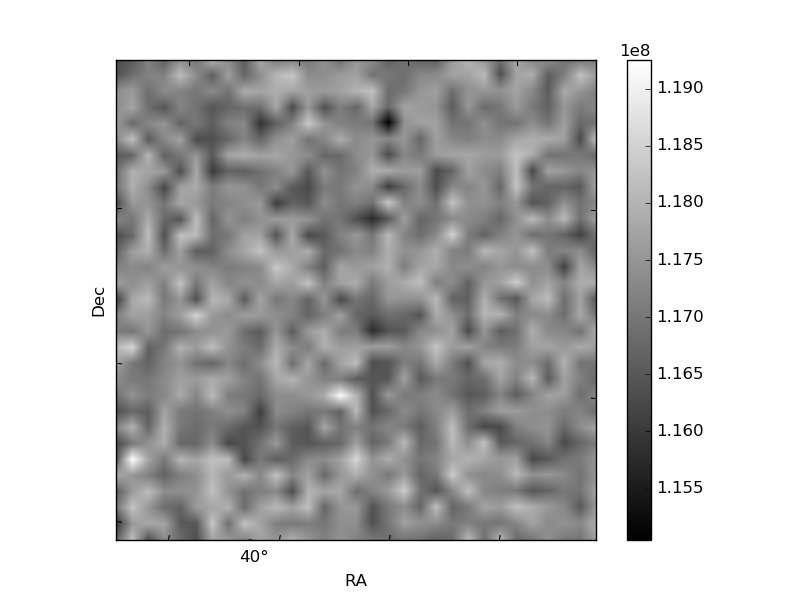
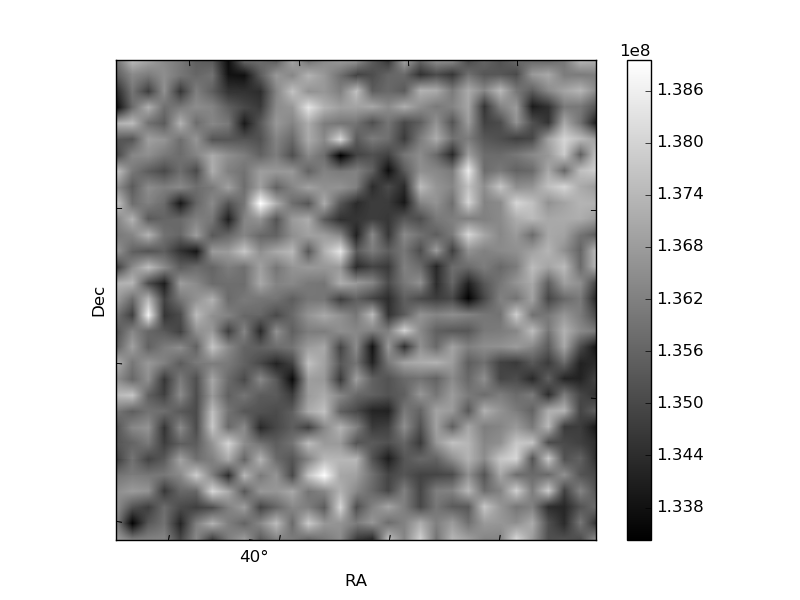
Histogram calculated using DETX and DETY for each event in the final _common_clean file
| Quadrant A | 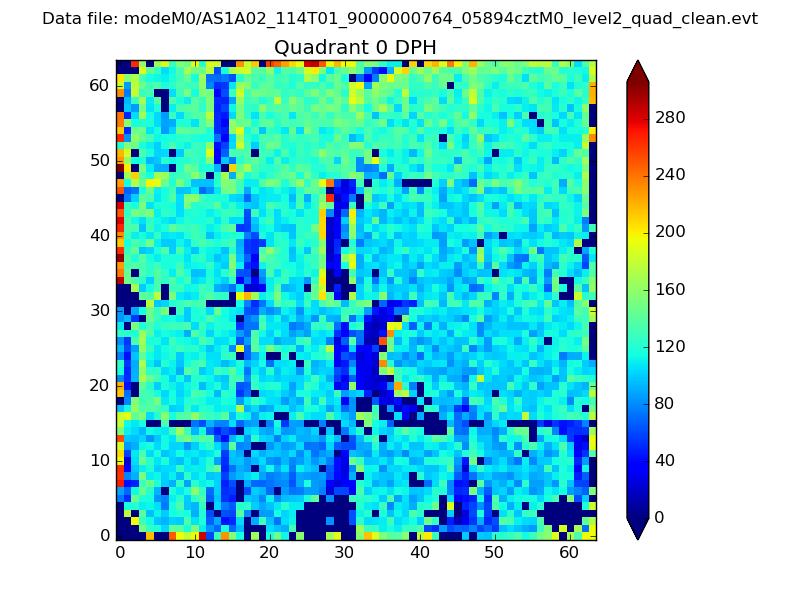 |
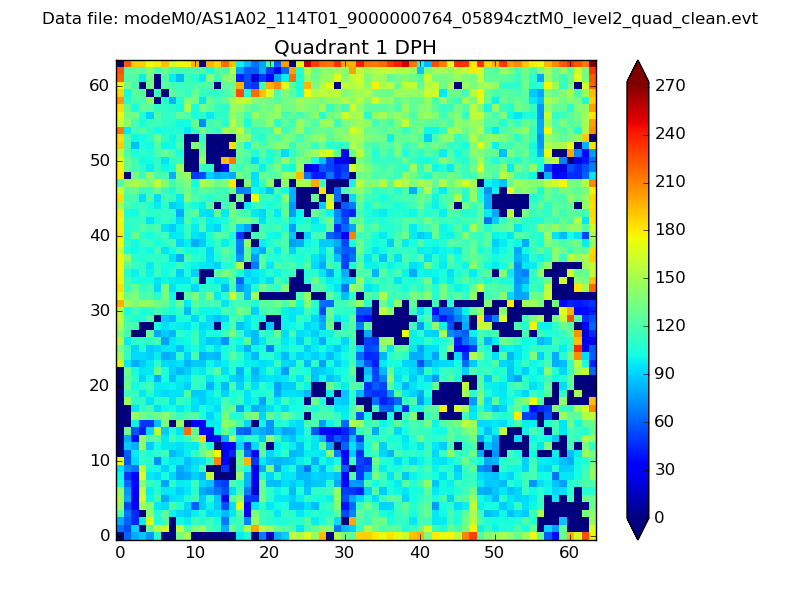 |
Quadrant B |
|---|---|---|---|
| Quadrant D | 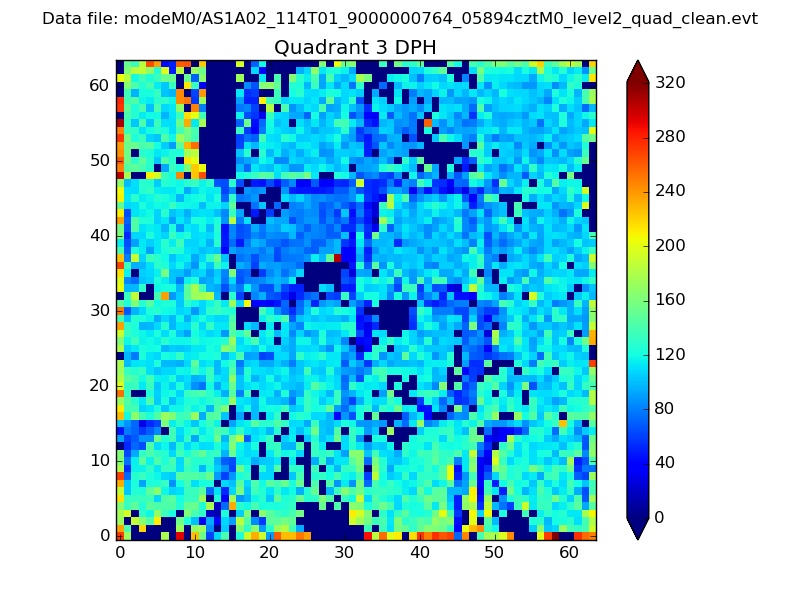 |
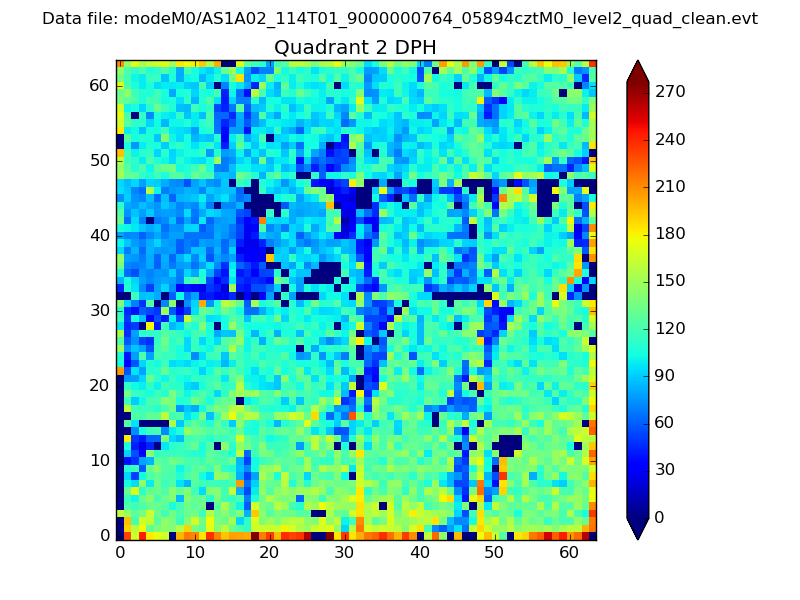 |
Quadrant C |
| Plot type | Count rate plots | Images |
|---|---|---|
| Comparison with Poisson distribution Blue bars denote a histogram of data divided into 1 sec bins. Red curve is a Poisson curve with rate = median count rate of data. |
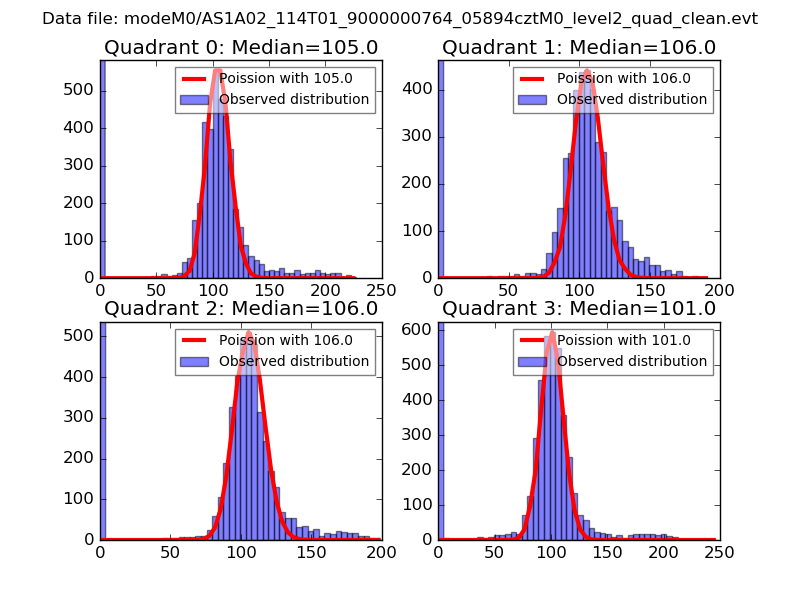 |
 |
| Quadrant-wise count rates Data is divided into 100 sec bins |
 |
|
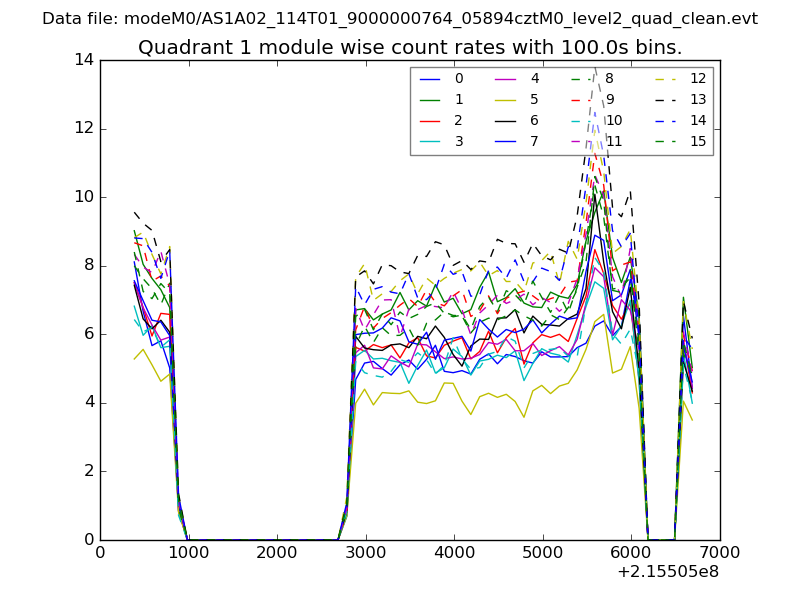
| Module-wise count rates for Quadrant A Data is divided into 100 sec bins |
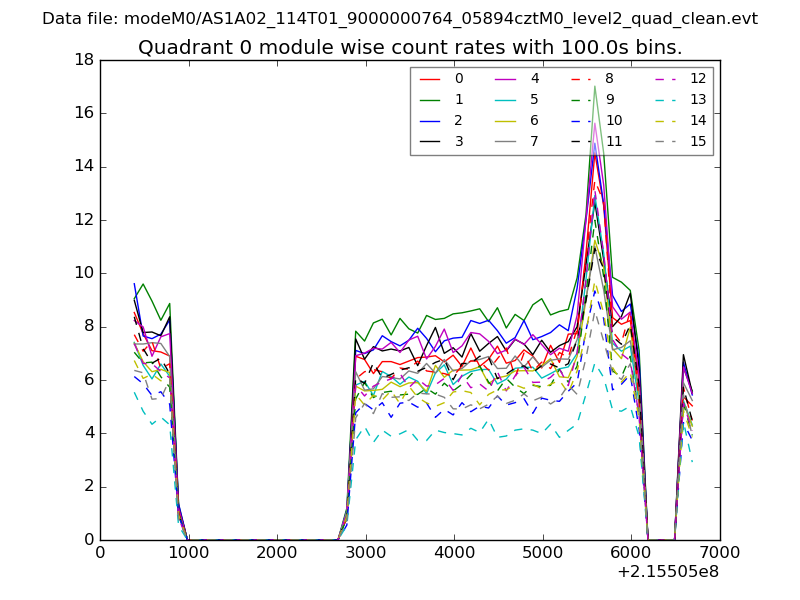 |
 |
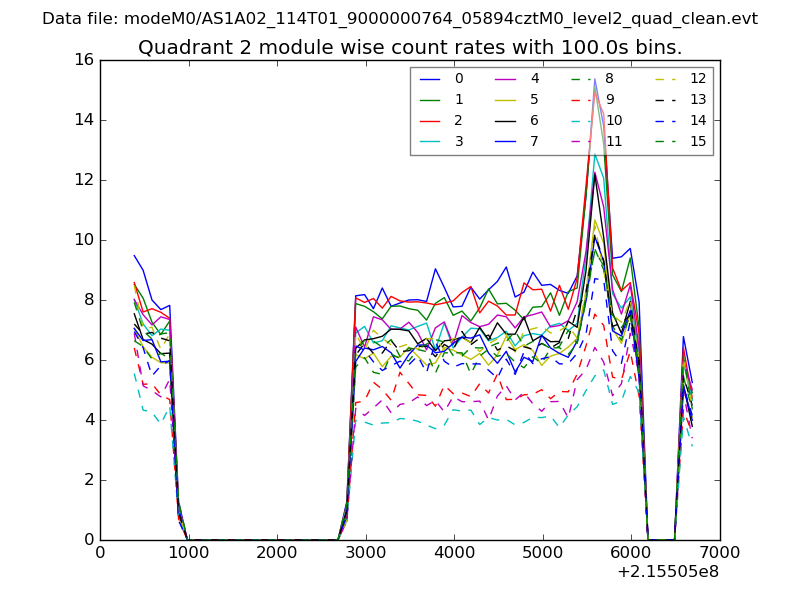
| Module-wise count rates for Quadrant B Data is divided into 100 sec bins |
 |
 |
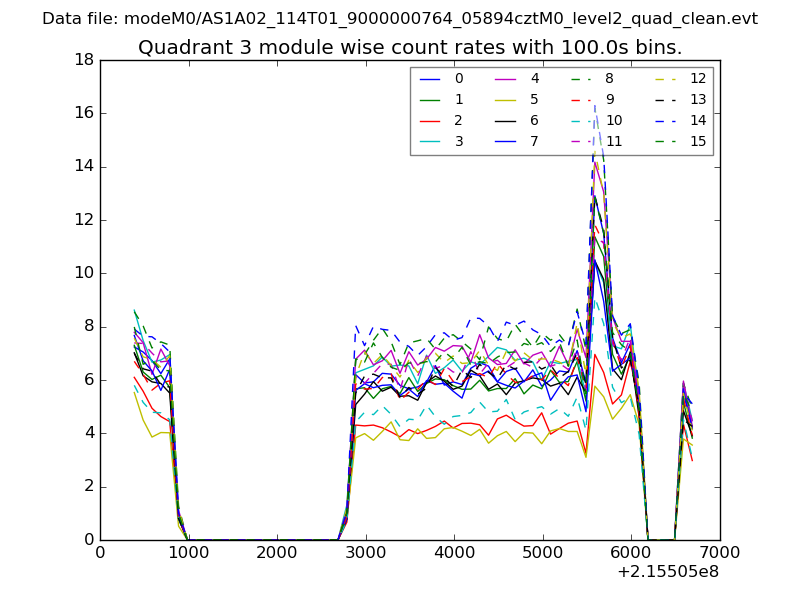
| Module-wise count rates for Quadrant C Data is divided into 100 sec bins |
 |
 |
| Module-wise count rates for Quadrant D Data is divided into 100 sec bins |
 |
 |
| Parameter | Plot |
|---|---|
| CZT HV Monitor | 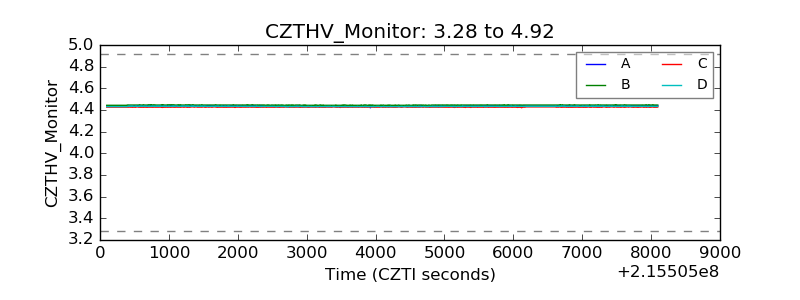 |
| D_VDD | 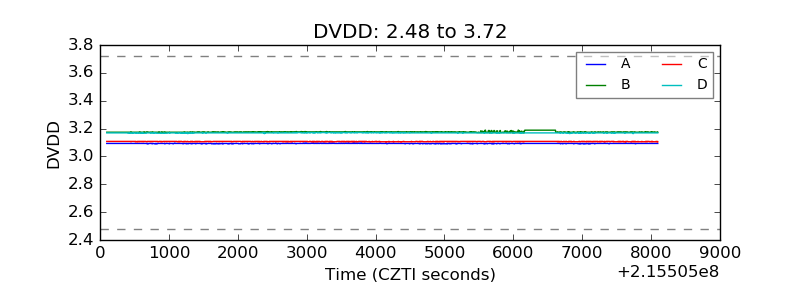 |
| Temperature 1 | 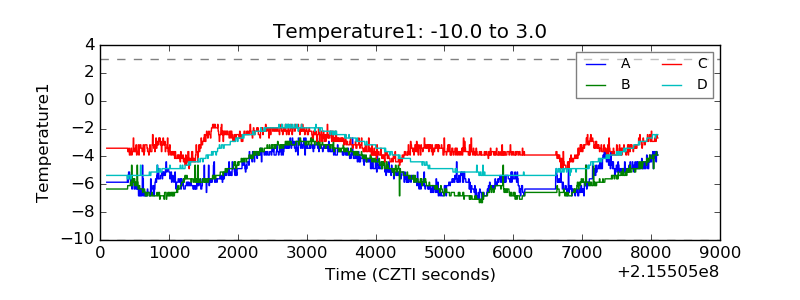 |
| Veto HV Monitor | 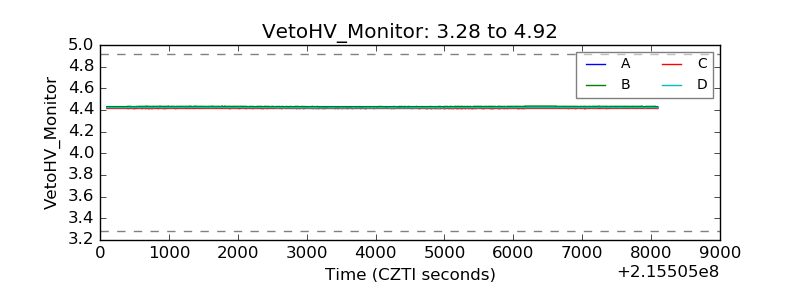 |
| Veto LLD | 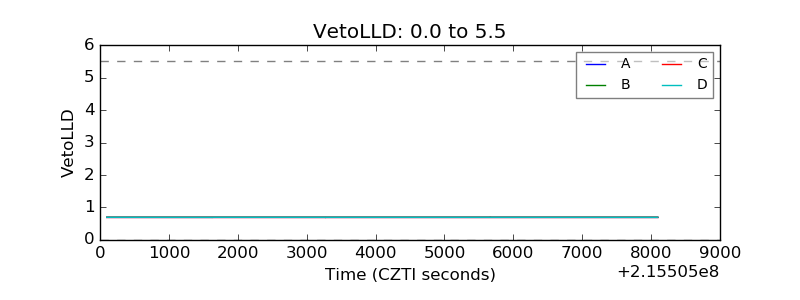 |
| Alpha Counter | 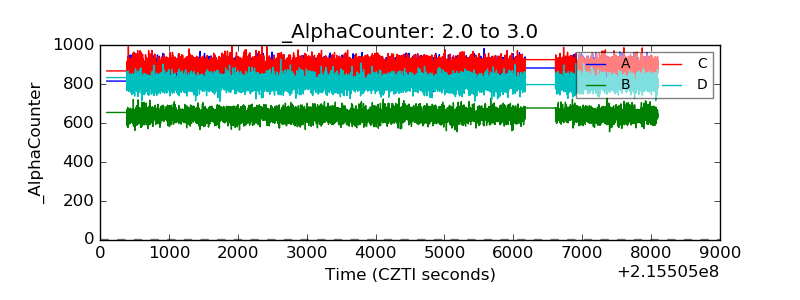 |
| _CPM_Rate | 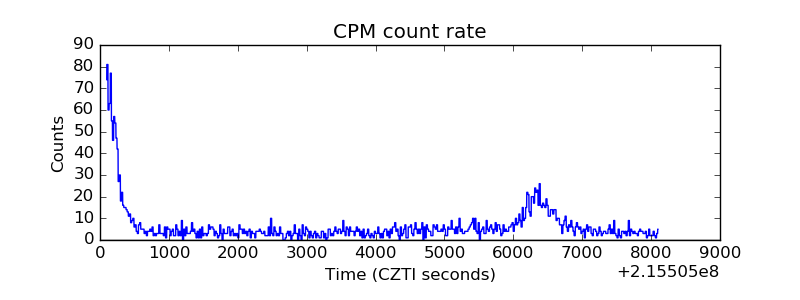 |
| CZT Counter | 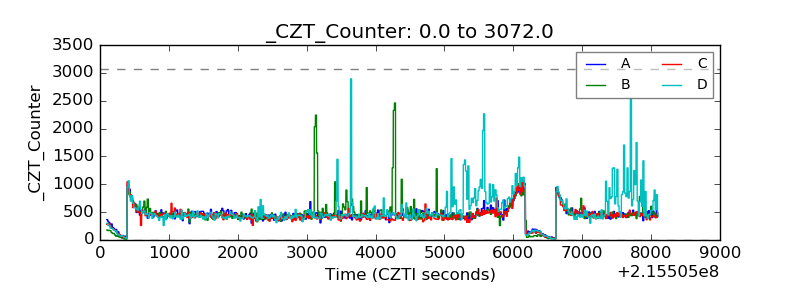 |
| +2.5 Volts monitor |  |
| +5 Volts monitor |  |
| _ROLL_ROT | 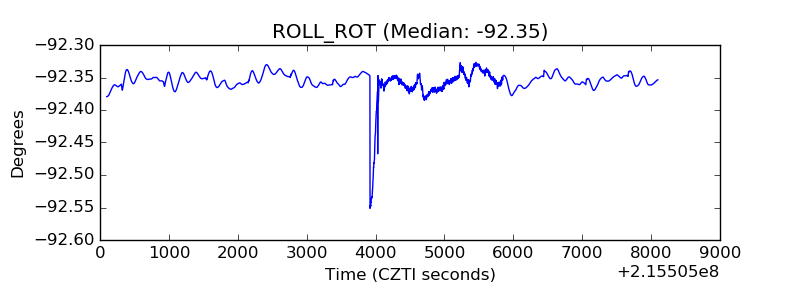 |
| _Roll_DEC | 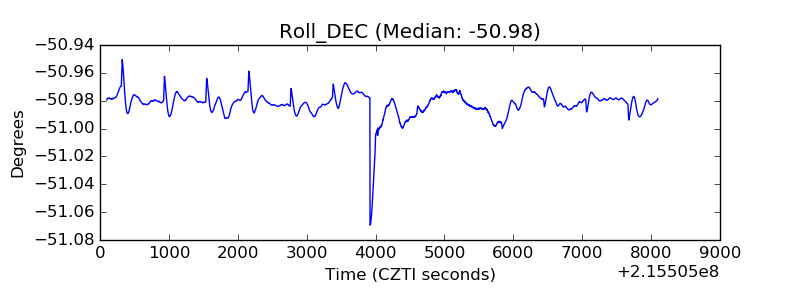 |
| _Roll_RA | 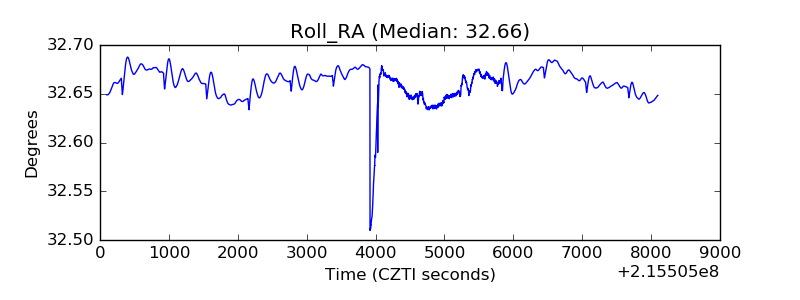 |
| Veto Counter | 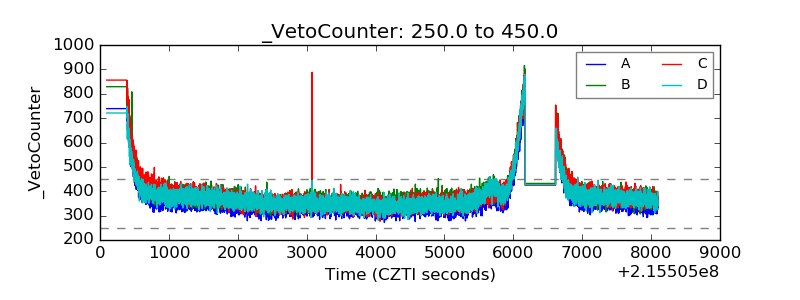 |