| Param | Original file | Final file |
|---|---|---|
| Filename | modeM0/AS1A02_114T01_9000000764_05895cztM0_level2.evt | modeM0/AS1A02_114T01_9000000764_05895cztM0_level2_quad_clean.evt |
| Size (bytes) | 606,545,280 | 86,232,960 |
| Size | 578.4 MB | 82.2 MB |
| Events in quadrant A | 4,290,696 | 512,834 |
| Events in quadrant B | 4,197,028 | 507,182 |
| Events in quadrant C | 4,052,672 | 507,438 |
| Events in quadrant D | 5,245,977 | 487,377 |
| Mode M9 | |||
|---|---|---|---|
| Quadrant | BADHDUFLAG | Total packets | Discarded packets |
| A | 0 | 5 | 0 |
| B | 0 | 5 | 0 |
| C | 0 | 5 | 0 |
| D | 0 | 5 | 0 |
| Mode SS | |||
|---|---|---|---|
| Quadrant | BADHDUFLAG | Total packets | Discarded packets |
| A | 0 | 174 | 0 |
| B | 0 | 174 | 2 |
| C | 0 | 174 | 0 |
| D | 0 | 174 | 0 |
| Mode M0 | |||
|---|---|---|---|
| Quadrant | BADHDUFLAG | Total packets | Discarded packets |
| A | 0 | 18532 | 176 |
| B | 0 | 18462 | 171 |
| C | 0 | 18483 | 161 |
| D | 0 | 21853 | 240 |
| Quadrant | Total seconds | Saturated seconds | Saturation percentage |
|---|---|---|---|
| A | 8585 | 452 | 5.264997% |
| B | 8583 | 444 | 5.173016% |
| C | 8588 | 332 | 3.865859% |
| D | 8580 | 490 | 5.710956% |
Noise dominated data is calculated using 1-second bins in cleaned event files. If a bin has >2000 counts, and if more than 50% of those come from <1% of pixels, then it is considered to be noise-dominated and hence unusable.
| Quadrant | # 1 sec bins | Bins with >0 counts | Bins with >2000 counts | High rate bins dominated by noise | Noise dominated (total time) | Noise dominated (detector-on time) | Marked lightcurve |
|---|---|---|---|---|---|---|---|
| A | 9103 | 8658 | 0 | 0 | 0.00% | 0.00% | 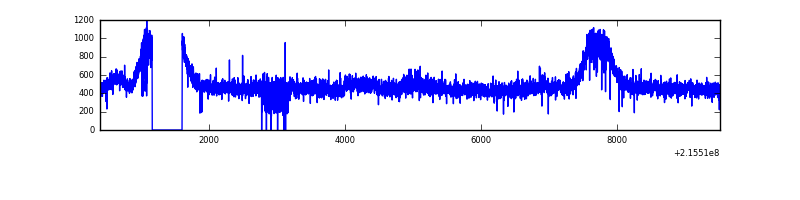 |
| B | 9103 | 8661 | 0 | 0 | 0.00% | 0.00% | 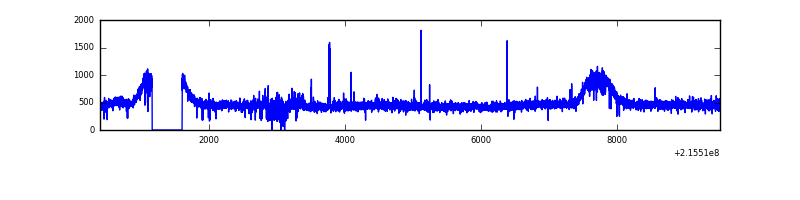 |
| C | 9103 | 8656 | 0 | 0 | 0.00% | 0.00% | 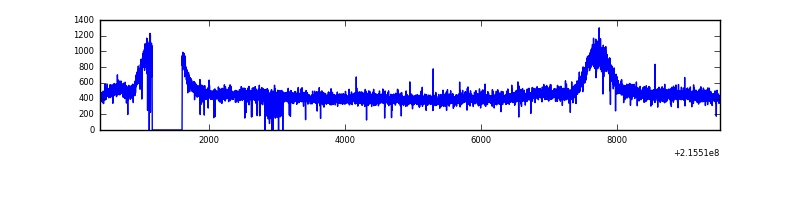 |
| D | 9103 | 8656 | 75 | 75 | 0.82% | 0.87% | 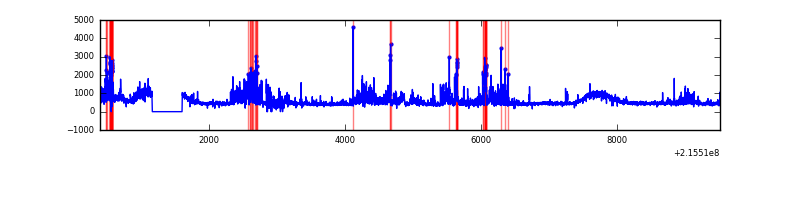 |
Top three noisy pixels from each quadrant. If the there are fewer than three noisy pixels in the level2.evt file, extra rows are filled as -1
| Pixel properties | Quadrant properties | ||||||
|---|---|---|---|---|---|---|---|
| Quadrant | DetID | PixID | Counts | Sigma | Mean | Median | Sigma |
| A | 15 | 236 | 237945 | 1091.97 | 1049 | 1021 | 217.0 |
| A | 12 | 194 | 10146 | 42.05 | 1049 | 1021 | 217.0 |
| A | 0 | 226 | 9950 | 41.15 | 1049 | 1021 | 217.0 |
| B | 15 | 204 | 92336 | 439.71 | 1055 | 1023 | 207.7 |
| B | 12 | 111 | 20768 | 95.08 | 1055 | 1023 | 207.7 |
| B | 11 | 111 | 16287 | 73.5 | 1055 | 1023 | 207.7 |
| C | 13 | 61 | 8229 | 29.68 | 1036 | 1039 | 242.3 |
| C | 9 | 247 | 4329 | 13.58 | 1036 | 1039 | 242.3 |
| C | 14 | 67 | 3170 | 8.8 | 1036 | 1039 | 242.3 |
| D | 12 | 233 | 331694 | 1305.14 | 1030 | 995 | 253.4 |
| D | 2 | 152 | 309192 | 1216.33 | 1030 | 995 | 253.4 |
| D | 13 | 105 | 280655 | 1103.71 | 1030 | 995 | 253.4 |
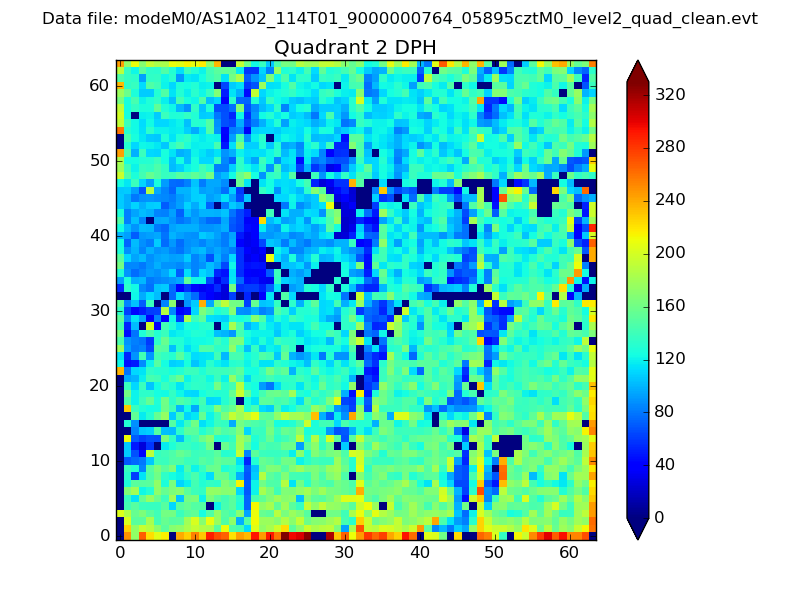
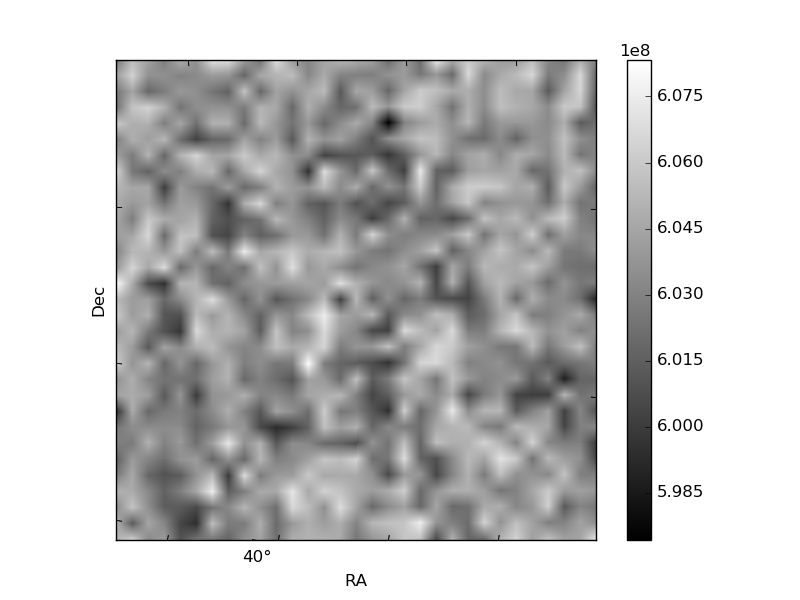
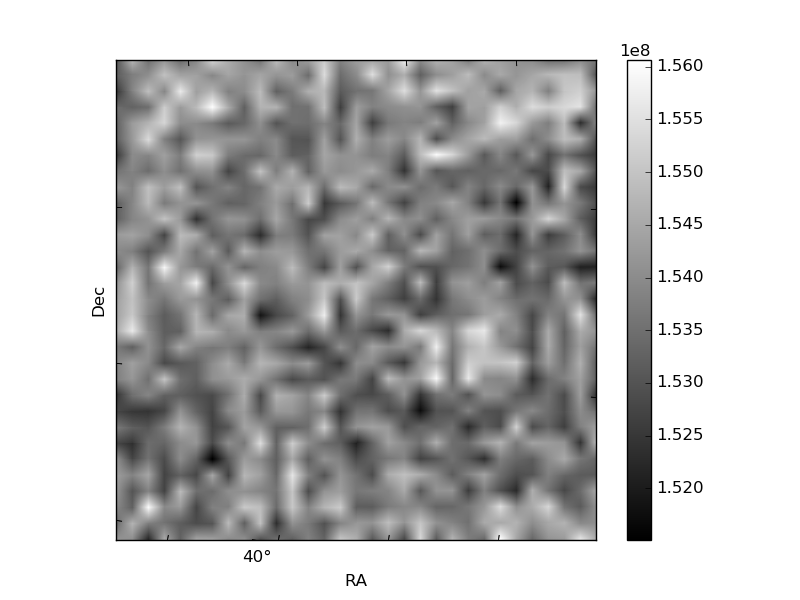
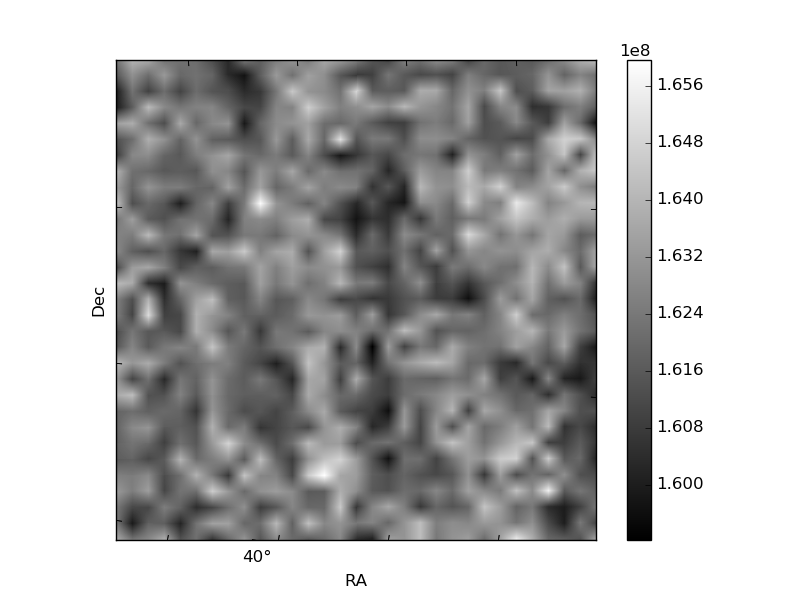
Histogram calculated using DETX and DETY for each event in the final _common_clean file
| Quadrant A | 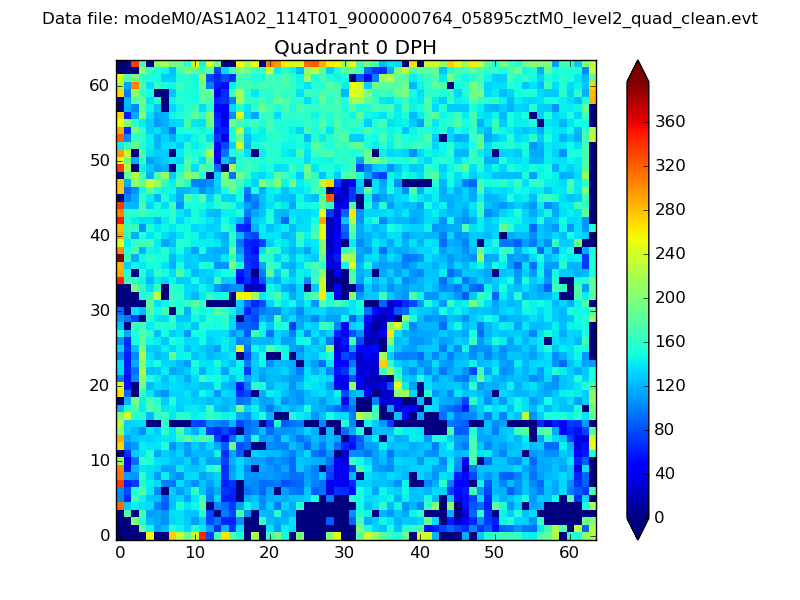 |
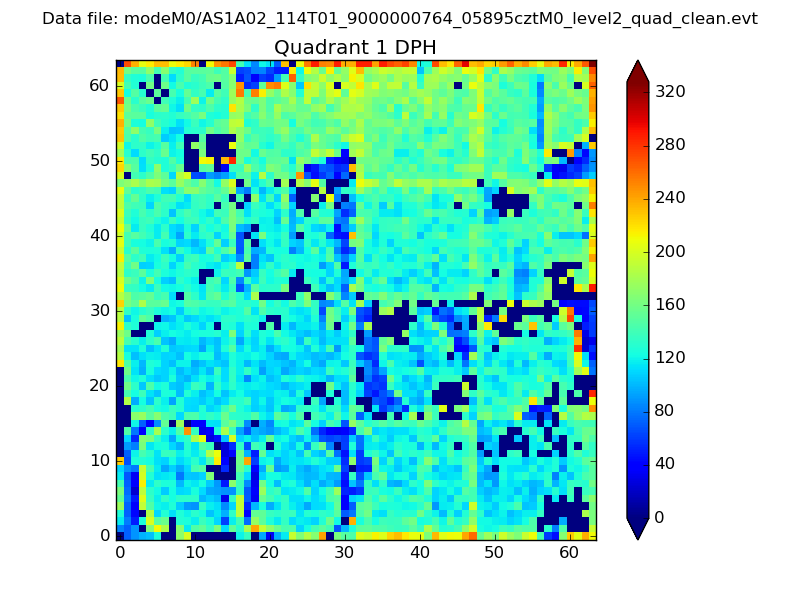 |
Quadrant B |
|---|---|---|---|
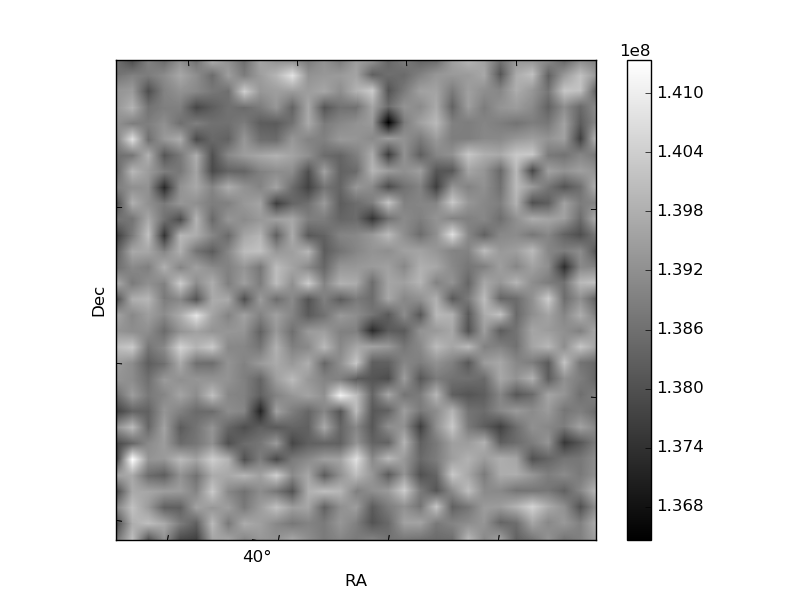
| Quadrant D | 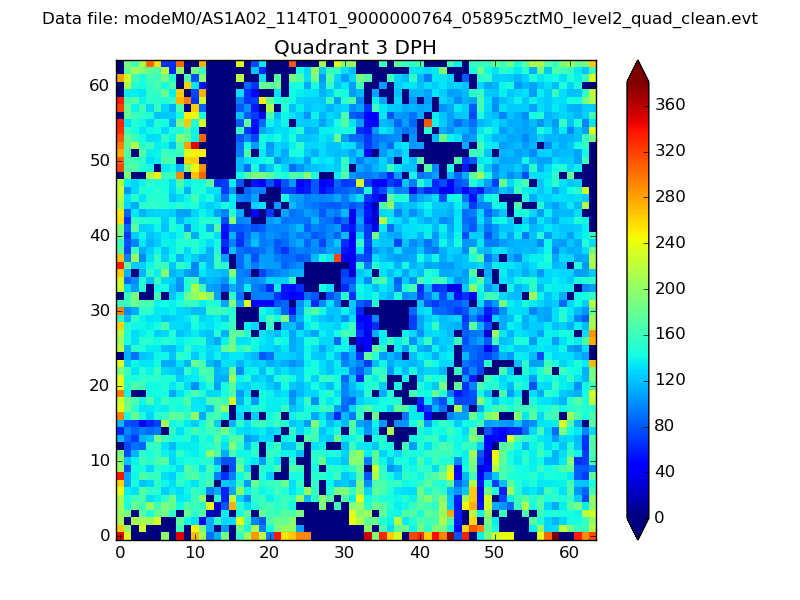 |
 |
Quadrant C |
| Plot type | Count rate plots | Images |
|---|---|---|
| Comparison with Poisson distribution Blue bars denote a histogram of data divided into 1 sec bins. Red curve is a Poisson curve with rate = median count rate of data. |
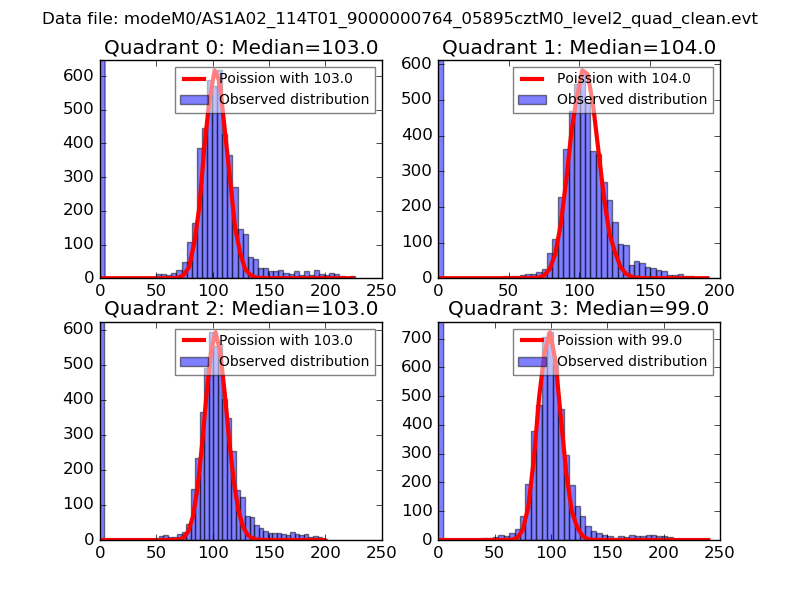 |
 |
| Quadrant-wise count rates Data is divided into 100 sec bins |
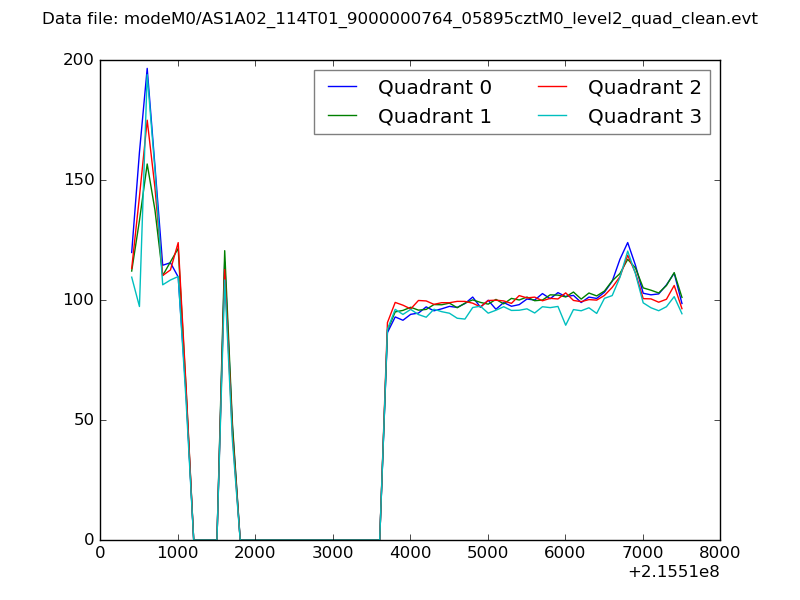 |
|
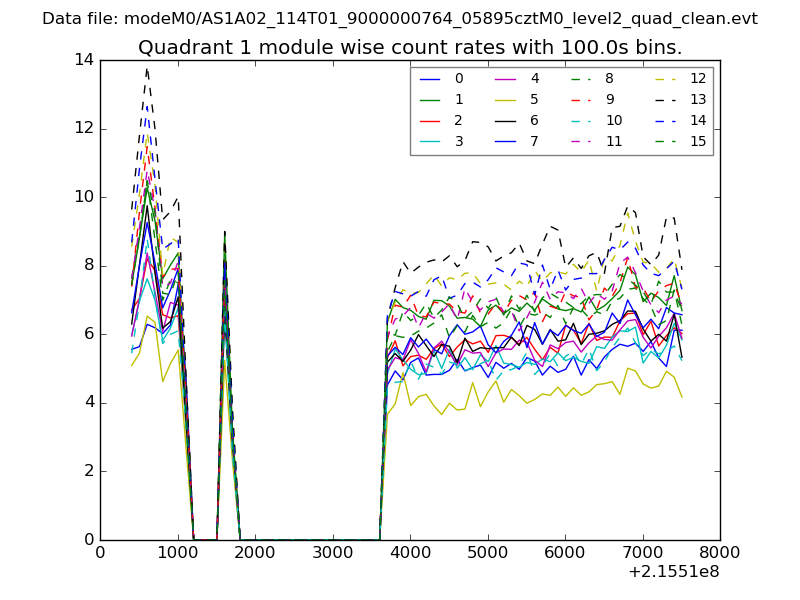
| Module-wise count rates for Quadrant A Data is divided into 100 sec bins |
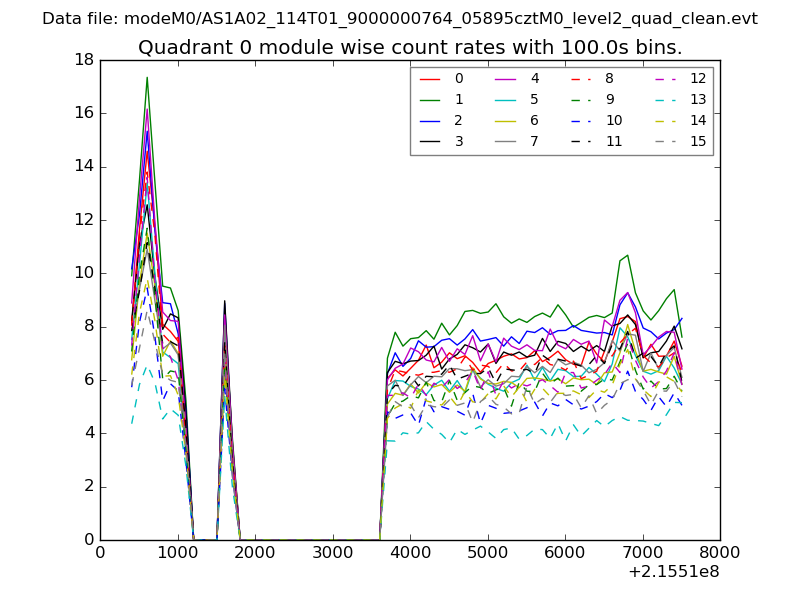 |
 |
| Module-wise count rates for Quadrant B Data is divided into 100 sec bins |
 |
 |
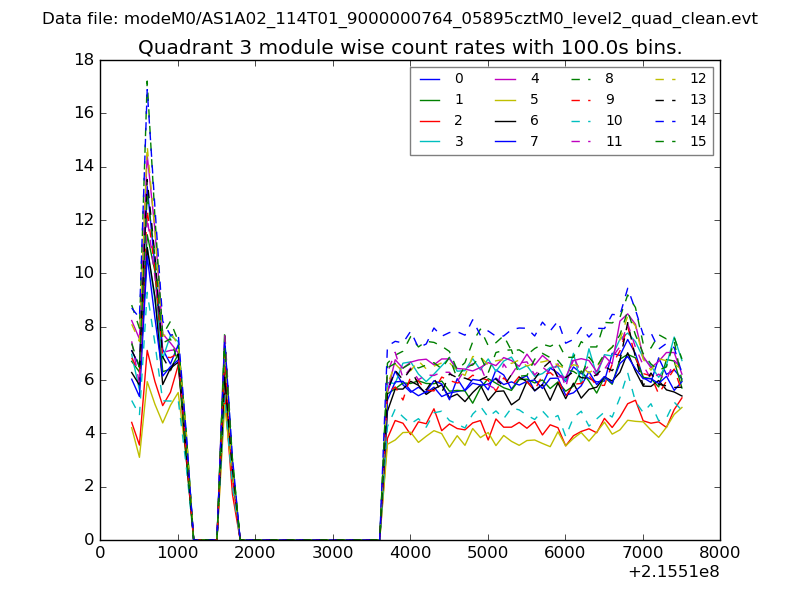
| Module-wise count rates for Quadrant C Data is divided into 100 sec bins |
 |
 |
| Module-wise count rates for Quadrant D Data is divided into 100 sec bins |
 |
 |
| Parameter | Plot |
|---|---|
| CZT HV Monitor |  |
| D_VDD | 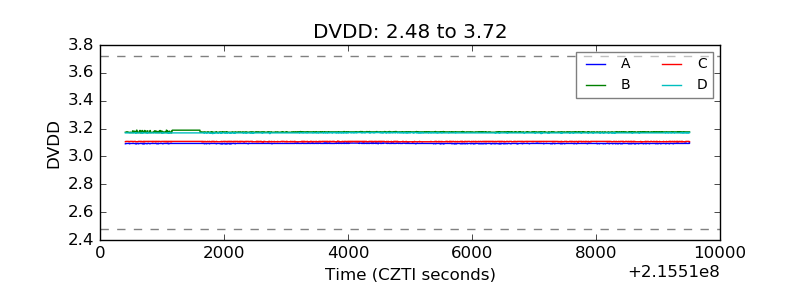 |
| Temperature 1 | 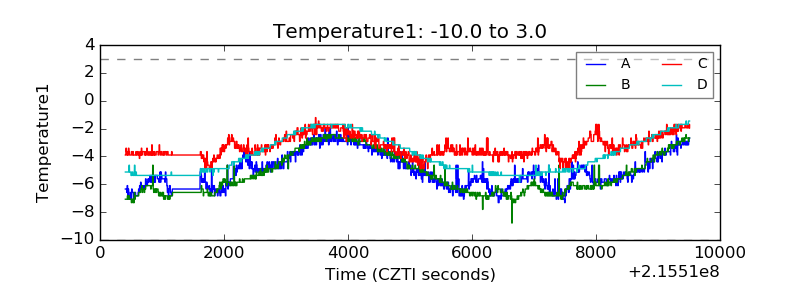 |
| Veto HV Monitor | 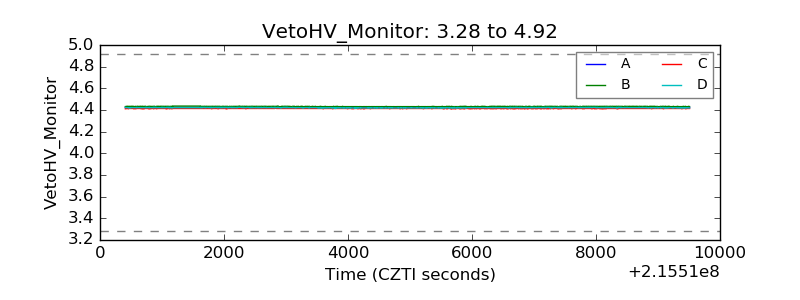 |
| Veto LLD | 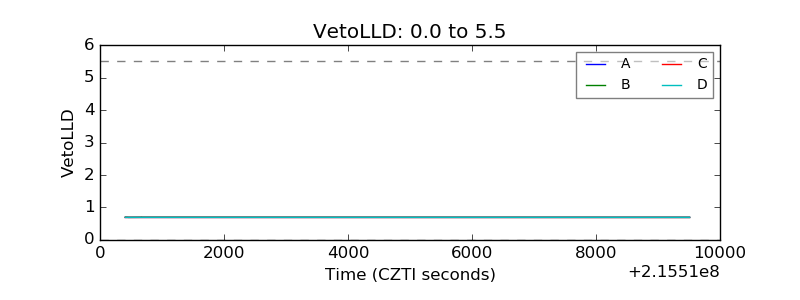 |
| Alpha Counter | 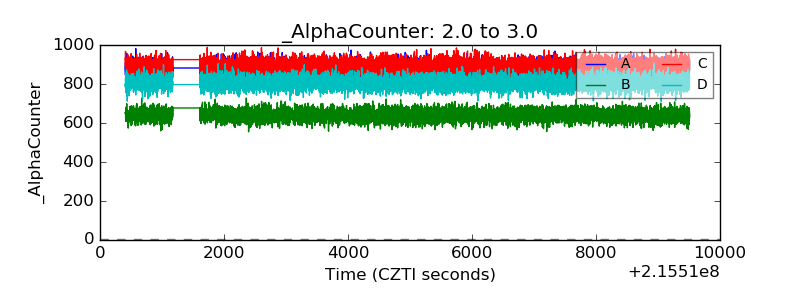 |
| _CPM_Rate | 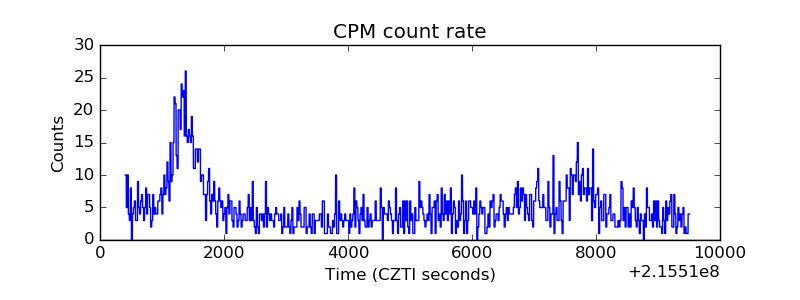 |
| CZT Counter | 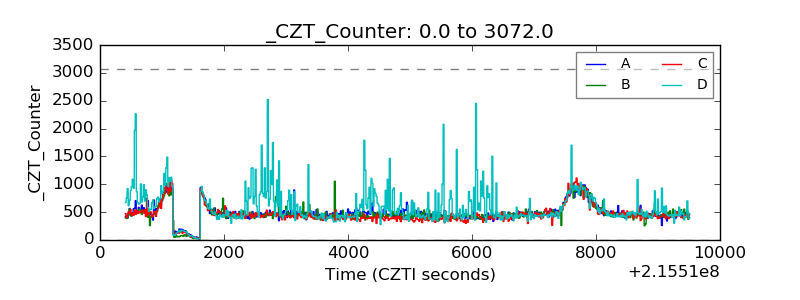 |
| +2.5 Volts monitor |  |
| +5 Volts monitor | 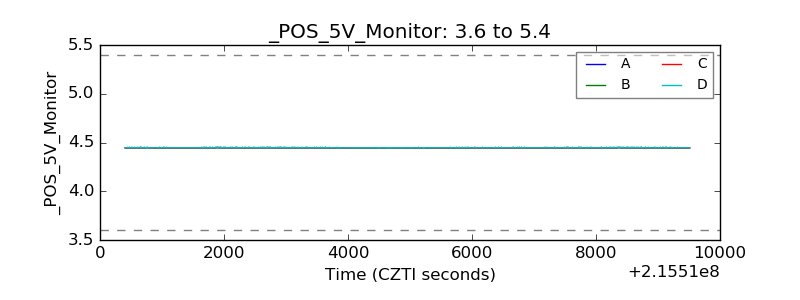 |
| _ROLL_ROT | 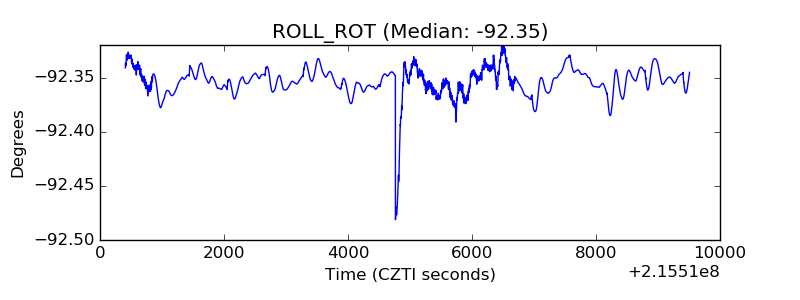 |
| _Roll_DEC | 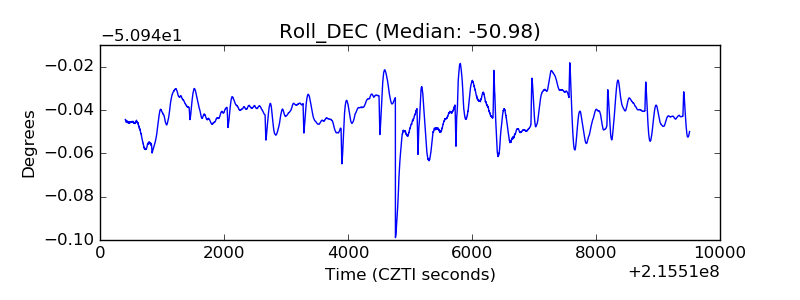 |
| _Roll_RA | 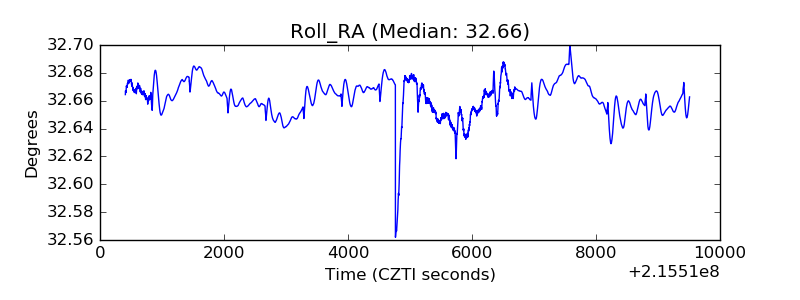 |
| Veto Counter | 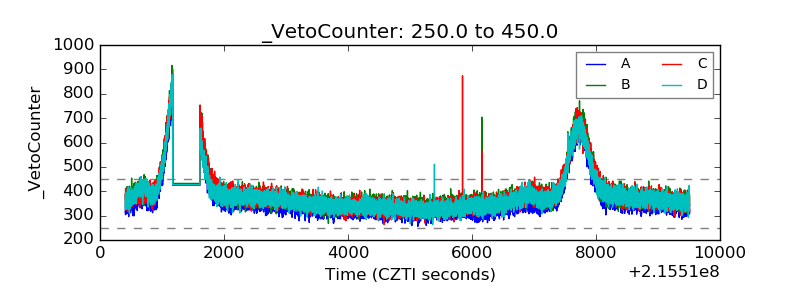 |