| Param | Original file | Final file |
|---|---|---|
| Filename | modeM0/AS1A02_114T01_9000000764_05896cztM0_level2.evt | modeM0/AS1A02_114T01_9000000764_05896cztM0_level2_quad_clean.evt |
| Size (bytes) | 83,131,200 | 6,963,840 |
| Size | 79.3 MB | 6.6 MB |
| Events in quadrant A | 615,226 | 35,512 |
| Events in quadrant B | 600,733 | 35,979 |
| Events in quadrant C | 616,456 | 33,545 |
| Events in quadrant D | 619,150 | 33,486 |
| Mode SS | |||
|---|---|---|---|
| Quadrant | BADHDUFLAG | Total packets | Discarded packets |
| A | 0 | 20 | 0 |
| B | 0 | 20 | 2 |
| C | 0 | 20 | 2 |
| D | 0 | 20 | 0 |
| Mode M0 | |||
|---|---|---|---|
| Quadrant | BADHDUFLAG | Total packets | Discarded packets |
| A | 0 | 2699 | 289 |
| B | 0 | 2653 | 301 |
| C | 0 | 2715 | 269 |
| D | 0 | 2763 | 299 |
| Quadrant | Total seconds | Saturated seconds | Saturation percentage |
|---|---|---|---|
| A | 918 | 243 | 26.470588% |
| B | 913 | 238 | 26.067908% |
| C | 926 | 159 | 17.170626% |
| D | 918 | 194 | 21.132898% |
Noise dominated data is calculated using 1-second bins in cleaned event files. If a bin has >2000 counts, and if more than 50% of those come from <1% of pixels, then it is considered to be noise-dominated and hence unusable.
| Quadrant | # 1 sec bins | Bins with >0 counts | Bins with >2000 counts | High rate bins dominated by noise | Noise dominated (total time) | Noise dominated (detector-on time) | Marked lightcurve |
|---|---|---|---|---|---|---|---|
| A | 1012 | 992 | 0 | 0 | 0.00% | 0.00% | 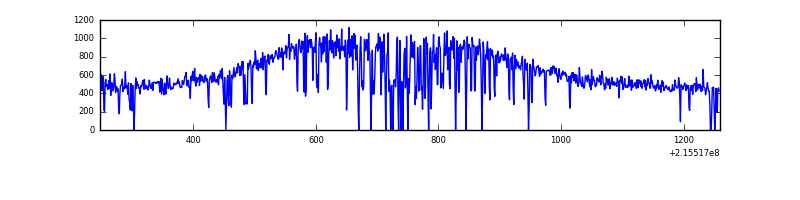 |
| B | 1012 | 995 | 0 | 0 | 0.00% | 0.00% | 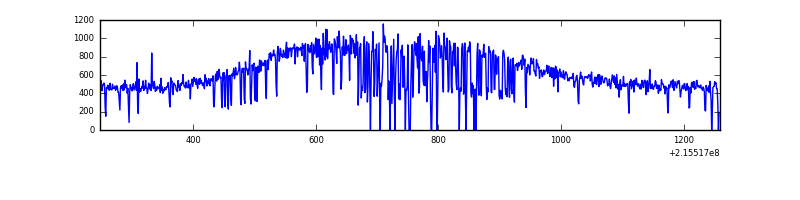 |
| C | 1012 | 999 | 0 | 0 | 0.00% | 0.00% | 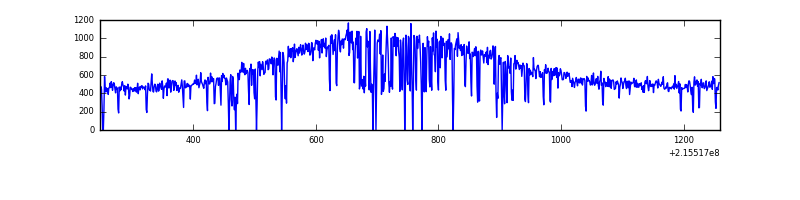 |
| D | 1012 | 996 | 0 | 0 | 0.00% | 0.00% | 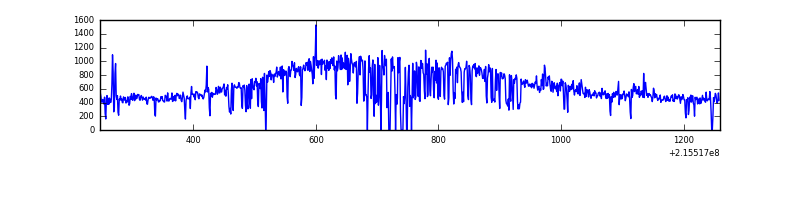 |
Top three noisy pixels from each quadrant. If the there are fewer than three noisy pixels in the level2.evt file, extra rows are filled as -1
| Pixel properties | Quadrant properties | ||||||
|---|---|---|---|---|---|---|---|
| Quadrant | DetID | PixID | Counts | Sigma | Mean | Median | Sigma |
| A | 15 | 236 | 8862 | 241.78 | 156 | 151 | 36.0 |
| A | 8 | 15 | 2053 | 52.79 | 156 | 151 | 36.0 |
| A | 12 | 194 | 1596 | 40.11 | 156 | 151 | 36.0 |
| B | 12 | 111 | 3483 | 95.39 | 154 | 148 | 35.0 |
| B | 15 | 204 | 3367 | 92.07 | 154 | 148 | 35.0 |
| B | 11 | 111 | 2655 | 71.71 | 154 | 148 | 35.0 |
| C | 14 | 67 | 1366 | 29.83 | 157 | 157 | 40.5 |
| C | 13 | 61 | 1261 | 27.24 | 157 | 157 | 40.5 |
| C | 8 | 222 | 695 | 13.27 | 157 | 157 | 40.5 |
| D | 2 | 152 | 15518 | 362.59 | 158 | 151 | 42.4 |
| D | 2 | 14 | 3964 | 89.97 | 158 | 151 | 42.4 |
| D | 2 | 206 | 3639 | 82.3 | 158 | 151 | 42.4 |
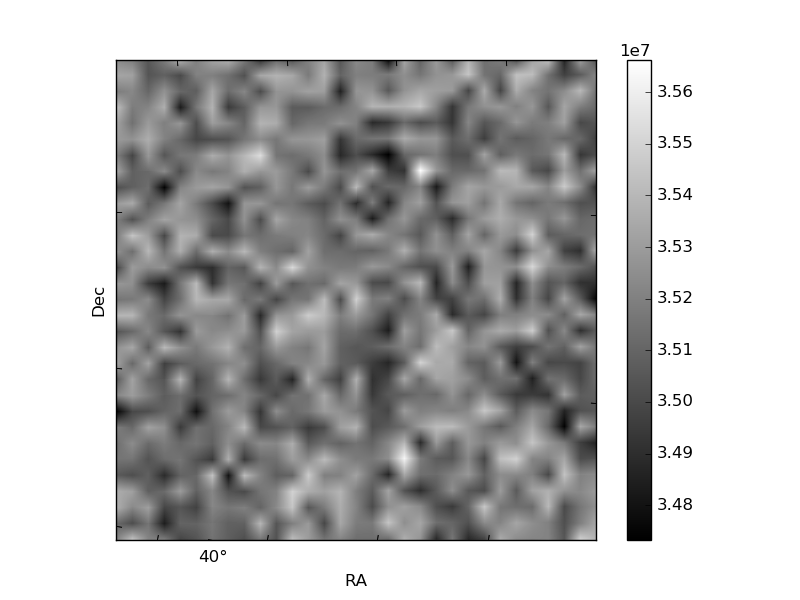
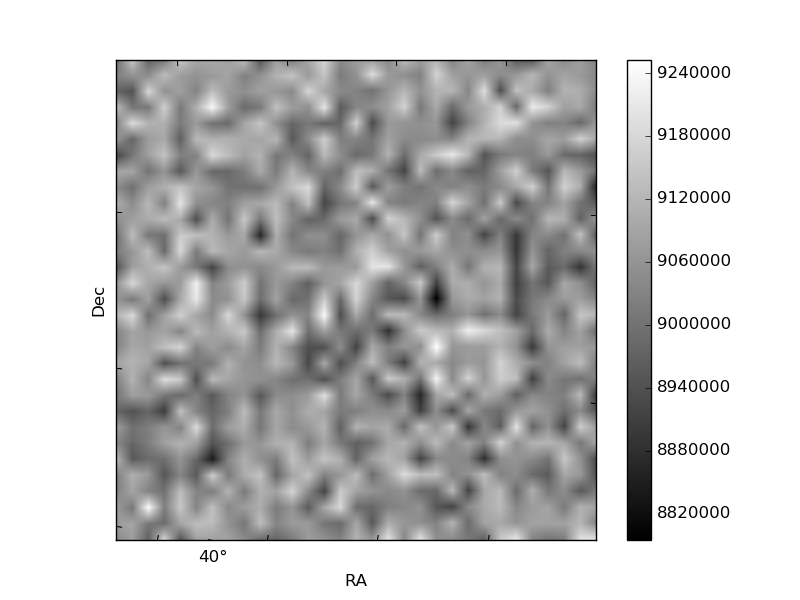
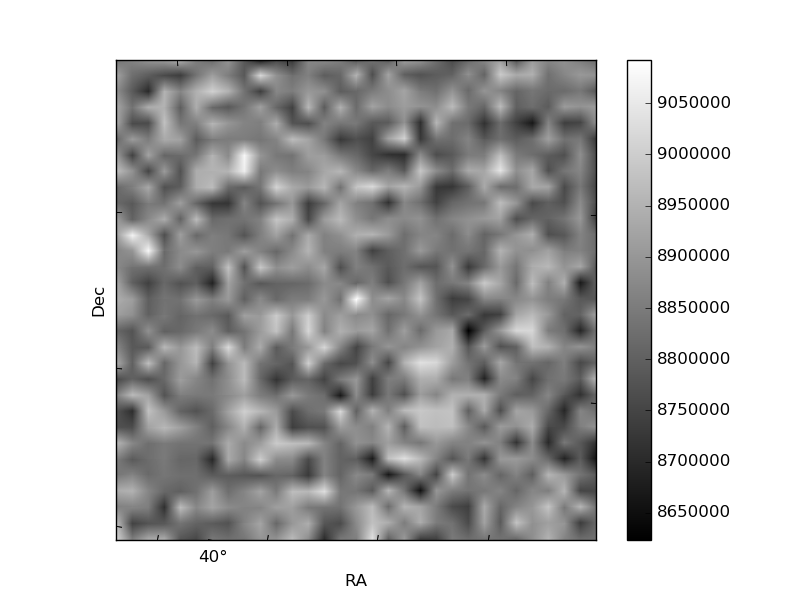
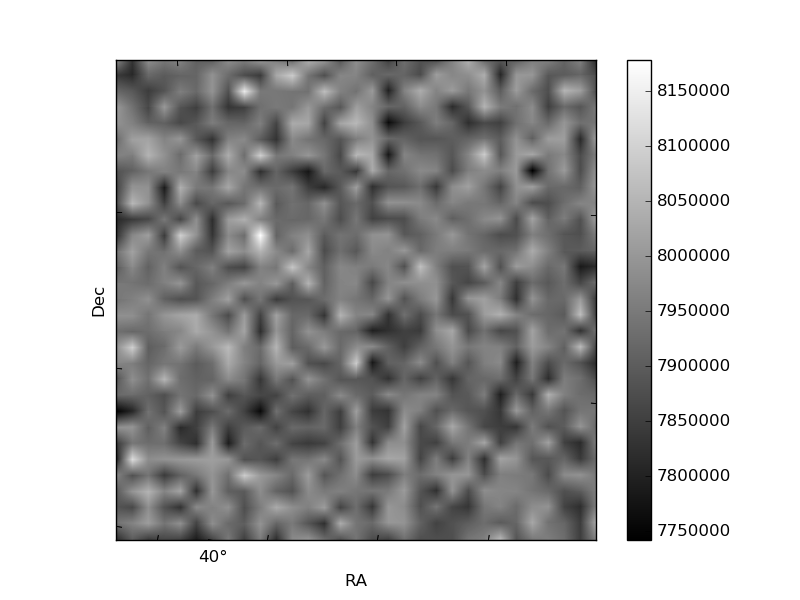
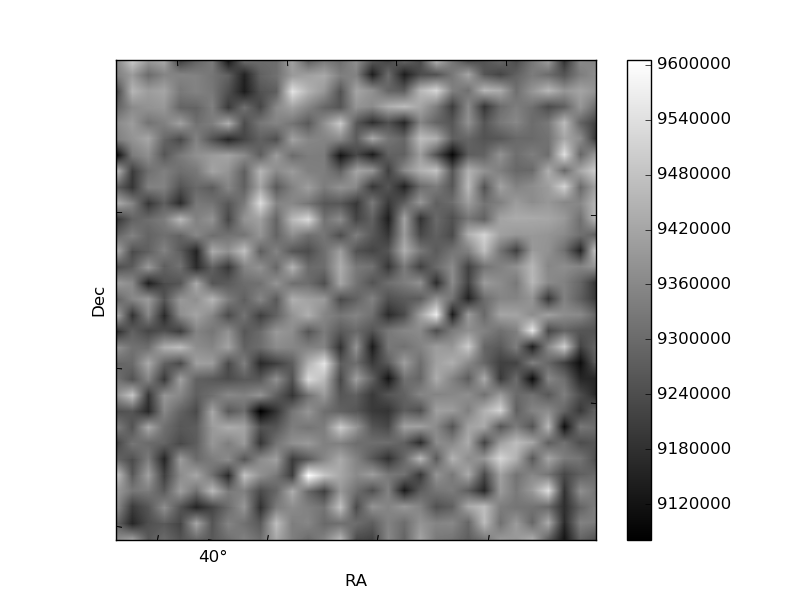
Histogram calculated using DETX and DETY for each event in the final _common_clean file
| Quadrant A | 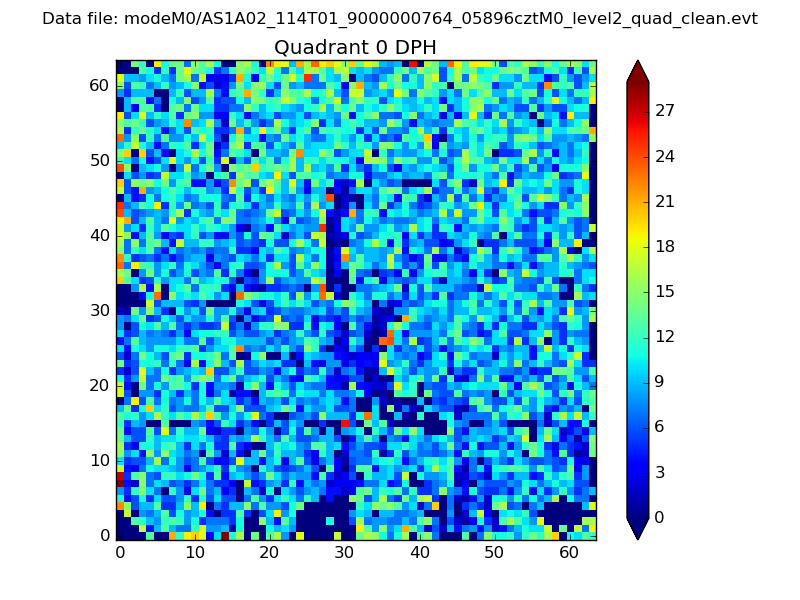 |
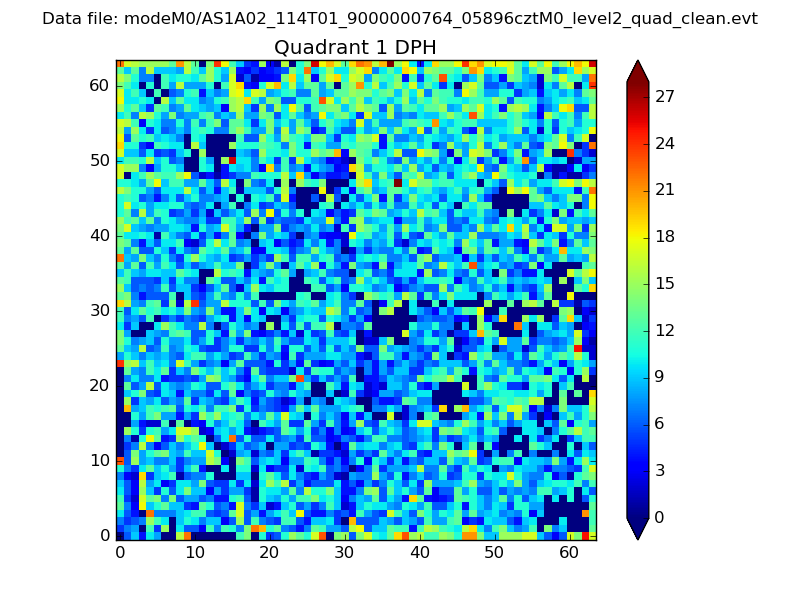 |
Quadrant B |
|---|---|---|---|
| Quadrant D | 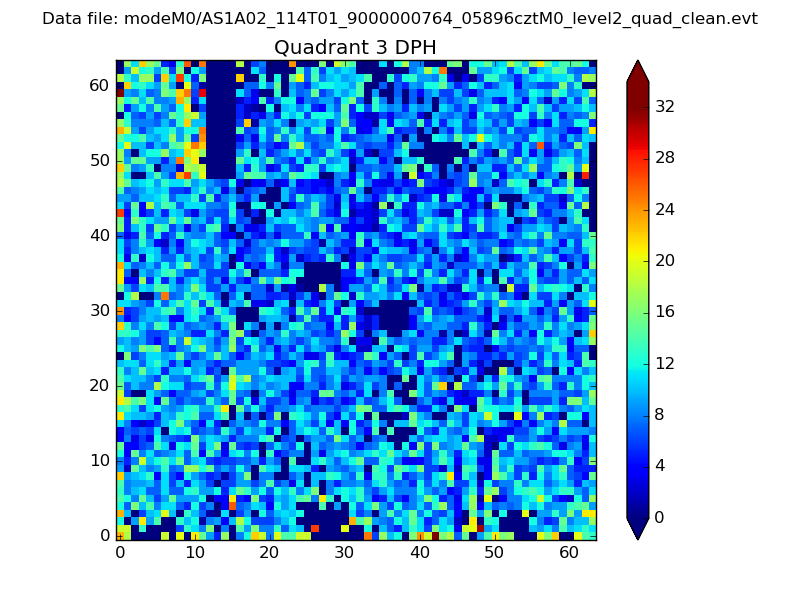 |
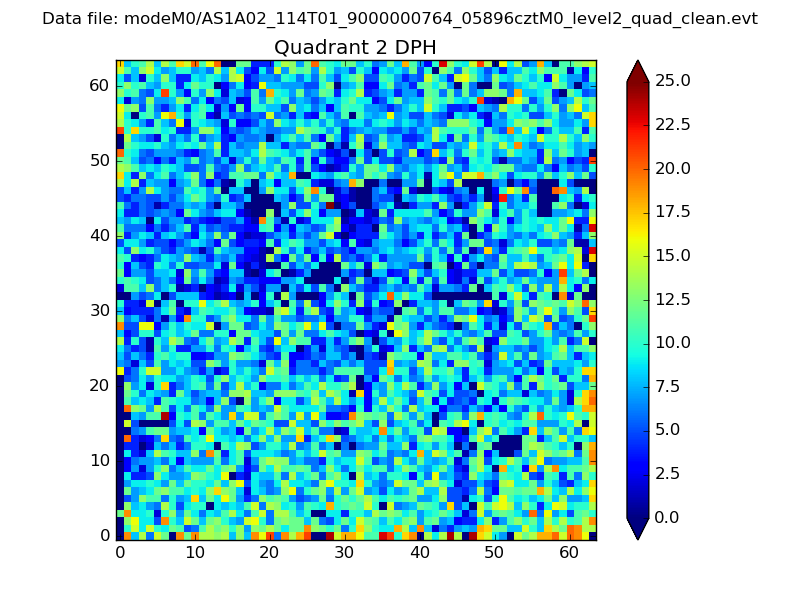 |
Quadrant C |
| Plot type | Count rate plots | Images |
|---|---|---|
| Comparison with Poisson distribution Blue bars denote a histogram of data divided into 1 sec bins. Red curve is a Poisson curve with rate = median count rate of data. |
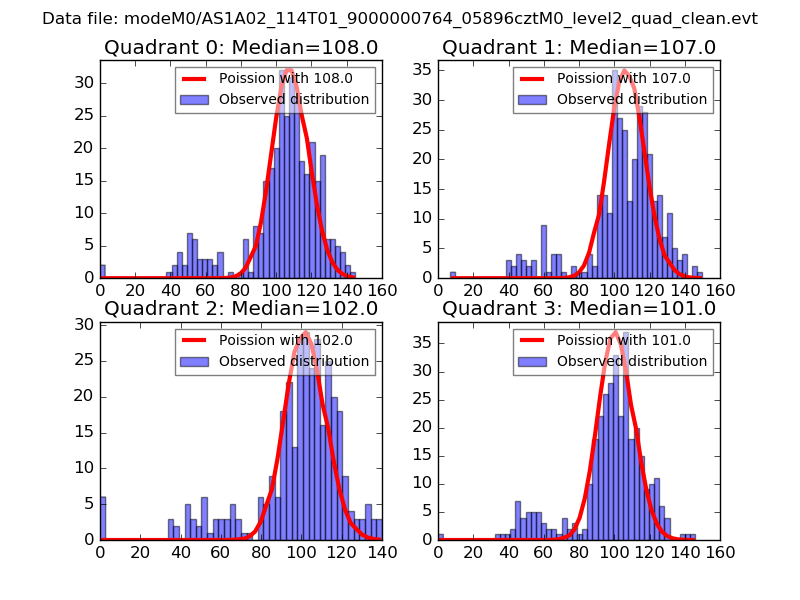 |
 |
| Quadrant-wise count rates Data is divided into 100 sec bins |
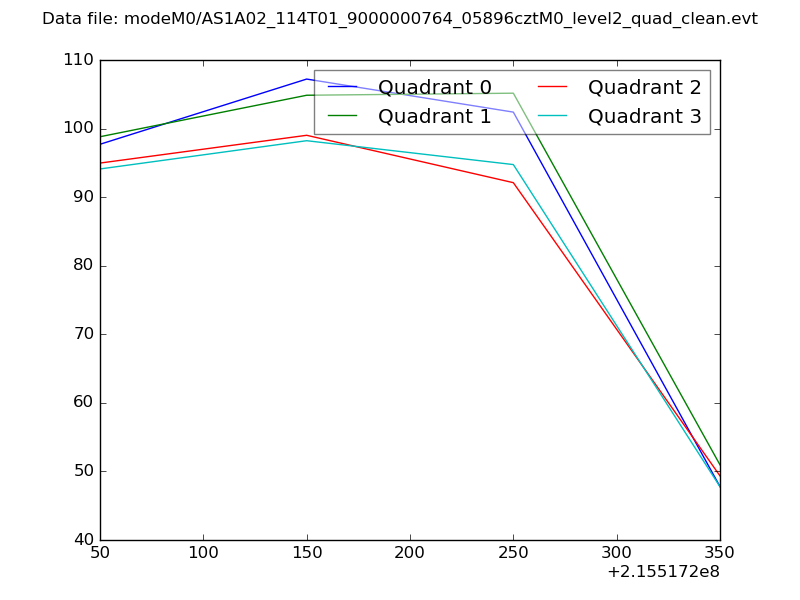 |
|
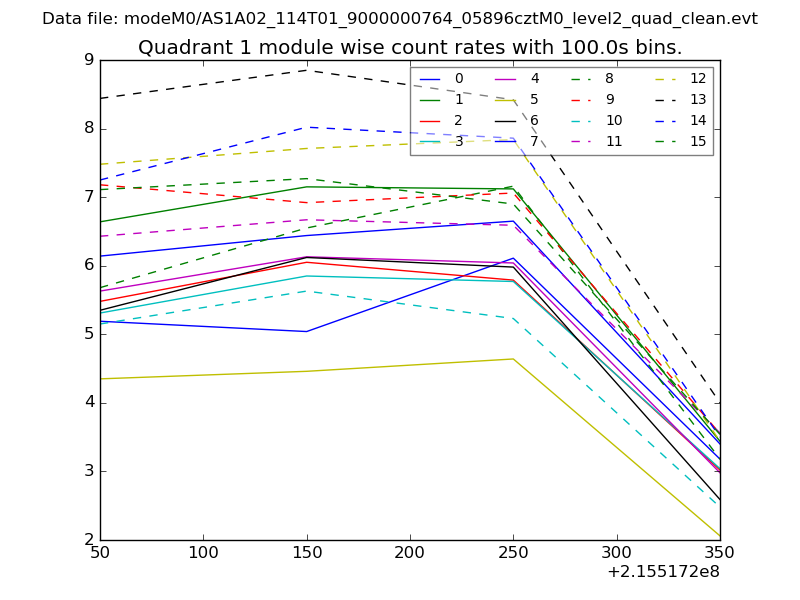
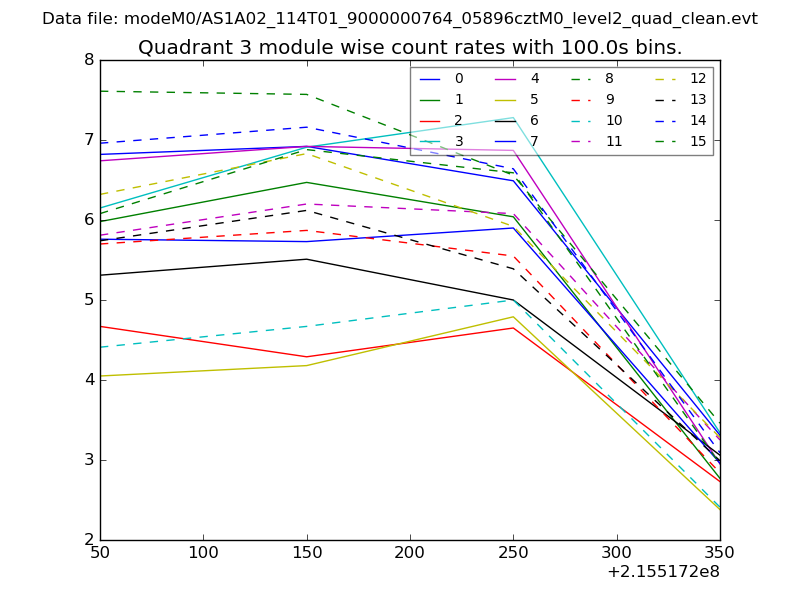
| Module-wise count rates for Quadrant A Data is divided into 100 sec bins |
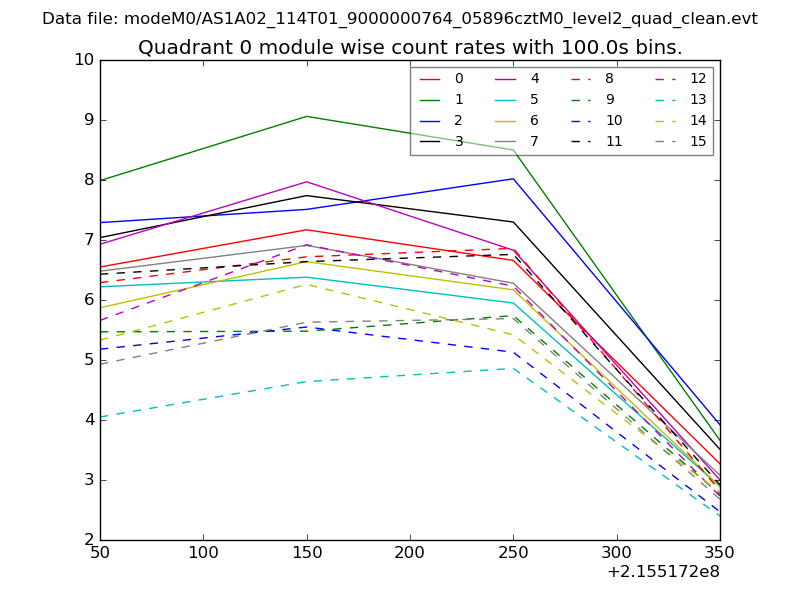 |
 |
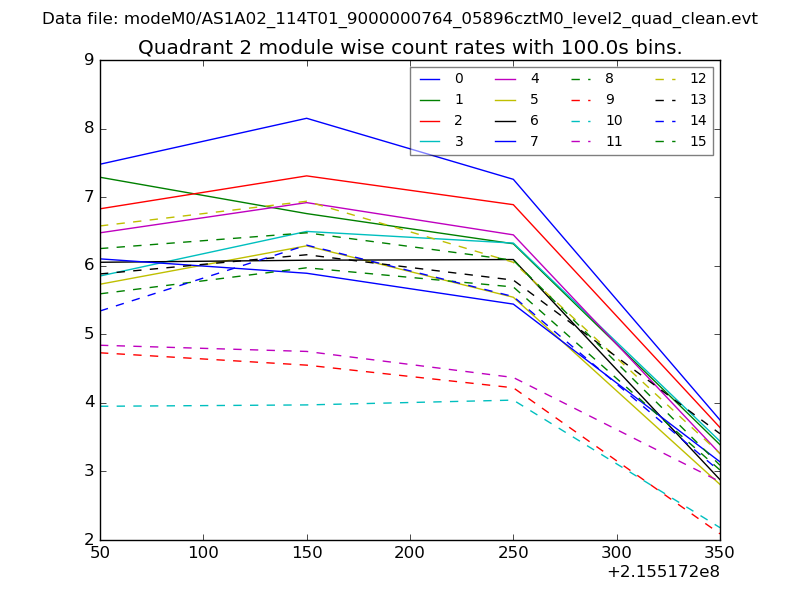
| Module-wise count rates for Quadrant B Data is divided into 100 sec bins |
 |
 |
| Module-wise count rates for Quadrant C Data is divided into 100 sec bins |
 |
 |
| Module-wise count rates for Quadrant D Data is divided into 100 sec bins |
 |
 |
| Parameter | Plot |
|---|---|
| CZT HV Monitor | 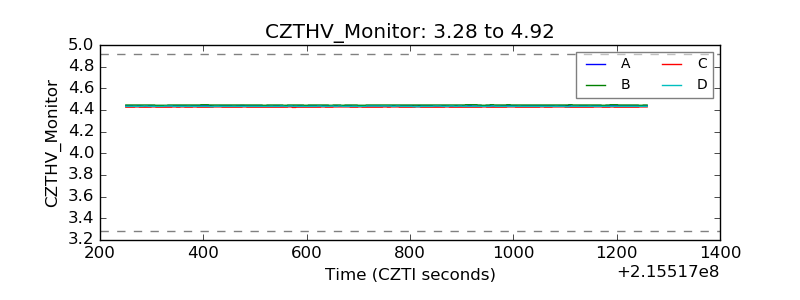 |
| D_VDD | 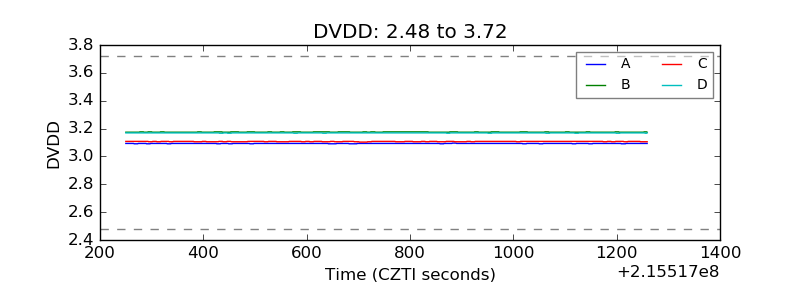 |
| Temperature 1 | 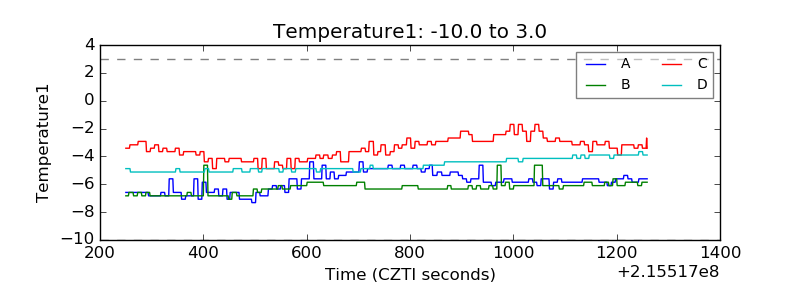 |
| Veto HV Monitor | 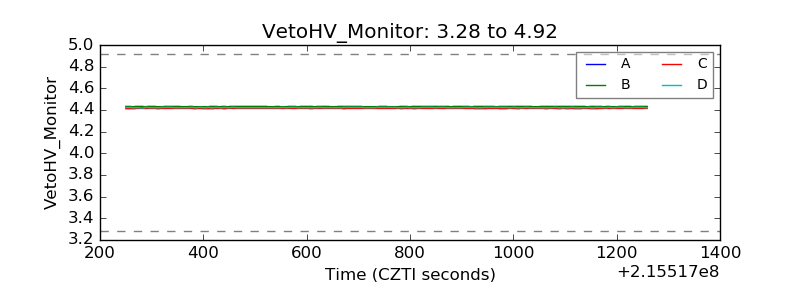 |
| Veto LLD | 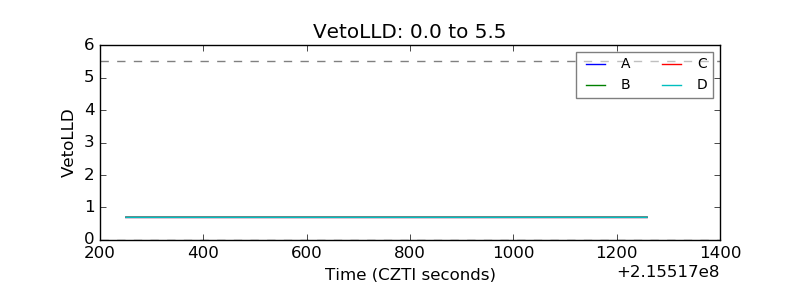 |
| Alpha Counter | 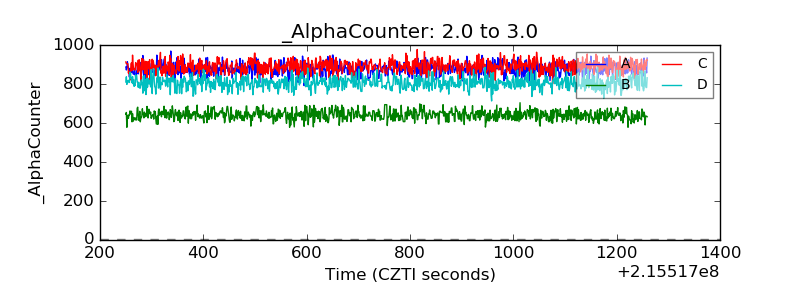 |
| _CPM_Rate | 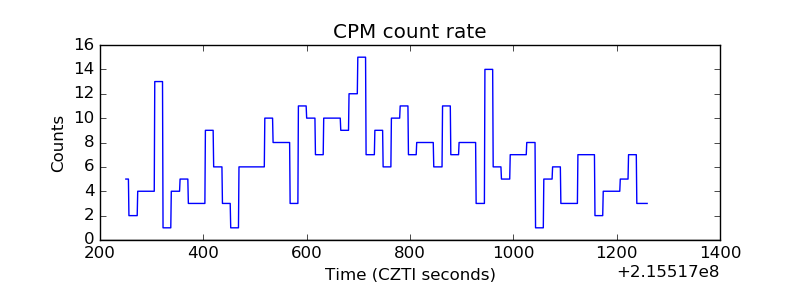 |
| CZT Counter | 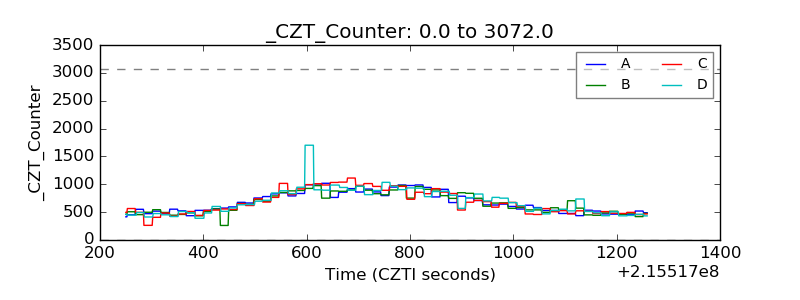 |
| +2.5 Volts monitor | 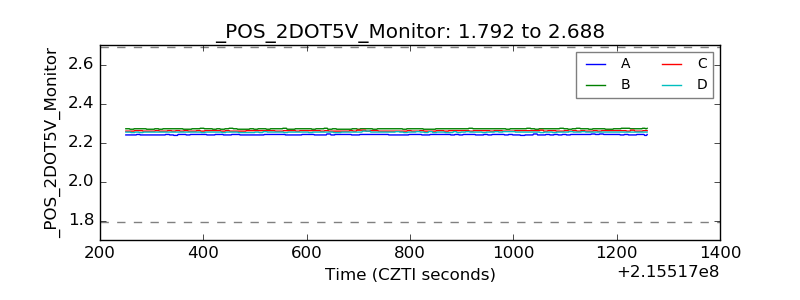 |
| +5 Volts monitor | 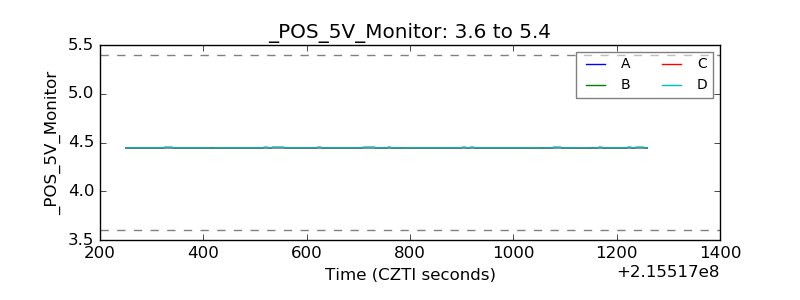 |
| _ROLL_ROT | 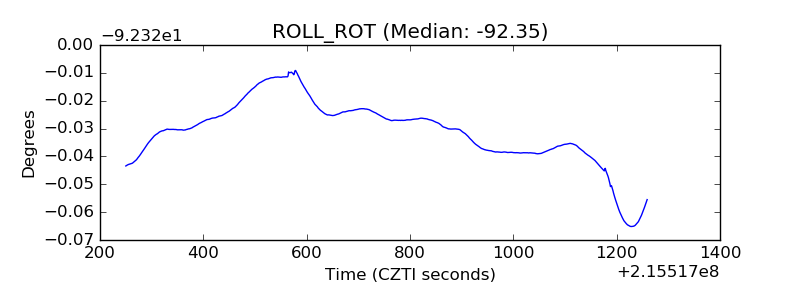 |
| _Roll_DEC | 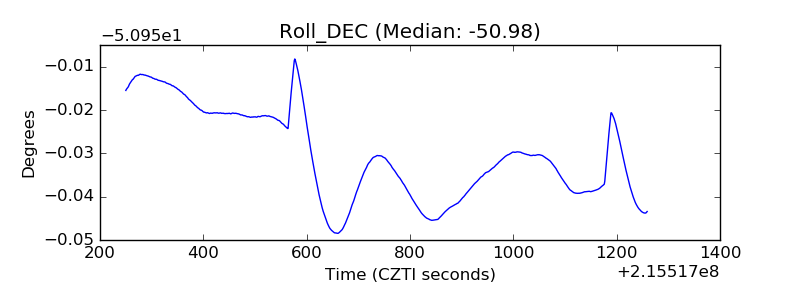 |
| _Roll_RA | 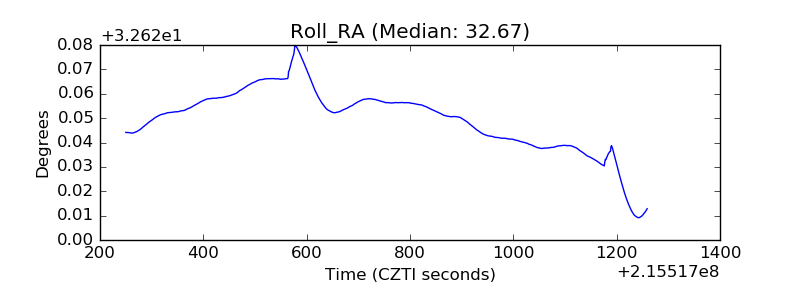 |
| Veto Counter | 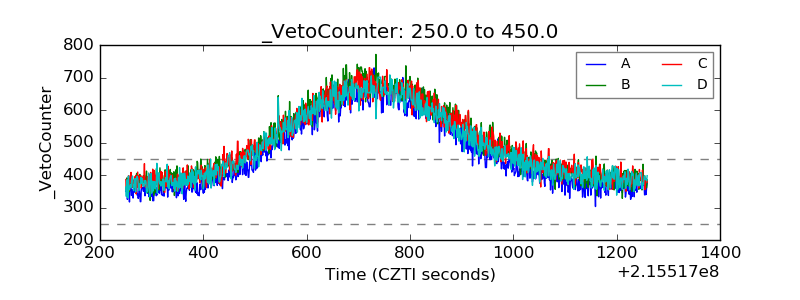 |