| Param | Original file | Final file |
|---|---|---|
| Filename | modeM0/AS1A02_114T01_9000000764_05902cztM0_level2.evt | modeM0/AS1A02_114T01_9000000764_05902cztM0_level2_quad_clean.evt |
| Size (bytes) | 565,931,520 | 97,277,760 |
| Size | 539.7 MB | 92.8 MB |
| Events in quadrant A | 4,469,595 | 588,654 |
| Events in quadrant B | 4,156,219 | 588,275 |
| Events in quadrant C | 3,866,153 | 576,995 |
| Events in quadrant D | 4,029,306 | 560,634 |
| Mode M9 | |||
|---|---|---|---|
| Quadrant | BADHDUFLAG | Total packets | Discarded packets |
| A | 0 | 17 | 0 |
| B | 0 | 16 | 0 |
| C | 0 | 16 | 0 |
| D | 0 | 16 | 0 |
| Mode SS | |||
|---|---|---|---|
| Quadrant | BADHDUFLAG | Total packets | Discarded packets |
| A | 0 | 186 | 0 |
| B | 0 | 186 | 0 |
| C | 0 | 186 | 0 |
| D | 0 | 186 | 0 |
| Mode M0 | |||
|---|---|---|---|
| Quadrant | BADHDUFLAG | Total packets | Discarded packets |
| A | 0 | 20148 | 1 |
| B | 0 | 18901 | 1 |
| C | 0 | 18393 | 1 |
| D | 0 | 19041 | 1 |
| Quadrant | Total seconds | Saturated seconds | Saturation percentage |
|---|---|---|---|
| A | 9098 | 168 | 1.846560% |
| B | 9098 | 51 | 0.560563% |
| C | 9098 | 30 | 0.329743% |
| D | 9098 | 55 | 0.604528% |
Noise dominated data is calculated using 1-second bins in cleaned event files. If a bin has >2000 counts, and if more than 50% of those come from <1% of pixels, then it is considered to be noise-dominated and hence unusable.
| Quadrant | # 1 sec bins | Bins with >0 counts | Bins with >2000 counts | High rate bins dominated by noise | Noise dominated (total time) | Noise dominated (detector-on time) | Marked lightcurve |
|---|---|---|---|---|---|---|---|
| A | 9853 | 9099 | 91 | 91 | 0.92% | 1.00% | 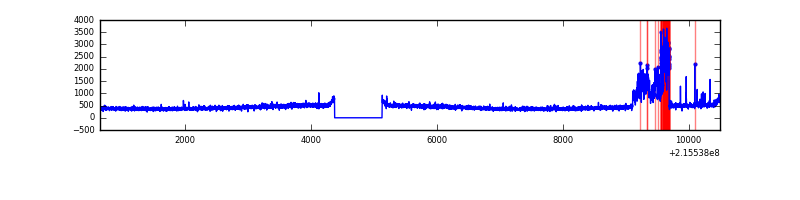 |
| B | 9853 | 9099 | 5 | 5 | 0.05% | 0.05% | 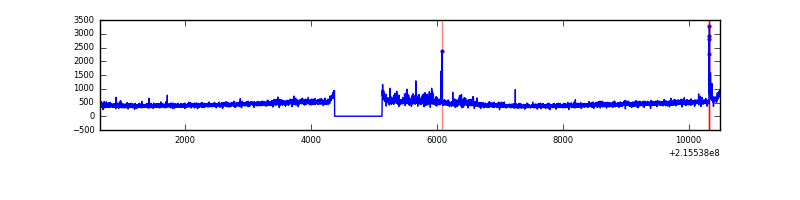 |
| C | 9853 | 9099 | 2 | 2 | 0.02% | 0.02% | 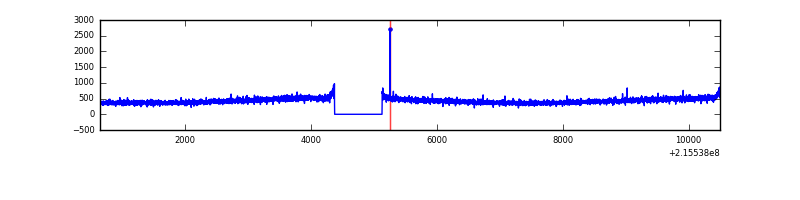 |
| D | 9853 | 9099 | 38 | 38 | 0.39% | 0.42% | 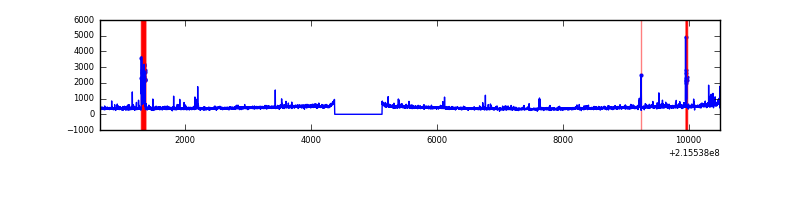 |
Top three noisy pixels from each quadrant. If the there are fewer than three noisy pixels in the level2.evt file, extra rows are filled as -1
| Pixel properties | Quadrant properties | ||||||
|---|---|---|---|---|---|---|---|
| Quadrant | DetID | PixID | Counts | Sigma | Mean | Median | Sigma |
| A | 15 | 236 | 614727 | 2975.78 | 998 | 975 | 206.2 |
| A | 0 | 226 | 9590 | 41.77 | 998 | 975 | 206.2 |
| A | 12 | 194 | 9476 | 41.22 | 998 | 975 | 206.2 |
| B | 15 | 204 | 117629 | 592.02 | 1020 | 992 | 197.0 |
| B | 10 | 252 | 34420 | 169.67 | 1020 | 992 | 197.0 |
| B | 0 | 219 | 21885 | 106.05 | 1020 | 992 | 197.0 |
| C | 14 | 67 | 15330 | 62.67 | 985 | 988 | 228.8 |
| C | 13 | 61 | 7704 | 29.35 | 985 | 988 | 228.8 |
| C | 12 | 4 | 6788 | 25.35 | 985 | 988 | 228.8 |
| D | 2 | 152 | 124833 | 515.37 | 977 | 947 | 240.4 |
| D | 12 | 233 | 113762 | 469.31 | 977 | 947 | 240.4 |
| D | 2 | 14 | 27399 | 110.04 | 977 | 947 | 240.4 |
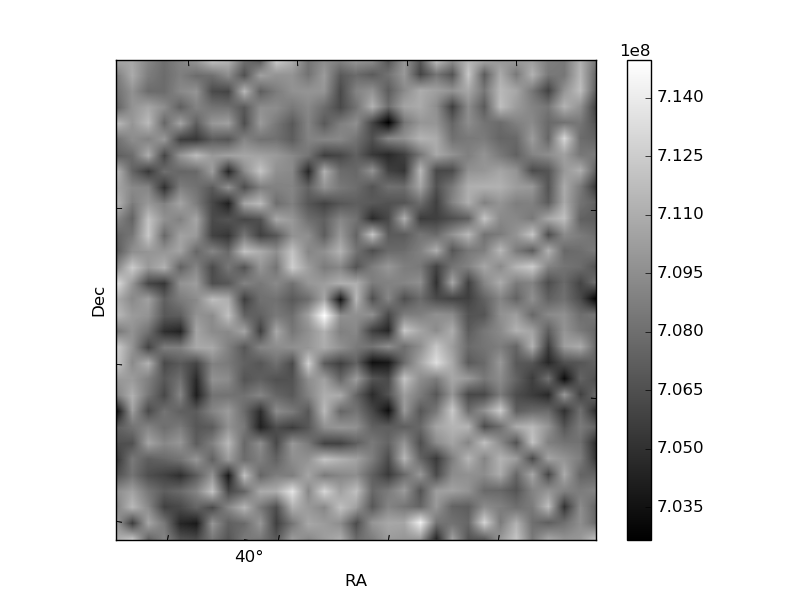
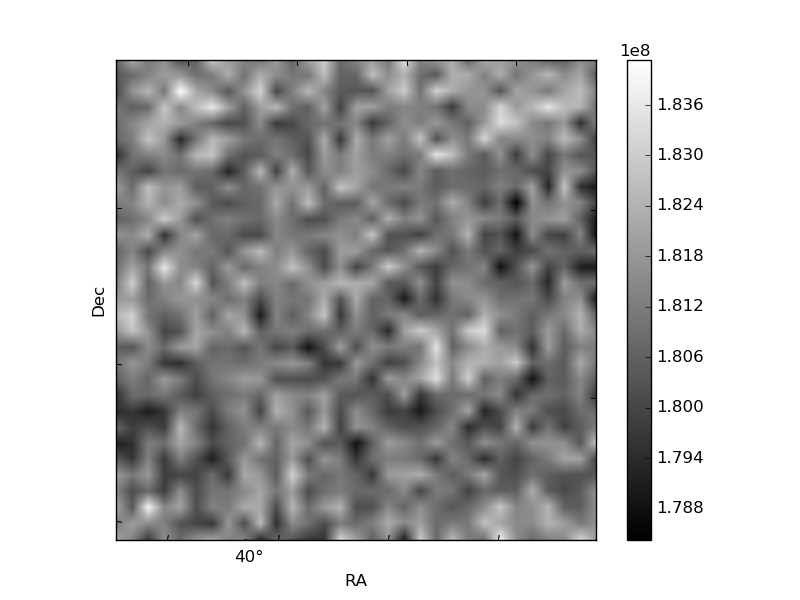
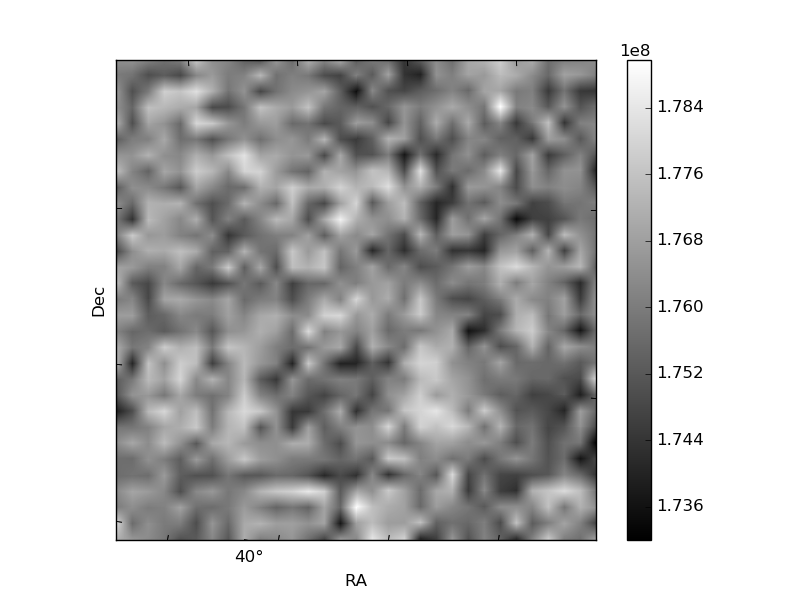
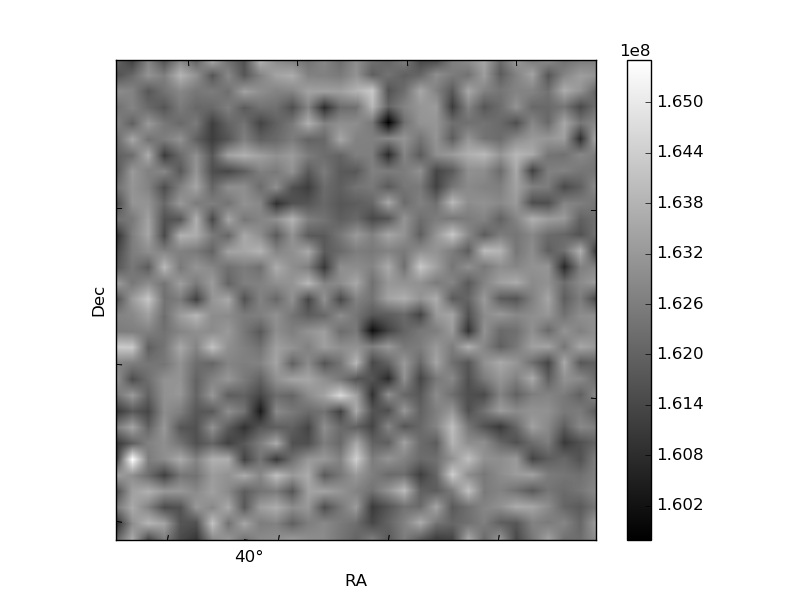
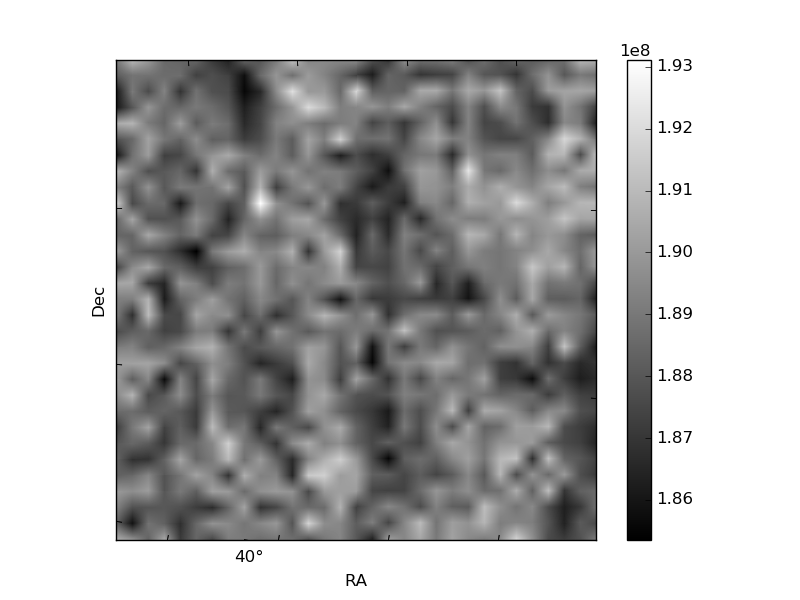
Histogram calculated using DETX and DETY for each event in the final _common_clean file
| Quadrant A | 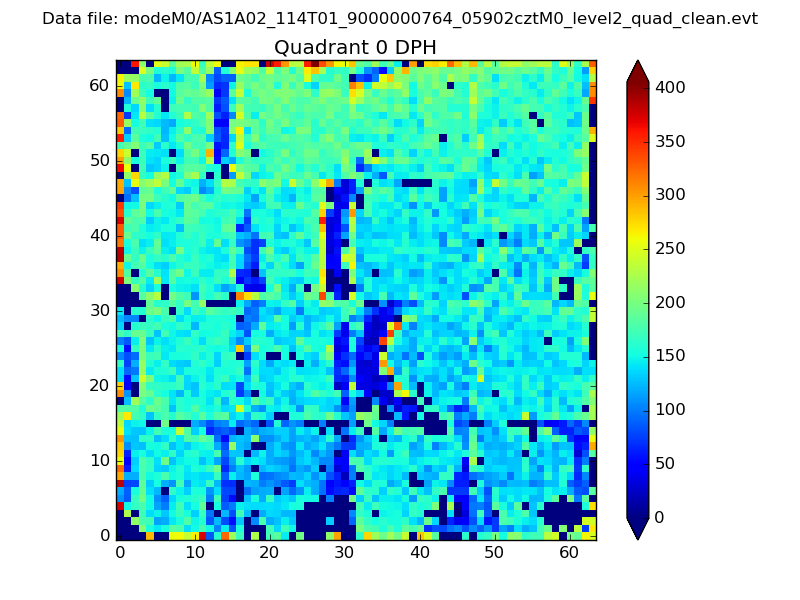 |
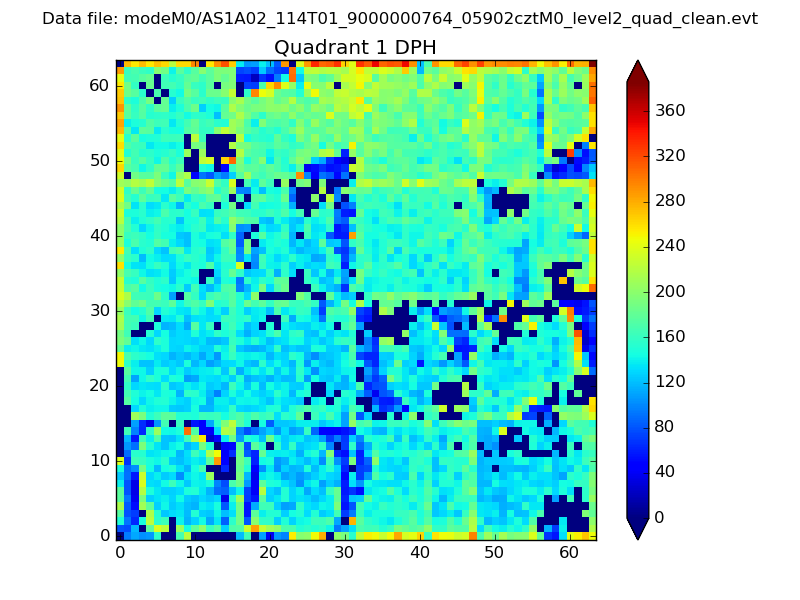 |
Quadrant B |
|---|---|---|---|
| Quadrant D | 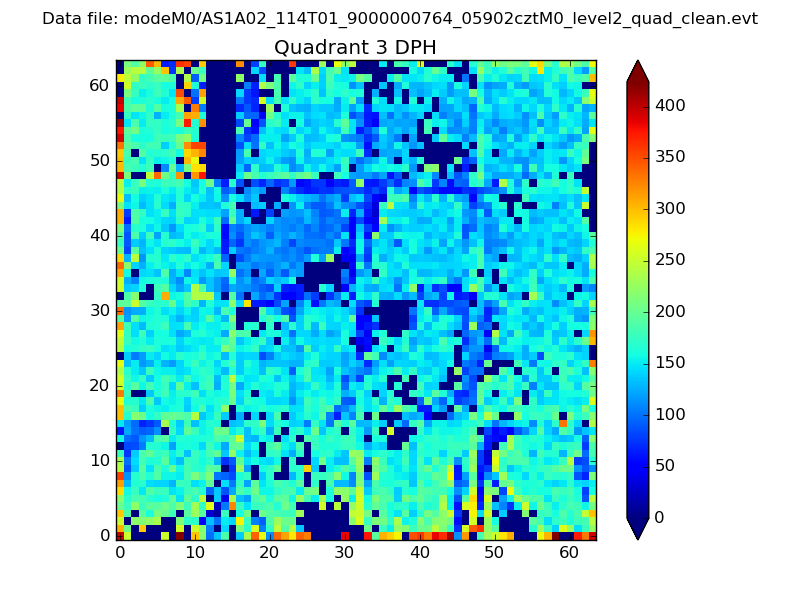 |
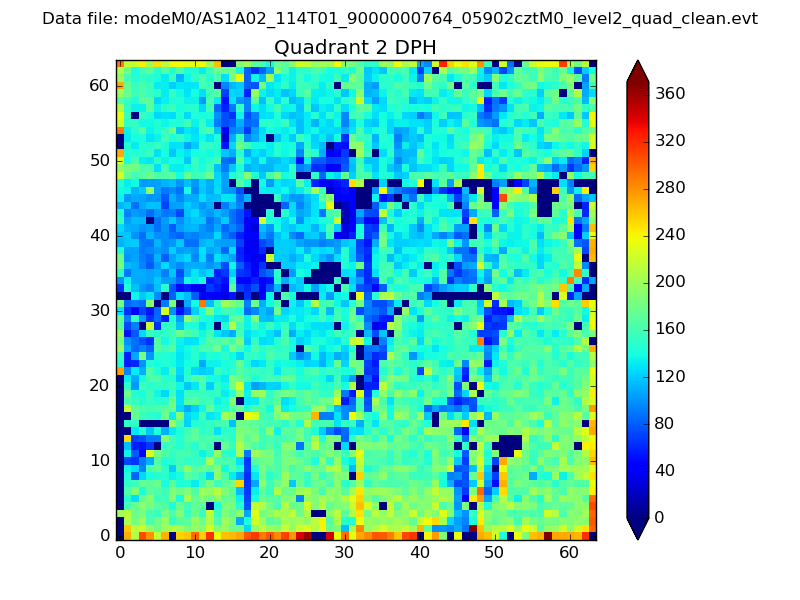 |
Quadrant C |
| Plot type | Count rate plots | Images |
|---|---|---|
| Comparison with Poisson distribution Blue bars denote a histogram of data divided into 1 sec bins. Red curve is a Poisson curve with rate = median count rate of data. |
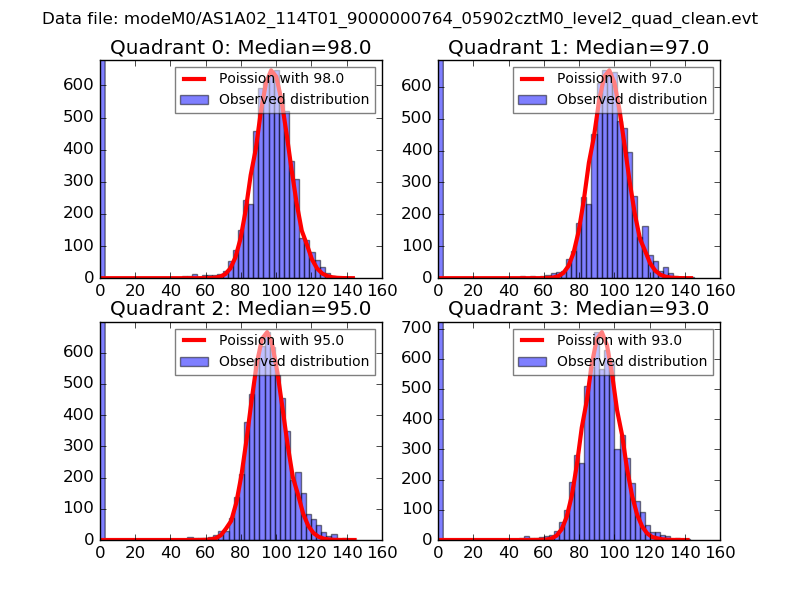 |
 |
| Quadrant-wise count rates Data is divided into 100 sec bins |
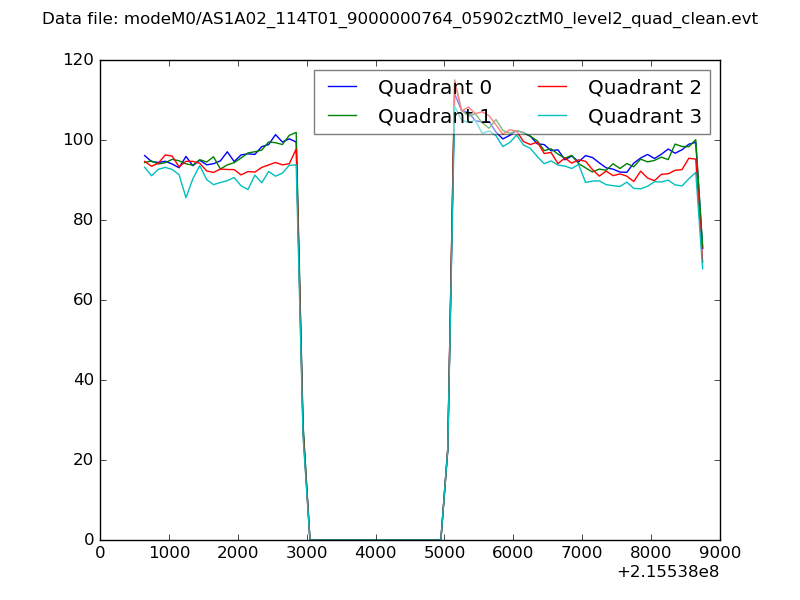 |
|
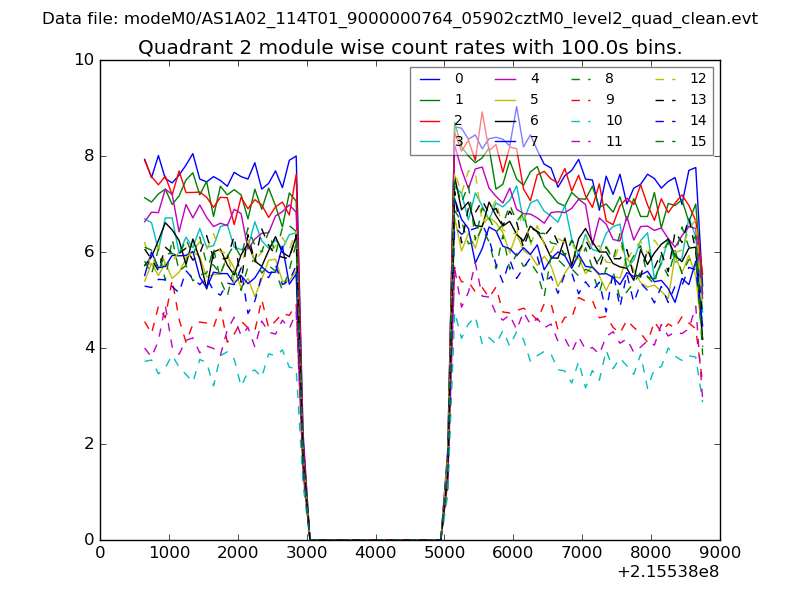
| Module-wise count rates for Quadrant A Data is divided into 100 sec bins |
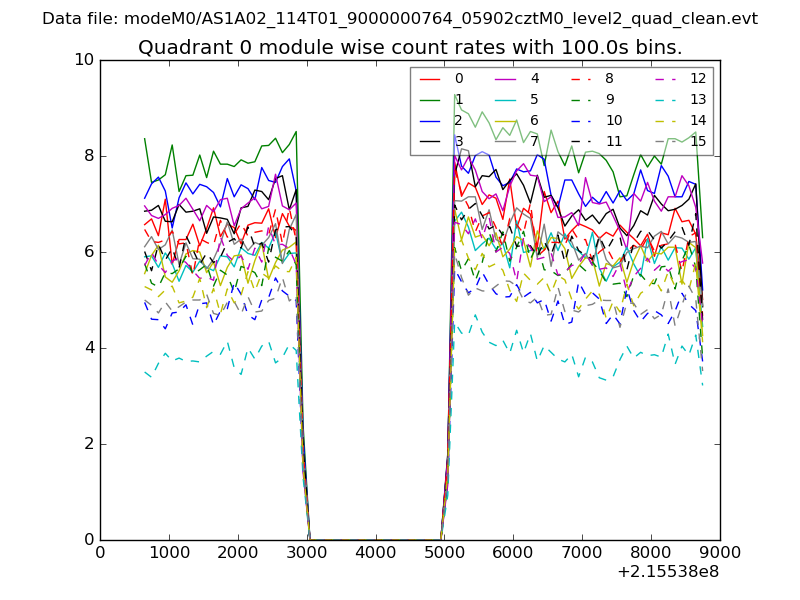 |
 |
| Module-wise count rates for Quadrant B Data is divided into 100 sec bins |
 |
 |
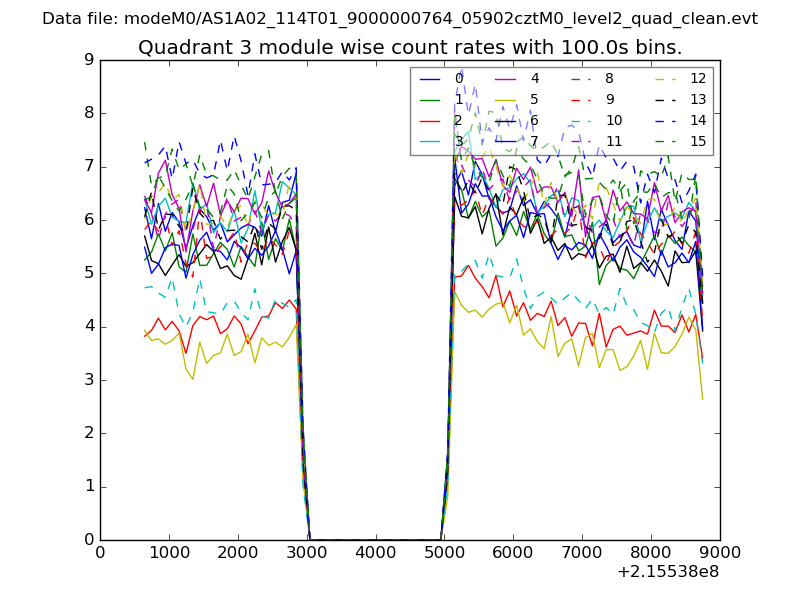
| Module-wise count rates for Quadrant C Data is divided into 100 sec bins |
 |
 |
| Module-wise count rates for Quadrant D Data is divided into 100 sec bins |
 |
 |
| Parameter | Plot |
|---|---|
| CZT HV Monitor | 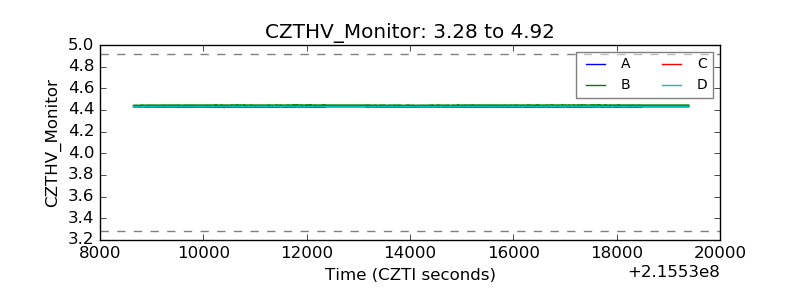 |
| D_VDD | 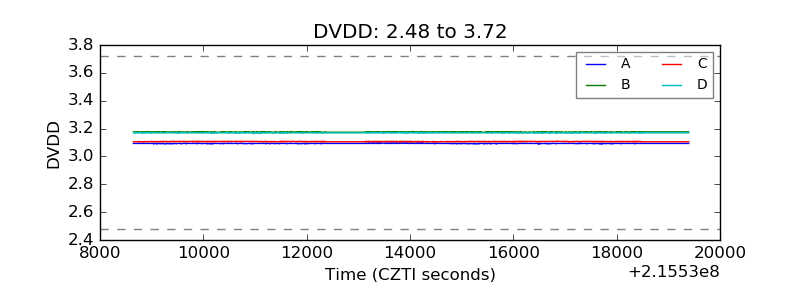 |
| Temperature 1 | 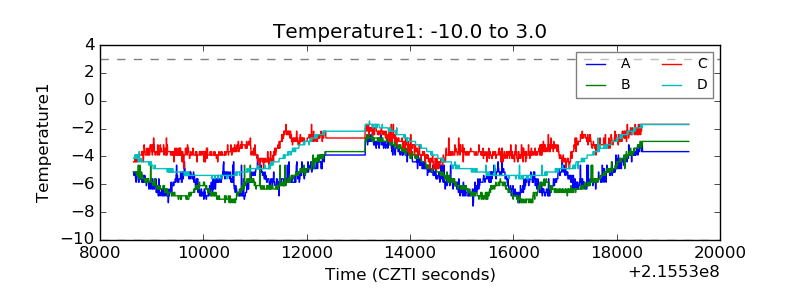 |
| Veto HV Monitor |  |
| Veto LLD | 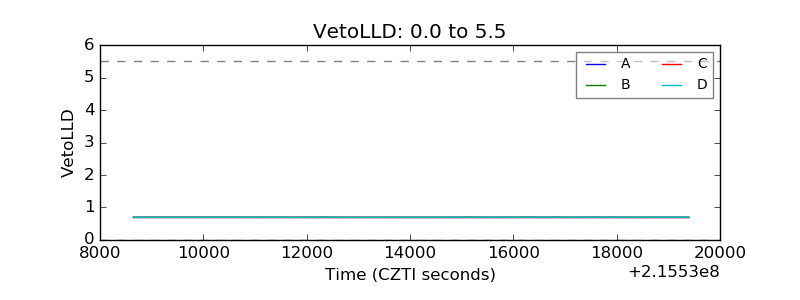 |
| Alpha Counter | 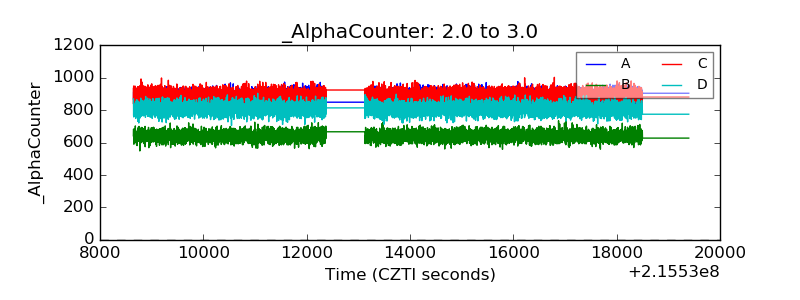 |
| _CPM_Rate | 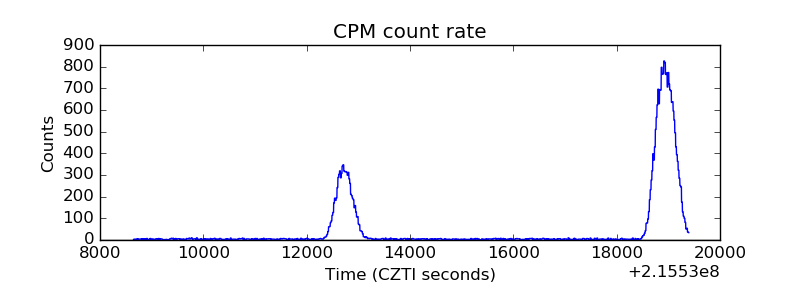 |
| CZT Counter | 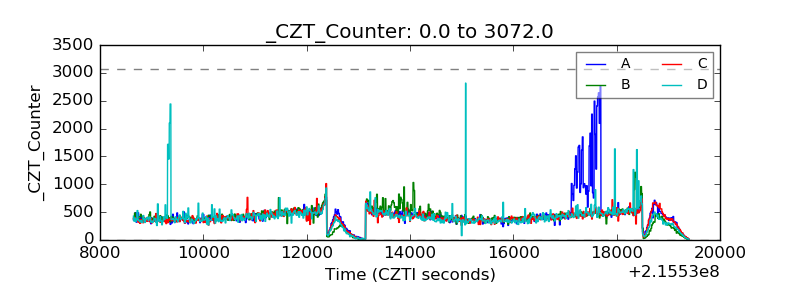 |
| +2.5 Volts monitor | 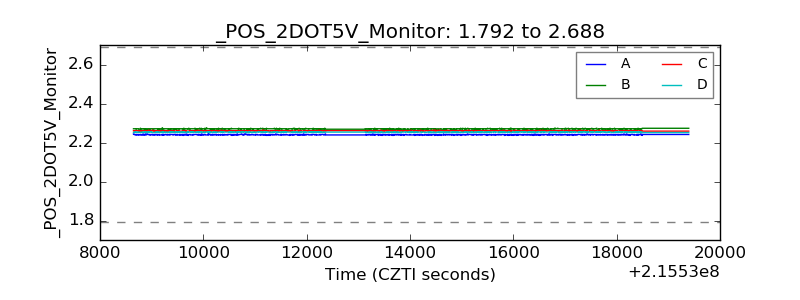 |
| +5 Volts monitor | 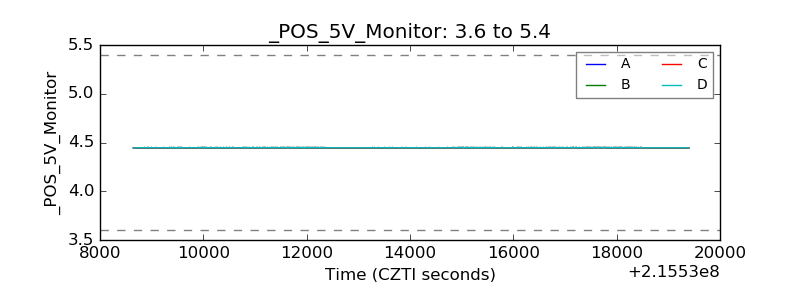 |
| _ROLL_ROT | 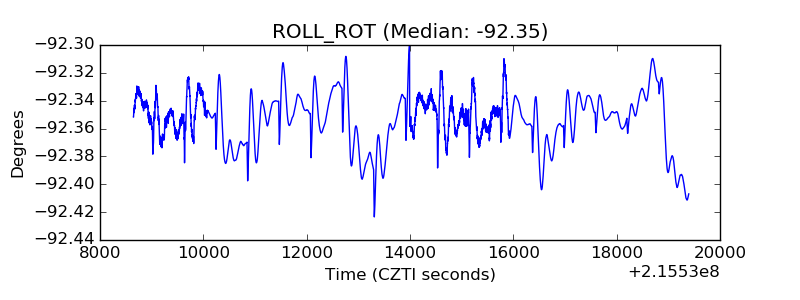 |
| _Roll_DEC | 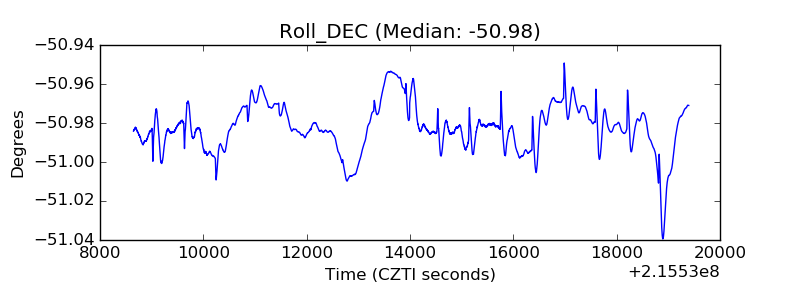 |
| _Roll_RA | 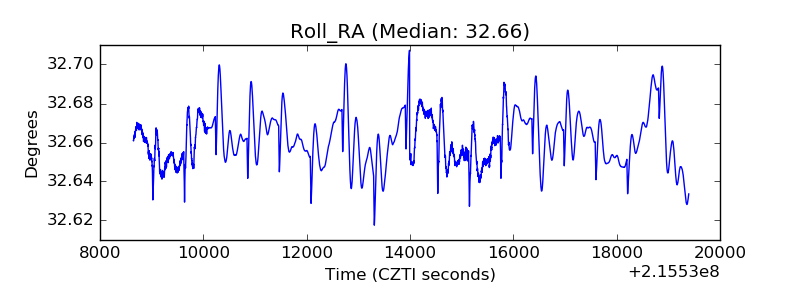 |
| Veto Counter | 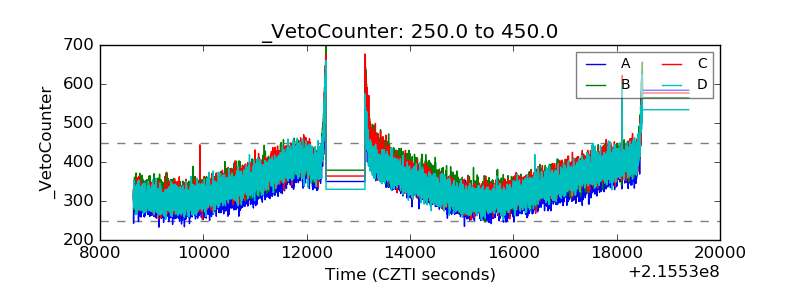 |