| Param | Original file | Final file |
|---|---|---|
| Filename | modeM0/AS1A02_174T01_9000000766_05903cztM0_level2.evt | modeM0/AS1A02_174T01_9000000766_05903cztM0_level2_quad_clean.evt |
| Size (bytes) | 228,677,760 | 41,163,840 |
| Size | 218.1 MB | 39.3 MB |
| Events in quadrant A | 1,658,392 | 250,436 |
| Events in quadrant B | 1,769,473 | 257,443 |
| Events in quadrant C | 1,609,099 | 250,581 |
| Events in quadrant D | 1,646,713 | 237,621 |
| Mode M9 | |||
|---|---|---|---|
| Quadrant | BADHDUFLAG | Total packets | Discarded packets |
| A | 0 | 13 | 0 |
| B | 0 | 13 | 0 |
| C | 0 | 13 | 0 |
| D | 0 | 13 | 0 |
| Mode M0 | |||
|---|---|---|---|
| Quadrant | BADHDUFLAG | Total packets | Discarded packets |
| A | 0 | 7286 | 2 |
| B | 0 | 7553 | 1 |
| C | 0 | 7189 | 1 |
| D | 0 | 7380 | 1 |
| Mode SS | |||
|---|---|---|---|
| Quadrant | BADHDUFLAG | Total packets | Discarded packets |
| A | 0 | 72 | 0 |
| B | 0 | 72 | 0 |
| C | 0 | 72 | 0 |
| D | 0 | 72 | 0 |
| Quadrant | Total seconds | Saturated seconds | Saturation percentage |
|---|---|---|---|
| A | 3531 | 23 | 0.651374% |
| B | 3531 | 13 | 0.368168% |
| C | 3531 | 4 | 0.113282% |
| D | 3531 | 8 | 0.226565% |
Noise dominated data is calculated using 1-second bins in cleaned event files. If a bin has >2000 counts, and if more than 50% of those come from <1% of pixels, then it is considered to be noise-dominated and hence unusable.
| Quadrant | # 1 sec bins | Bins with >0 counts | Bins with >2000 counts | High rate bins dominated by noise | Noise dominated (total time) | Noise dominated (detector-on time) | Marked lightcurve |
|---|---|---|---|---|---|---|---|
| A | 4736 | 3532 | 11 | 11 | 0.23% | 0.31% | 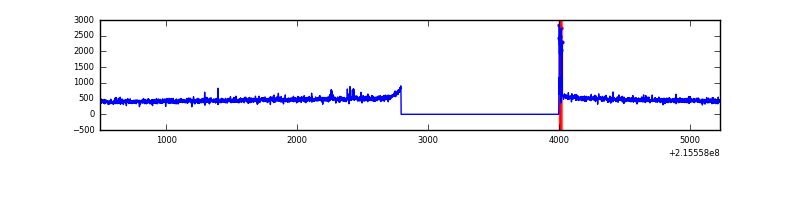 |
| B | 4736 | 3532 | 3 | 3 | 0.06% | 0.08% | 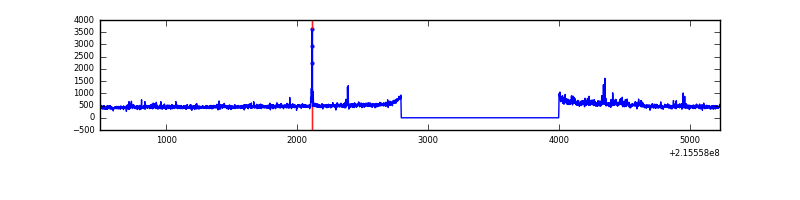 |
| C | 4736 | 3532 | 0 | 0 | 0.00% | 0.00% |  |
| D | 4736 | 3532 | 1 | 1 | 0.02% | 0.03% | 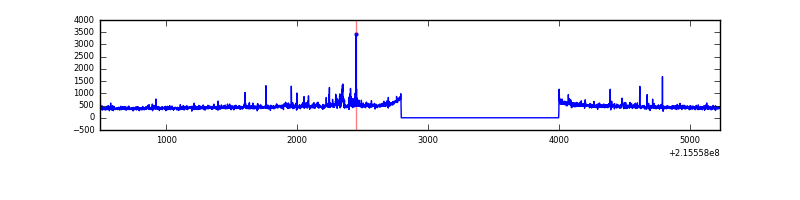 |
Top three noisy pixels from each quadrant. If the there are fewer than three noisy pixels in the level2.evt file, extra rows are filled as -1
| Pixel properties | Quadrant properties | ||||||
|---|---|---|---|---|---|---|---|
| Quadrant | DetID | PixID | Counts | Sigma | Mean | Median | Sigma |
| A | 15 | 234 | 38627 | 434.7 | 420 | 409 | 87.9 |
| A | 12 | 194 | 4084 | 41.8 | 420 | 409 | 87.9 |
| A | 0 | 226 | 4075 | 41.7 | 420 | 409 | 87.9 |
| B | 15 | 204 | 34039 | 402.67 | 427 | 416 | 83.5 |
| B | 4 | 80 | 24025 | 282.74 | 427 | 416 | 83.5 |
| B | 0 | 198 | 15932 | 185.82 | 427 | 416 | 83.5 |
| C | 1 | 16 | 3794 | 35.28 | 410 | 412 | 95.8 |
| C | 13 | 61 | 3238 | 29.48 | 410 | 412 | 95.8 |
| C | 8 | 222 | 1794 | 14.42 | 410 | 412 | 95.8 |
| D | 2 | 152 | 69507 | 687.23 | 408 | 396 | 100.6 |
| D | 1 | 20 | 9076 | 86.31 | 408 | 396 | 100.6 |
| D | 8 | 195 | 5992 | 55.65 | 408 | 396 | 100.6 |
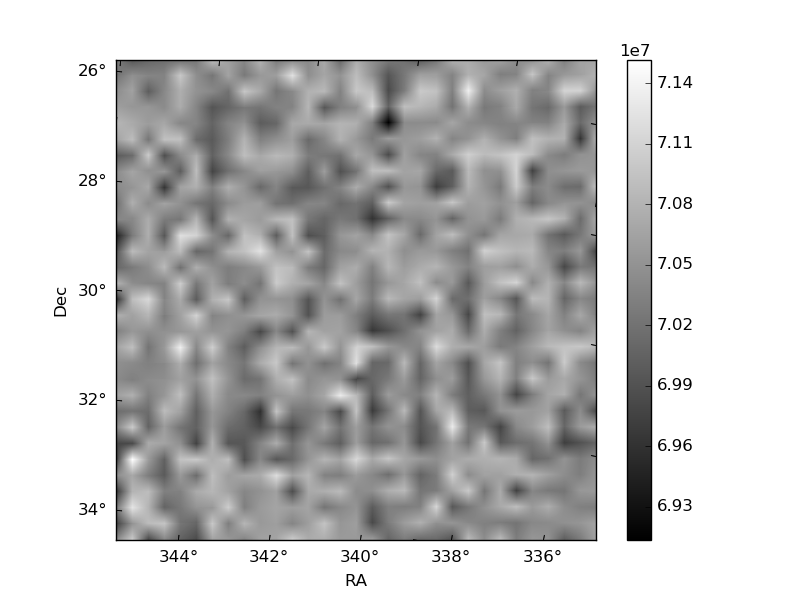
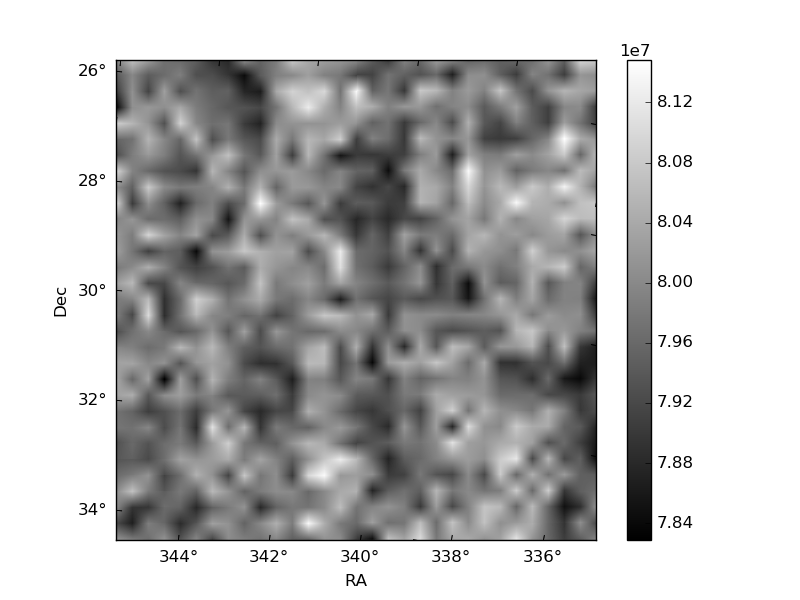
Histogram calculated using DETX and DETY for each event in the final _common_clean file
| Quadrant A | 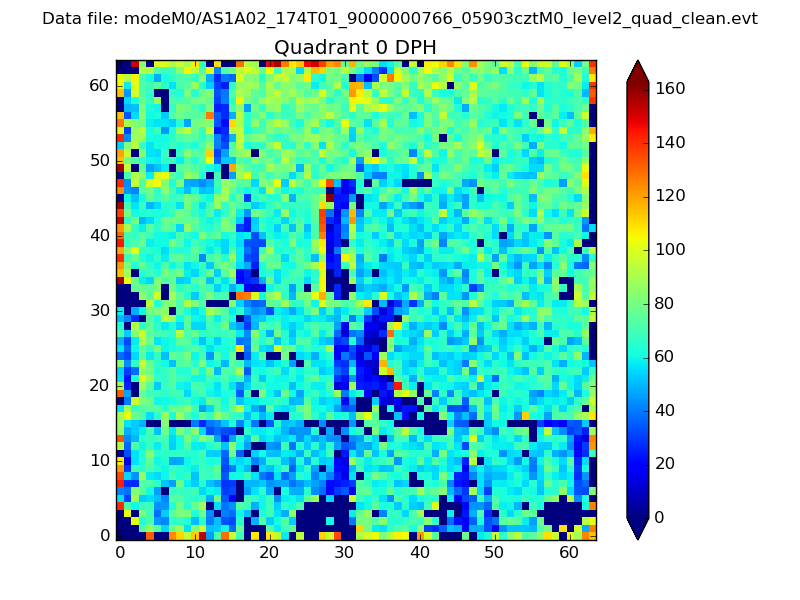 |
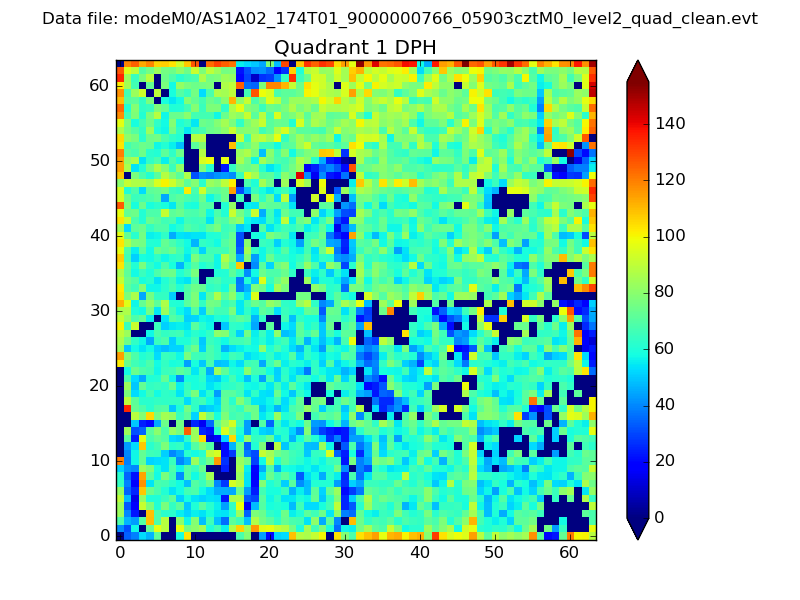 |
Quadrant B |
|---|---|---|---|
| Quadrant D | 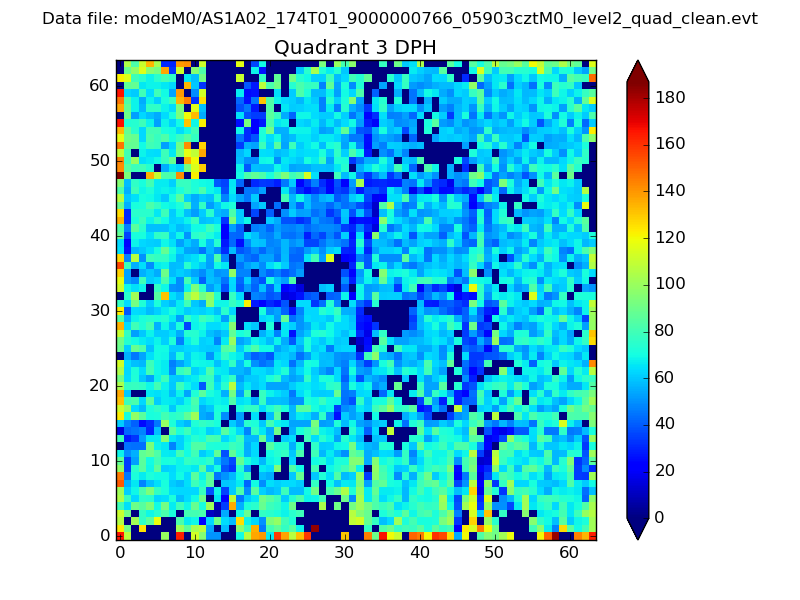 |
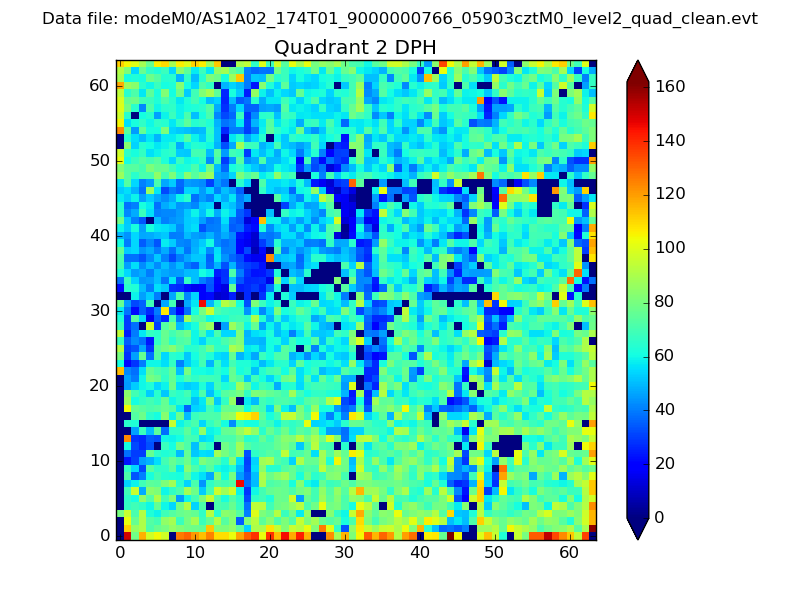 |
Quadrant C |
| Plot type | Count rate plots | Images |
|---|---|---|
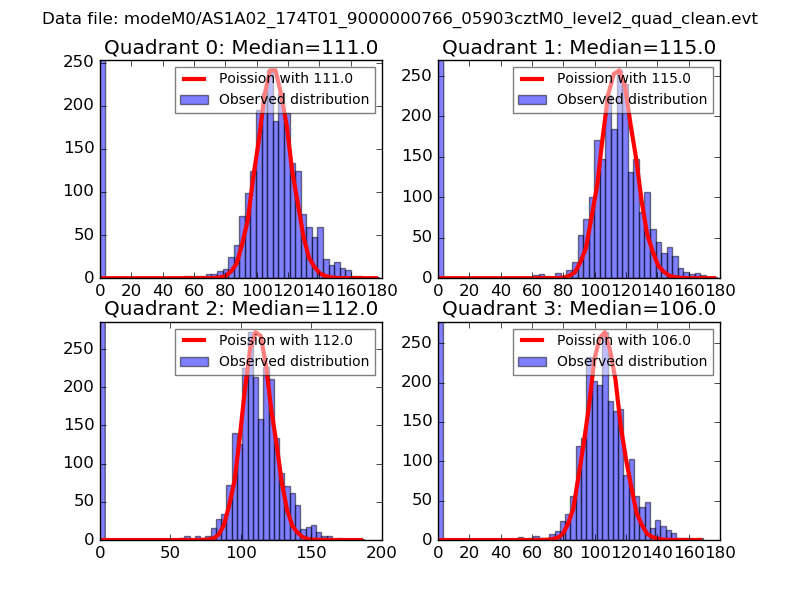
| Comparison with Poisson distribution Blue bars denote a histogram of data divided into 1 sec bins. Red curve is a Poisson curve with rate = median count rate of data. |
 |
 |
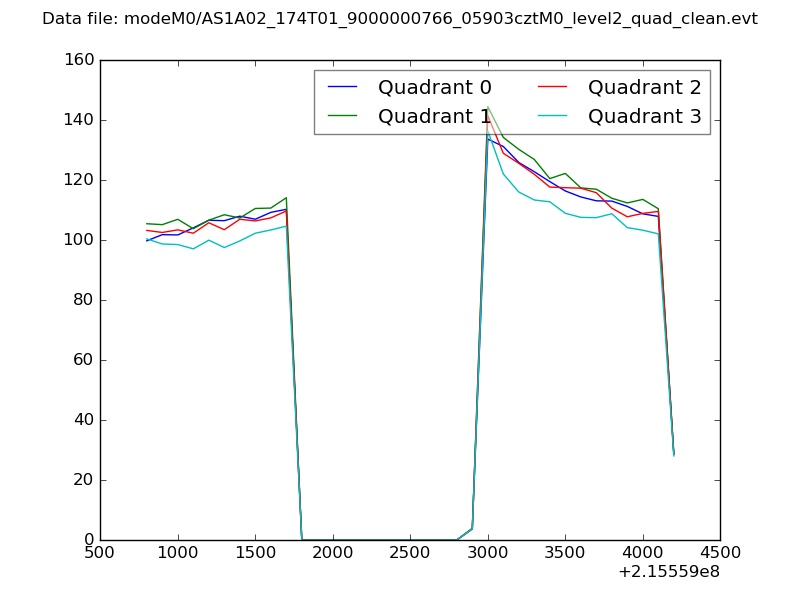
| Quadrant-wise count rates Data is divided into 100 sec bins |
 |
|
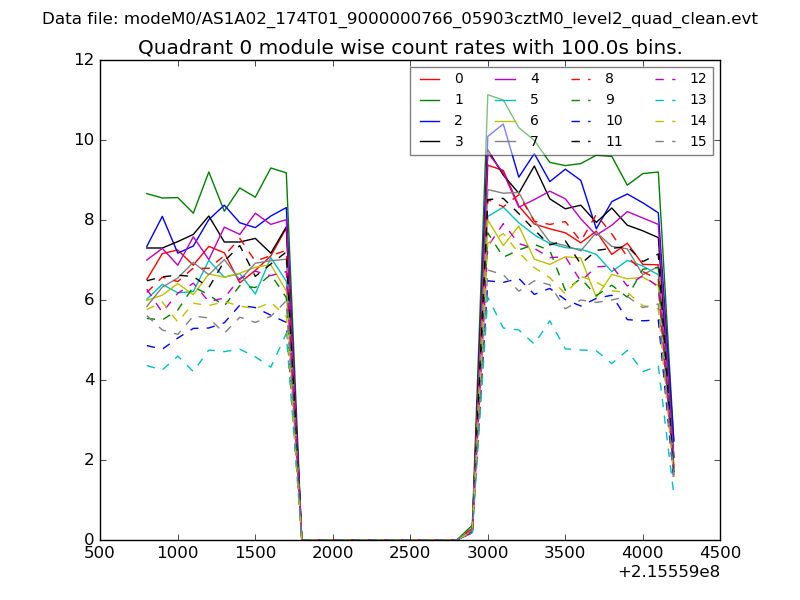
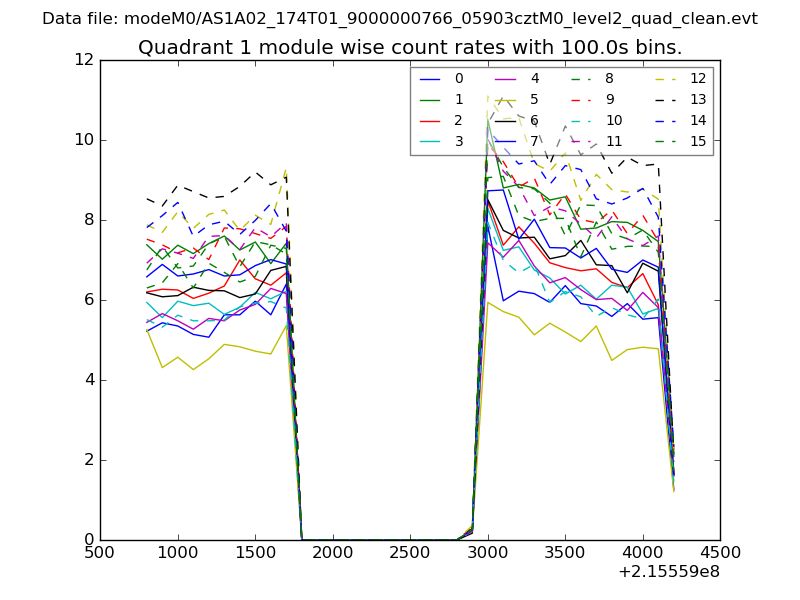
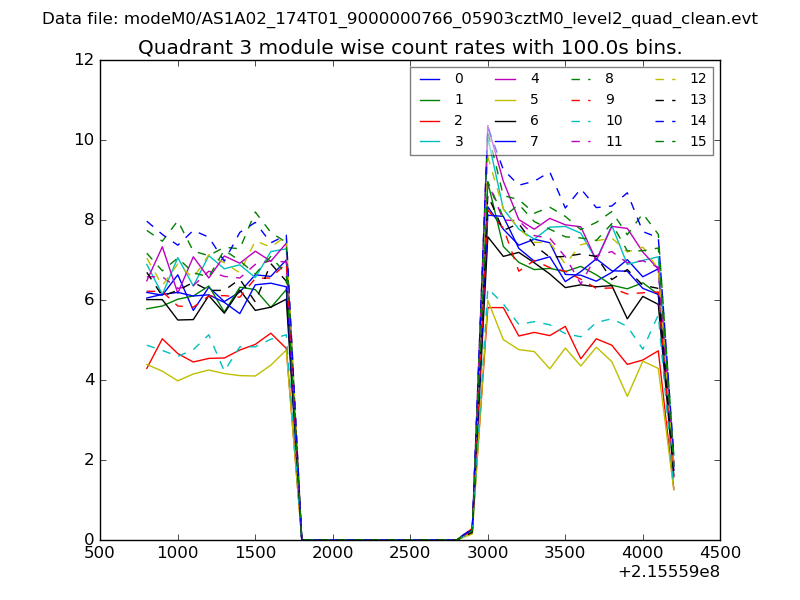
| Module-wise count rates for Quadrant A Data is divided into 100 sec bins |
 |
 |
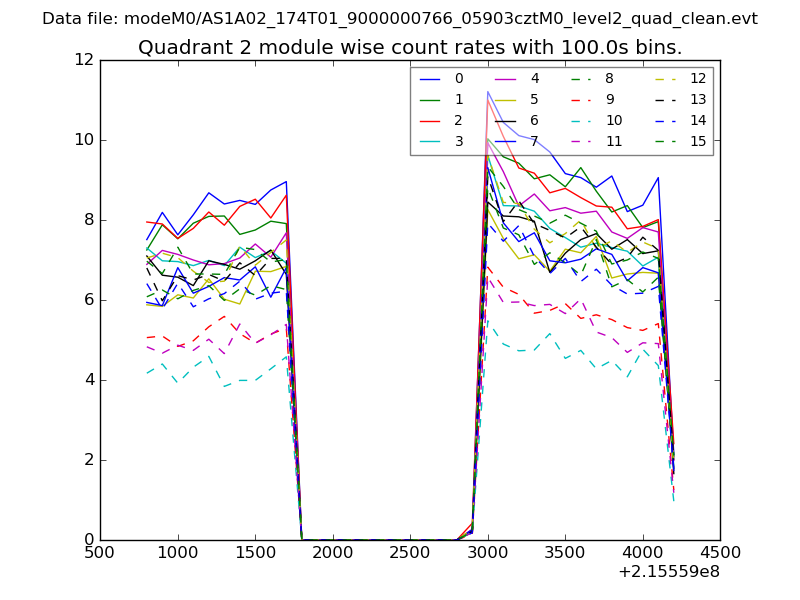
| Module-wise count rates for Quadrant B Data is divided into 100 sec bins |
 |
 |
| Module-wise count rates for Quadrant C Data is divided into 100 sec bins |
 |
 |
| Module-wise count rates for Quadrant D Data is divided into 100 sec bins |
 |
 |
| Parameter | Plot |
|---|---|
| CZT HV Monitor | 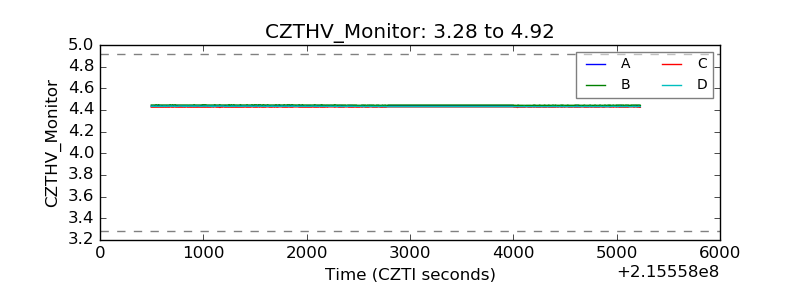 |
| D_VDD | 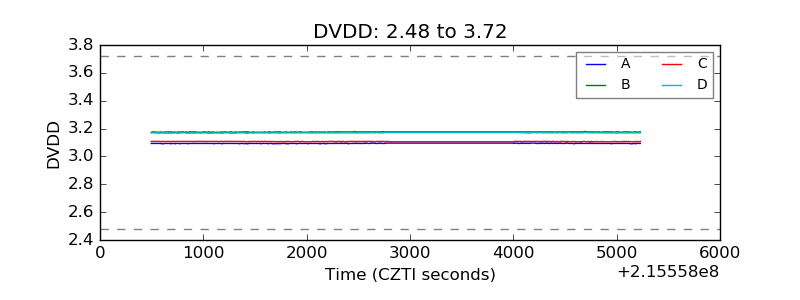 |
| Temperature 1 |  |
| Veto HV Monitor | 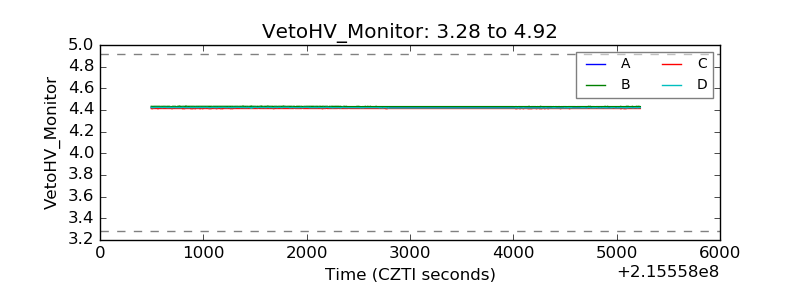 |
| Veto LLD | 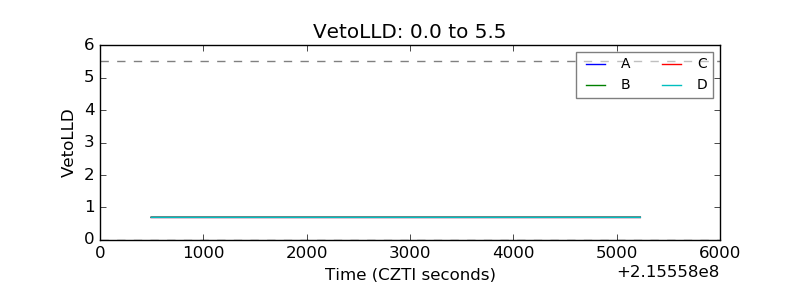 |
| Alpha Counter | 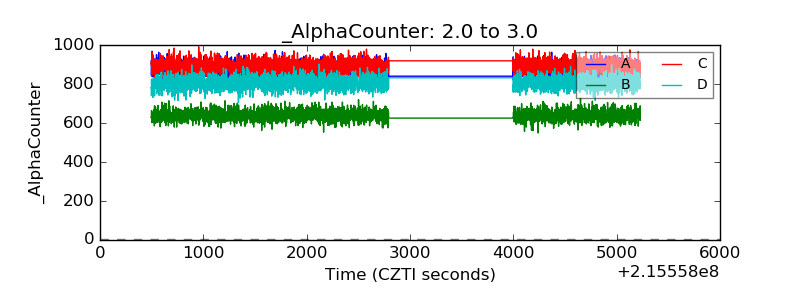 |
| _CPM_Rate | 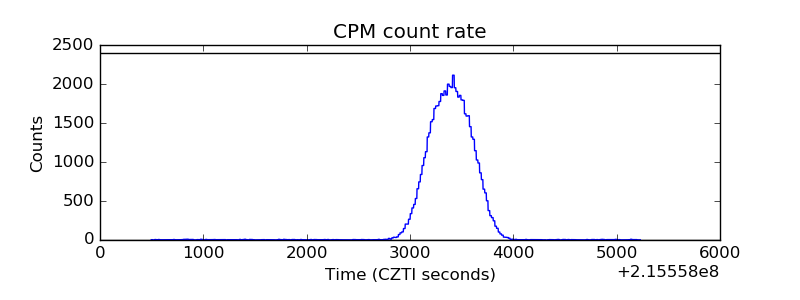 |
| CZT Counter | 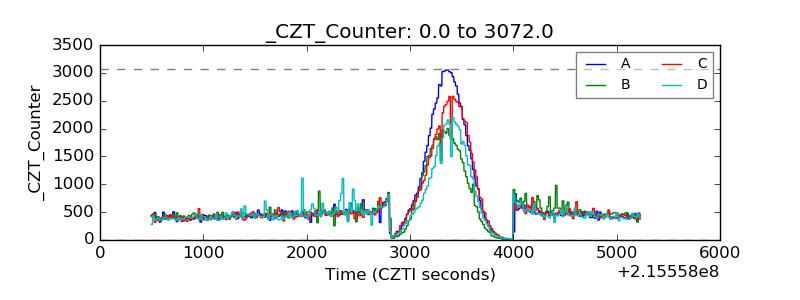 |
| +2.5 Volts monitor | 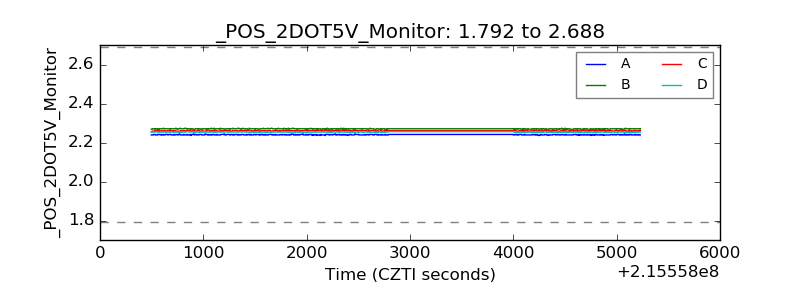 |
| +5 Volts monitor | 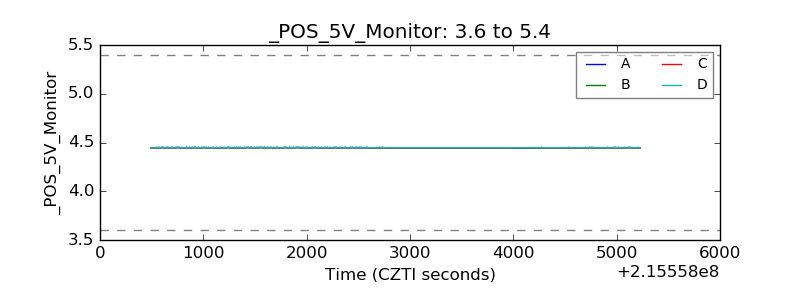 |
| _ROLL_ROT | 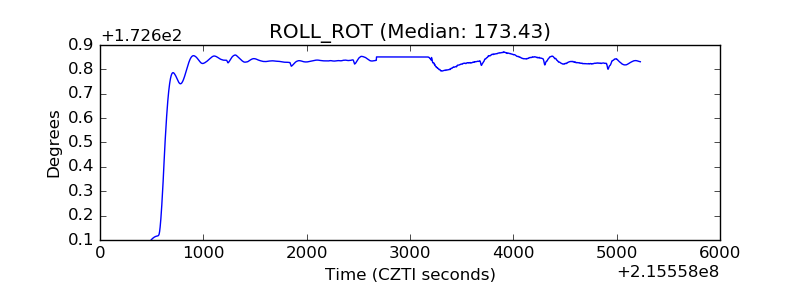 |
| _Roll_DEC | 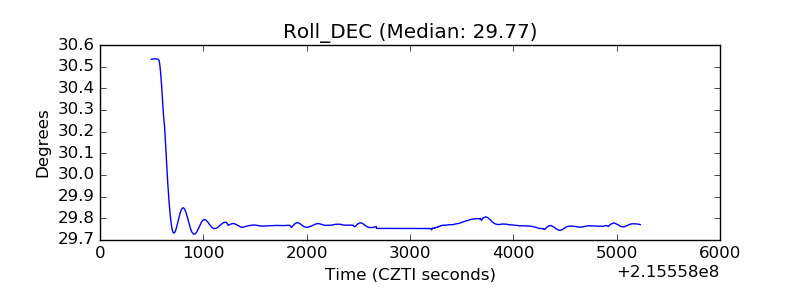 |
| _Roll_RA | 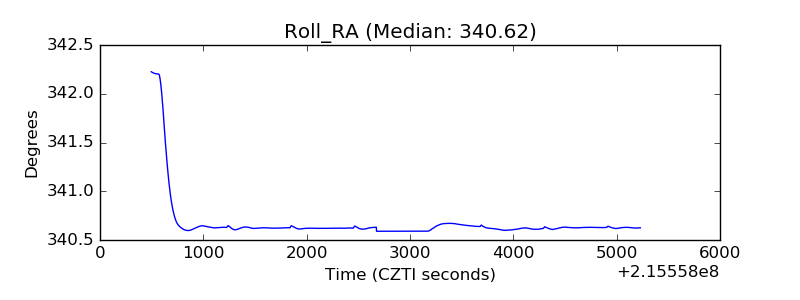 |
| Veto Counter | 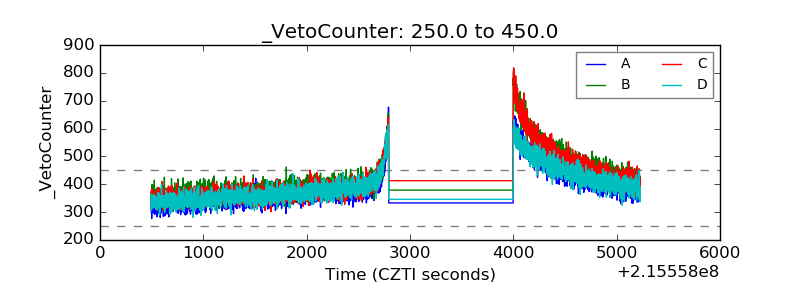 |