| Param | Original file | Final file |
|---|---|---|
| Filename | modeM0/AS1A02_174T01_9000000766_05904cztM0_level2.evt | modeM0/AS1A02_174T01_9000000766_05904cztM0_level2_quad_clean.evt |
| Size (bytes) | 401,538,240 | 73,497,600 |
| Size | 382.9 MB | 70.1 MB |
| Events in quadrant A | 2,855,338 | 452,180 |
| Events in quadrant B | 3,020,849 | 465,739 |
| Events in quadrant C | 2,794,022 | 452,228 |
| Events in quadrant D | 3,069,203 | 423,228 |
| Mode M9 | |||
|---|---|---|---|
| Quadrant | BADHDUFLAG | Total packets | Discarded packets |
| A | 0 | 22 | 0 |
| B | 0 | 22 | 0 |
| C | 0 | 22 | 0 |
| D | 0 | 23 | 0 |
| Mode M0 | |||
|---|---|---|---|
| Quadrant | BADHDUFLAG | Total packets | Discarded packets |
| A | 0 | 12753 | 3 |
| B | 0 | 13119 | 2 |
| C | 0 | 12619 | 2 |
| D | 0 | 13556 | 2 |
| Mode SS | |||
|---|---|---|---|
| Quadrant | BADHDUFLAG | Total packets | Discarded packets |
| A | 0 | 124 | 0 |
| B | 0 | 124 | 0 |
| C | 0 | 124 | 0 |
| D | 0 | 124 | 0 |
| Quadrant | Total seconds | Saturated seconds | Saturation percentage |
|---|---|---|---|
| A | 6196 | 38 | 0.613299% |
| B | 6196 | 26 | 0.419626% |
| C | 6196 | 4 | 0.064558% |
| D | 6196 | 93 | 1.500968% |
Noise dominated data is calculated using 1-second bins in cleaned event files. If a bin has >2000 counts, and if more than 50% of those come from <1% of pixels, then it is considered to be noise-dominated and hence unusable.
| Quadrant | # 1 sec bins | Bins with >0 counts | Bins with >2000 counts | High rate bins dominated by noise | Noise dominated (total time) | Noise dominated (detector-on time) | Marked lightcurve |
|---|---|---|---|---|---|---|---|
| A | 7471 | 6197 | 18 | 18 | 0.24% | 0.29% | 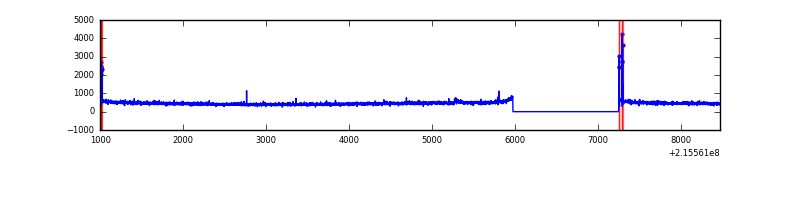 |
| B | 7471 | 6197 | 5 | 5 | 0.07% | 0.08% | 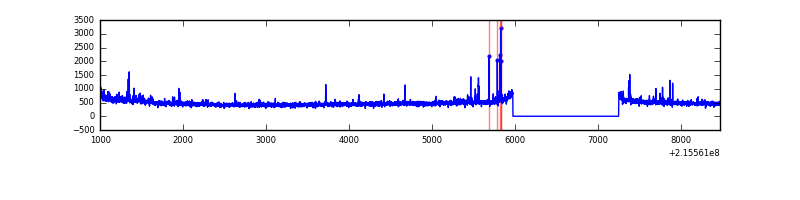 |
| C | 7471 | 6197 | 0 | 0 | 0.00% | 0.00% | 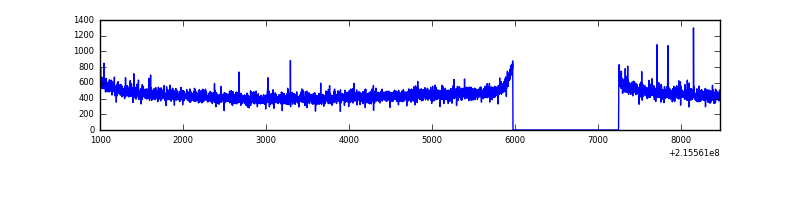 |
| D | 7471 | 6197 | 53 | 53 | 0.71% | 0.86% | 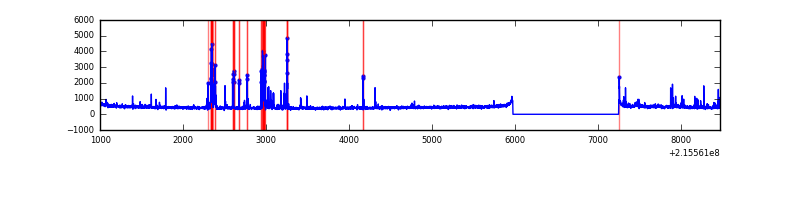 |
Top three noisy pixels from each quadrant. If the there are fewer than three noisy pixels in the level2.evt file, extra rows are filled as -1
| Pixel properties | Quadrant properties | ||||||
|---|---|---|---|---|---|---|---|
| Quadrant | DetID | PixID | Counts | Sigma | Mean | Median | Sigma |
| A | 15 | 236 | 40333 | 270.07 | 722 | 708 | 146.7 |
| A | 15 | 234 | 32715 | 218.15 | 722 | 708 | 146.7 |
| A | 12 | 194 | 7052 | 43.24 | 722 | 708 | 146.7 |
| B | 15 | 204 | 37707 | 265.72 | 739 | 724 | 139.2 |
| B | 15 | 255 | 32422 | 227.75 | 739 | 724 | 139.2 |
| B | 0 | 214 | 23044 | 160.37 | 739 | 724 | 139.2 |
| C | 12 | 4 | 10557 | 59.49 | 712 | 716 | 165.4 |
| C | 13 | 61 | 5736 | 30.35 | 712 | 716 | 165.4 |
| C | 1 | 16 | 4335 | 21.88 | 712 | 716 | 165.4 |
| D | 2 | 152 | 309199 | 1793.58 | 698 | 675 | 172.0 |
| D | 2 | 14 | 32350 | 184.14 | 698 | 675 | 172.0 |
| D | 2 | 206 | 10697 | 58.26 | 698 | 675 | 172.0 |
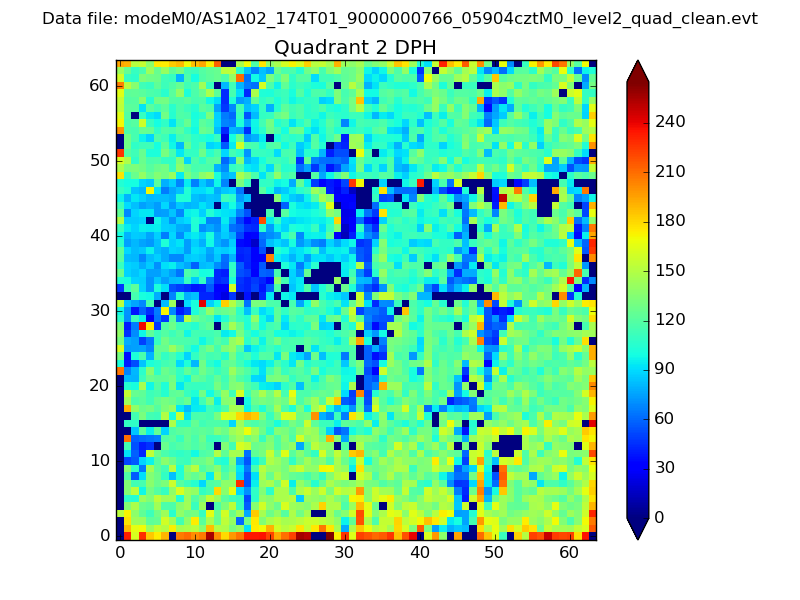
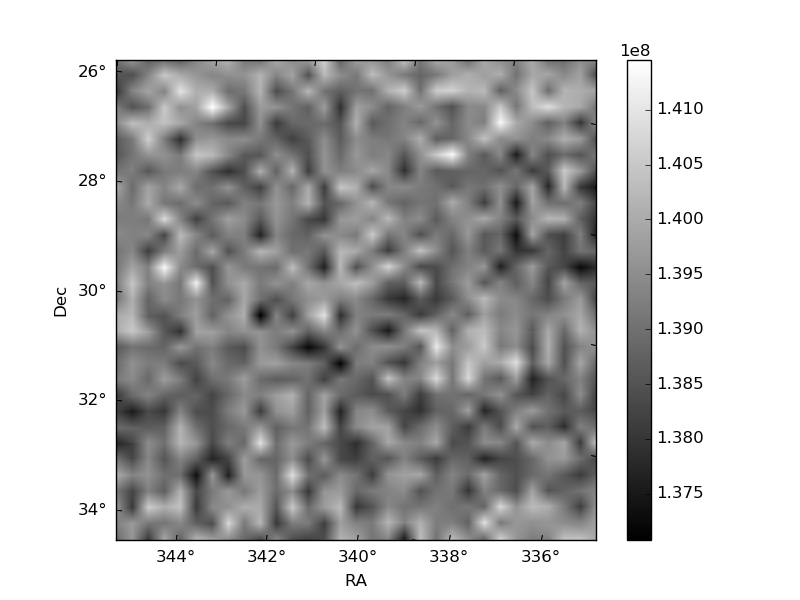
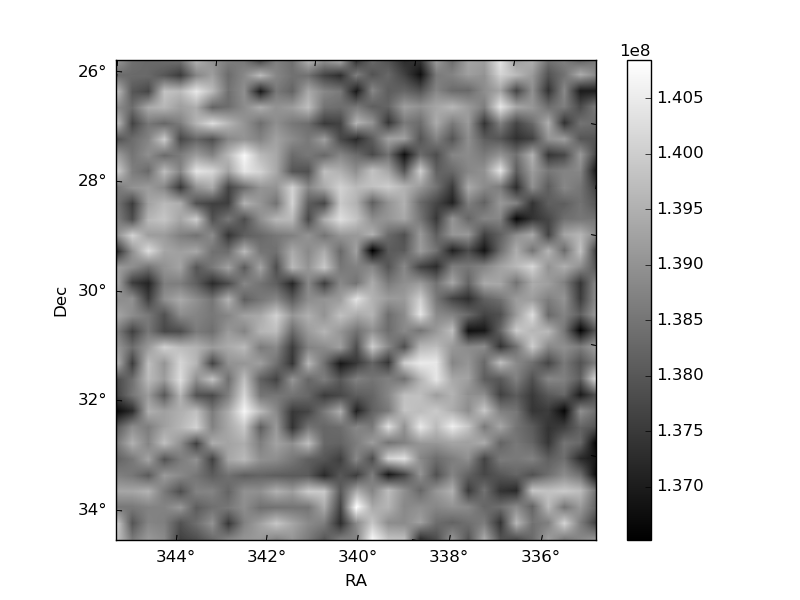
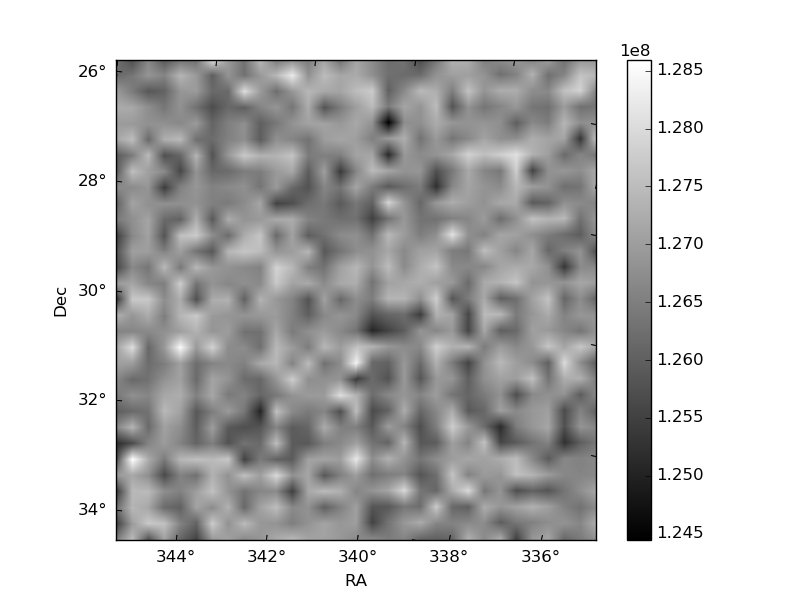
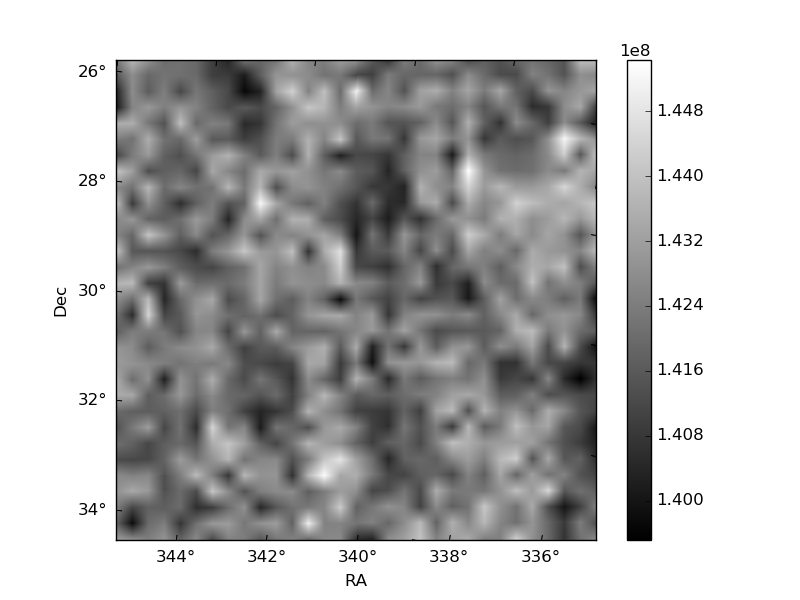
Histogram calculated using DETX and DETY for each event in the final _common_clean file
| Quadrant A | 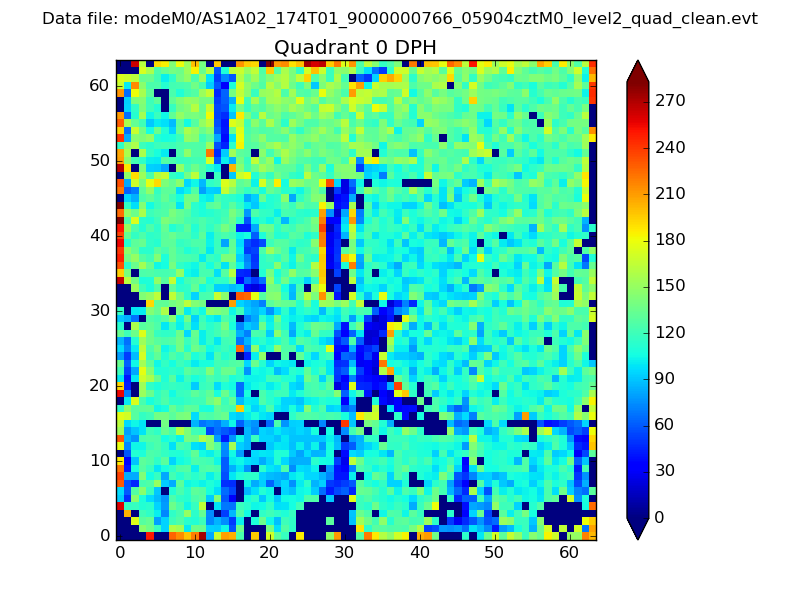 |
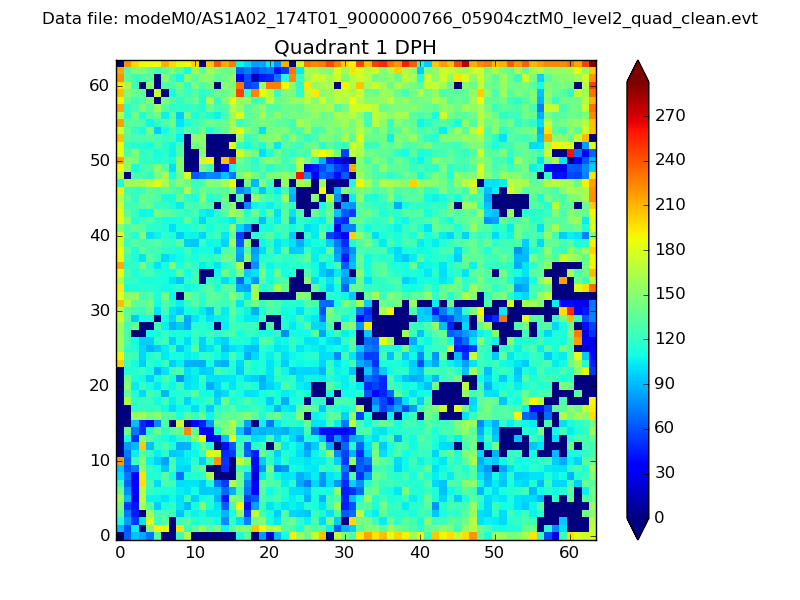 |
Quadrant B |
|---|---|---|---|
| Quadrant D | 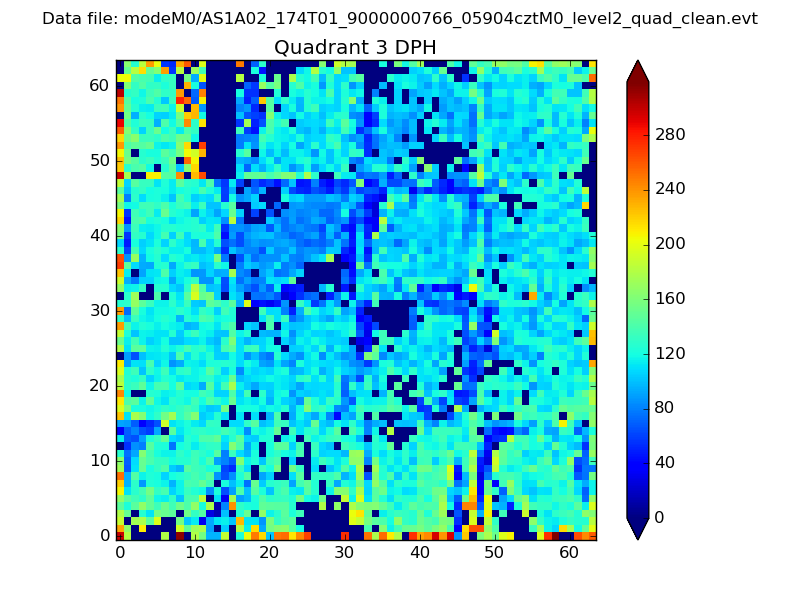 |
 |
Quadrant C |
| Plot type | Count rate plots | Images |
|---|---|---|
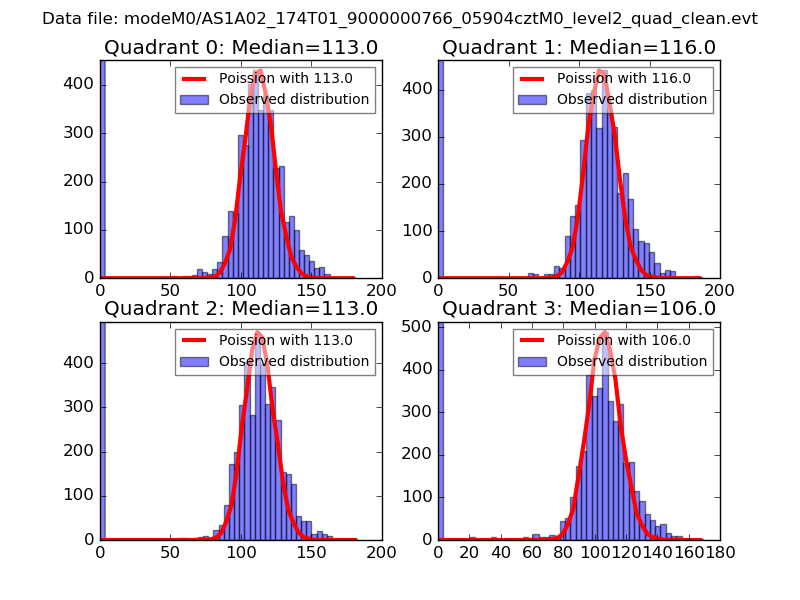
| Comparison with Poisson distribution Blue bars denote a histogram of data divided into 1 sec bins. Red curve is a Poisson curve with rate = median count rate of data. |
 |
 |
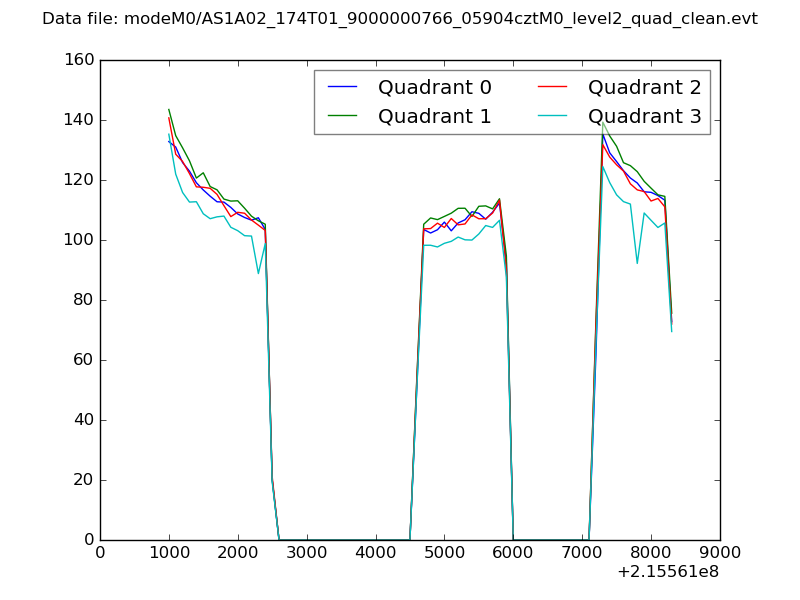
| Quadrant-wise count rates Data is divided into 100 sec bins |
 |
|
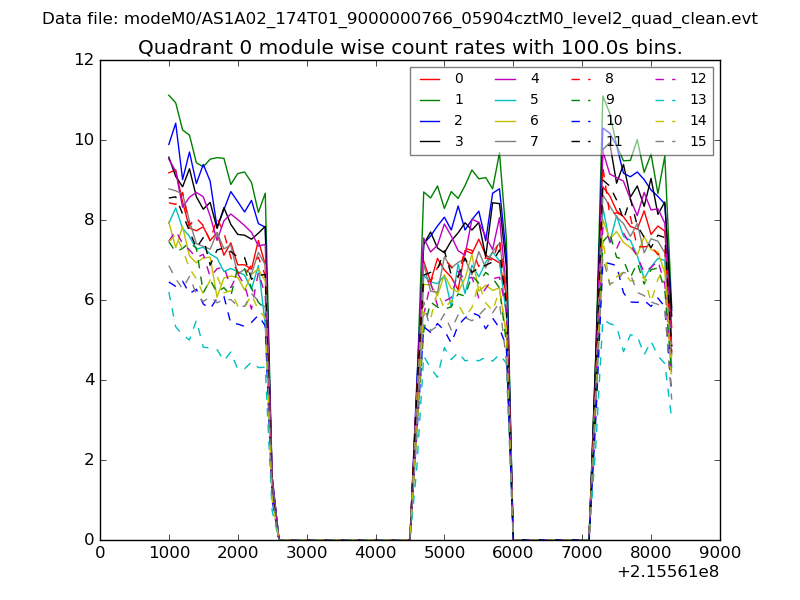
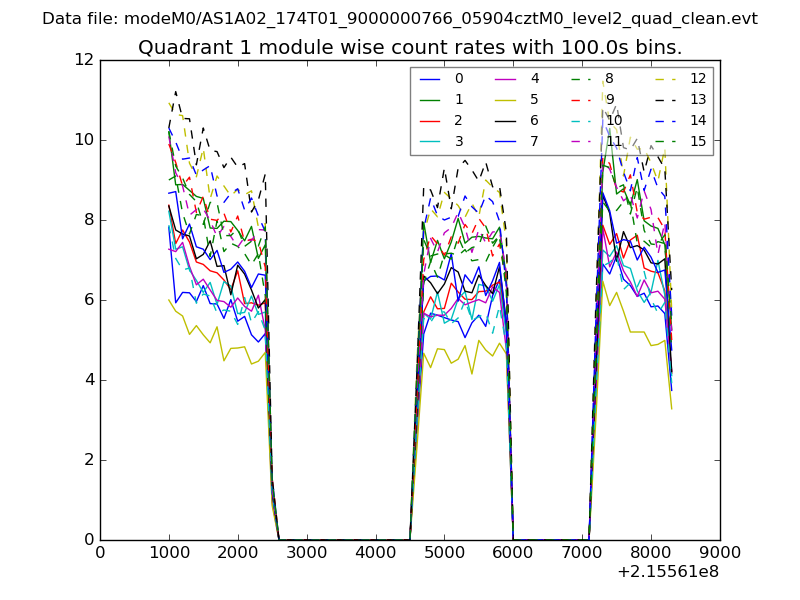
| Module-wise count rates for Quadrant A Data is divided into 100 sec bins |
 |
 |
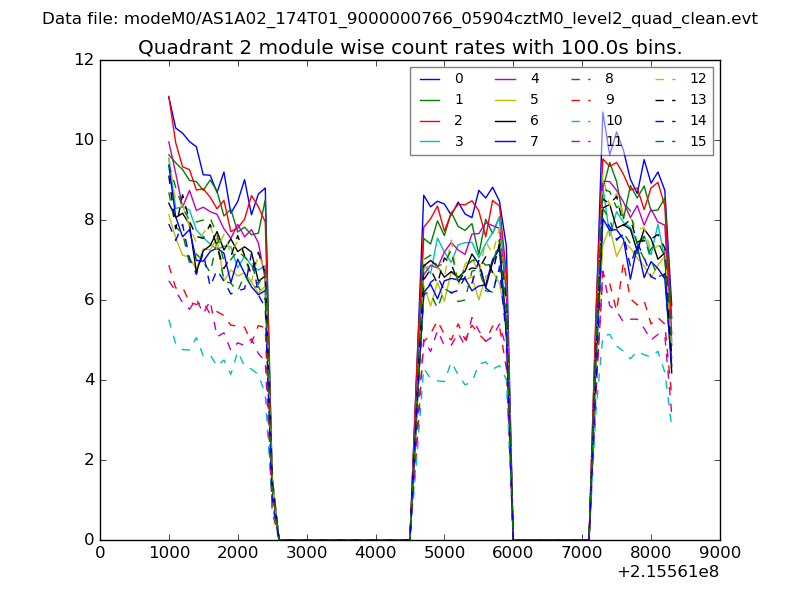
| Module-wise count rates for Quadrant B Data is divided into 100 sec bins |
 |
 |
| Module-wise count rates for Quadrant C Data is divided into 100 sec bins |
 |
 |
| Module-wise count rates for Quadrant D Data is divided into 100 sec bins |
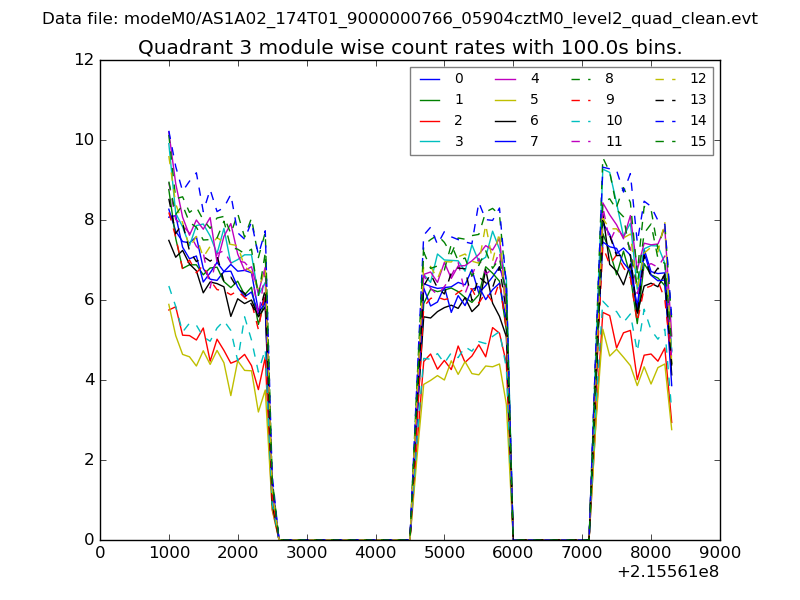 |
 |
| Parameter | Plot |
|---|---|
| CZT HV Monitor | 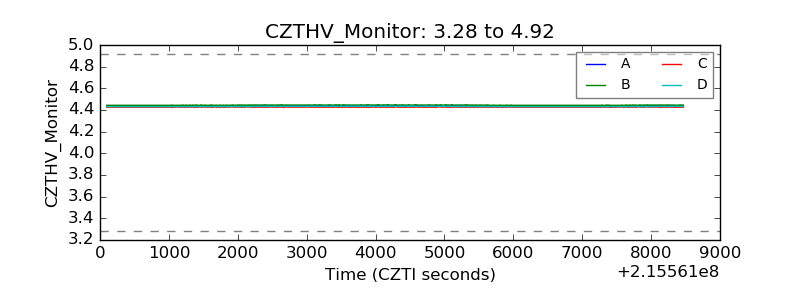 |
| D_VDD | 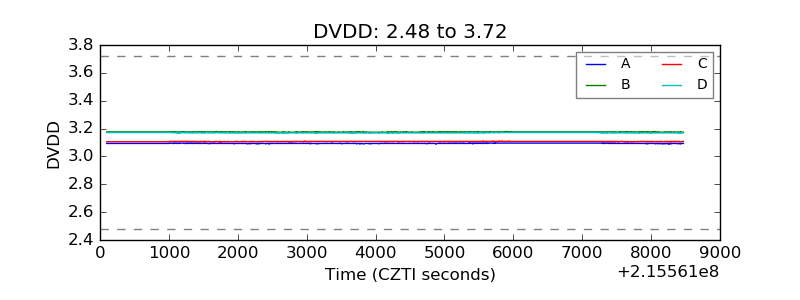 |
| Temperature 1 | 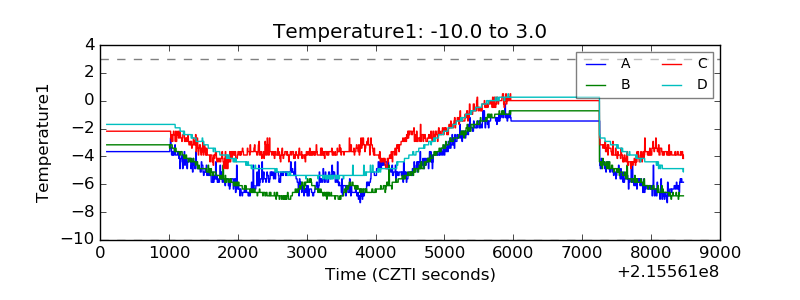 |
| Veto HV Monitor | 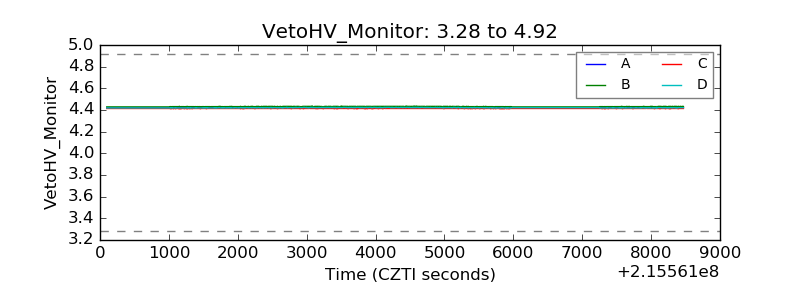 |
| Veto LLD | 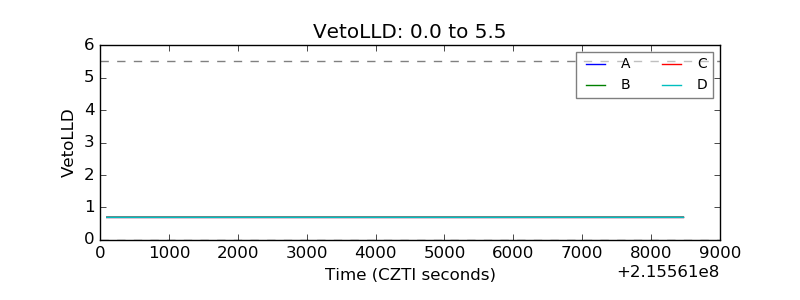 |
| Alpha Counter | 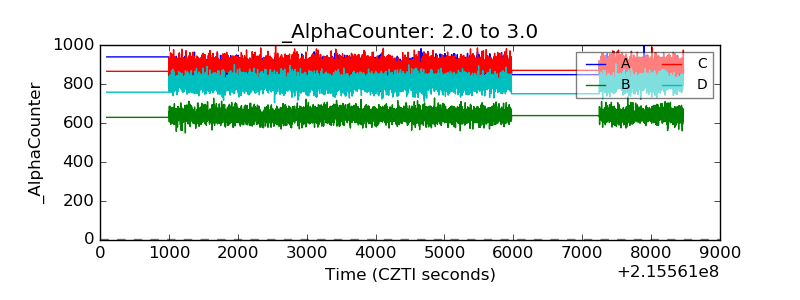 |
| _CPM_Rate | 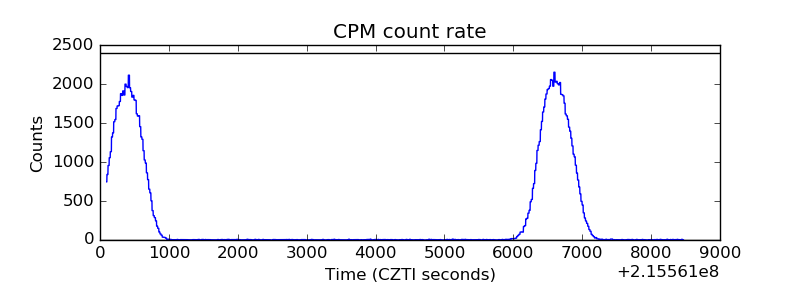 |
| CZT Counter | 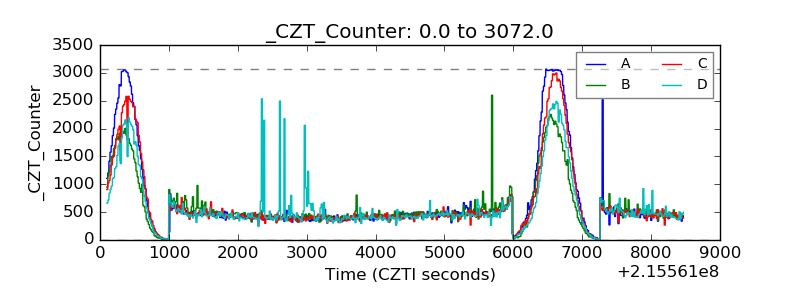 |
| +2.5 Volts monitor |  |
| +5 Volts monitor | 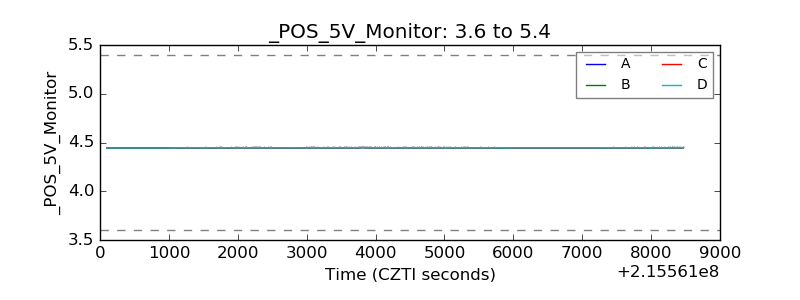 |
| _ROLL_ROT | 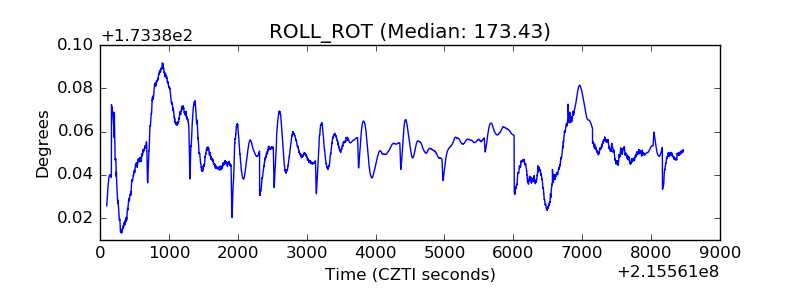 |
| _Roll_DEC | 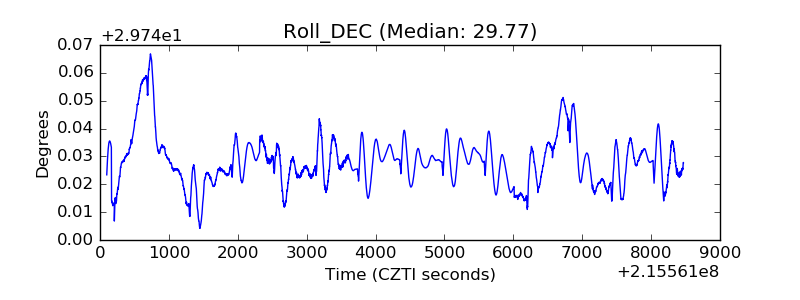 |
| _Roll_RA | 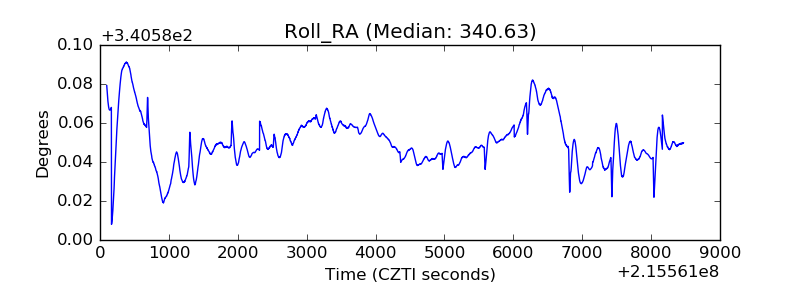 |
| Veto Counter | 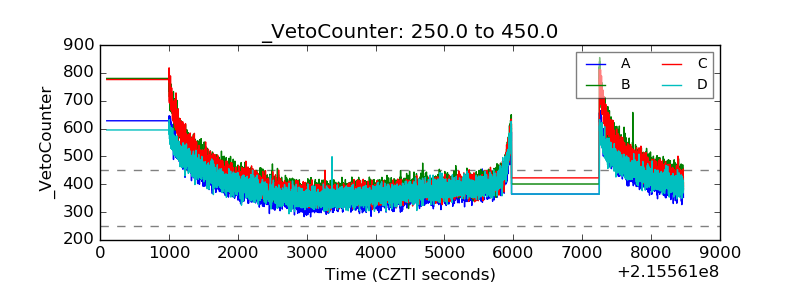 |