| Param | Original file | Final file |
|---|---|---|
| Filename | modeM0/AS1A02_174T01_9000000766_05905cztM0_level2.evt | modeM0/AS1A02_174T01_9000000766_05905cztM0_level2_quad_clean.evt |
| Size (bytes) | 415,546,560 | 67,271,040 |
| Size | 396.3 MB | 64.2 MB |
| Events in quadrant A | 2,918,450 | 404,969 |
| Events in quadrant B | 3,226,126 | 414,750 |
| Events in quadrant C | 2,837,690 | 403,023 |
| Events in quadrant D | 3,176,739 | 377,204 |
| Mode M9 | |||
|---|---|---|---|
| Quadrant | BADHDUFLAG | Total packets | Discarded packets |
| A | 0 | 18 | 0 |
| B | 0 | 18 | 0 |
| C | 0 | 18 | 0 |
| D | 0 | 19 | 0 |
| Mode M0 | |||
|---|---|---|---|
| Quadrant | BADHDUFLAG | Total packets | Discarded packets |
| A | 0 | 12938 | 3 |
| B | 0 | 13700 | 2 |
| C | 0 | 12749 | 2 |
| D | 0 | 13905 | 2 |
| Mode SS | |||
|---|---|---|---|
| Quadrant | BADHDUFLAG | Total packets | Discarded packets |
| A | 0 | 128 | 0 |
| B | 0 | 128 | 0 |
| C | 0 | 128 | 0 |
| D | 0 | 128 | 0 |
| Quadrant | Total seconds | Saturated seconds | Saturation percentage |
|---|---|---|---|
| A | 6255 | 24 | 0.383693% |
| B | 6255 | 37 | 0.591527% |
| C | 6255 | 6 | 0.095923% |
| D | 6255 | 67 | 1.071143% |
Noise dominated data is calculated using 1-second bins in cleaned event files. If a bin has >2000 counts, and if more than 50% of those come from <1% of pixels, then it is considered to be noise-dominated and hence unusable.
| Quadrant | # 1 sec bins | Bins with >0 counts | Bins with >2000 counts | High rate bins dominated by noise | Noise dominated (total time) | Noise dominated (detector-on time) | Marked lightcurve |
|---|---|---|---|---|---|---|---|
| A | 7570 | 6256 | 8 | 8 | 0.11% | 0.13% | 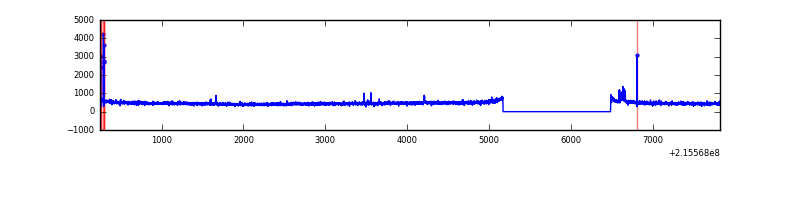 |
| B | 7570 | 6256 | 14 | 14 | 0.18% | 0.22% |  |
| C | 7570 | 6256 | 0 | 0 | 0.00% | 0.00% | 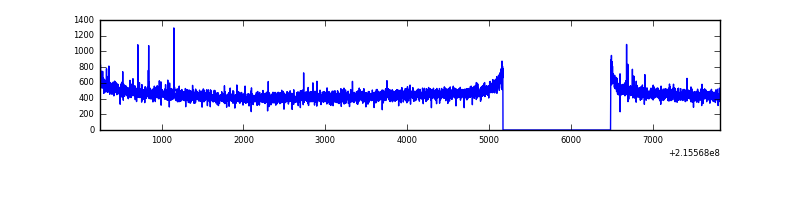 |
| D | 7570 | 6256 | 35 | 35 | 0.46% | 0.56% | 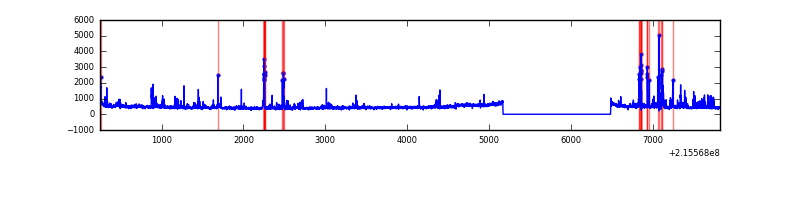 |
Top three noisy pixels from each quadrant. If the there are fewer than three noisy pixels in the level2.evt file, extra rows are filled as -1
| Pixel properties | Quadrant properties | ||||||
|---|---|---|---|---|---|---|---|
| Quadrant | DetID | PixID | Counts | Sigma | Mean | Median | Sigma |
| A | 15 | 236 | 51492 | 336.18 | 736 | 718 | 151.0 |
| A | 15 | 234 | 29287 | 189.15 | 736 | 718 | 151.0 |
| A | 0 | 226 | 7079 | 42.11 | 736 | 718 | 151.0 |
| B | 15 | 204 | 65620 | 453.85 | 752 | 735 | 143.0 |
| B | 15 | 255 | 57434 | 396.59 | 752 | 735 | 143.0 |
| B | 4 | 81 | 56041 | 386.85 | 752 | 735 | 143.0 |
| C | 12 | 4 | 10041 | 55.61 | 722 | 726 | 167.5 |
| C | 13 | 61 | 5766 | 30.09 | 722 | 726 | 167.5 |
| C | 9 | 247 | 4223 | 20.87 | 722 | 726 | 167.5 |
| D | 2 | 152 | 286409 | 1650.73 | 707 | 686 | 173.1 |
| D | 5 | 81 | 54669 | 311.88 | 707 | 686 | 173.1 |
| D | 10 | 40 | 48575 | 276.67 | 707 | 686 | 173.1 |
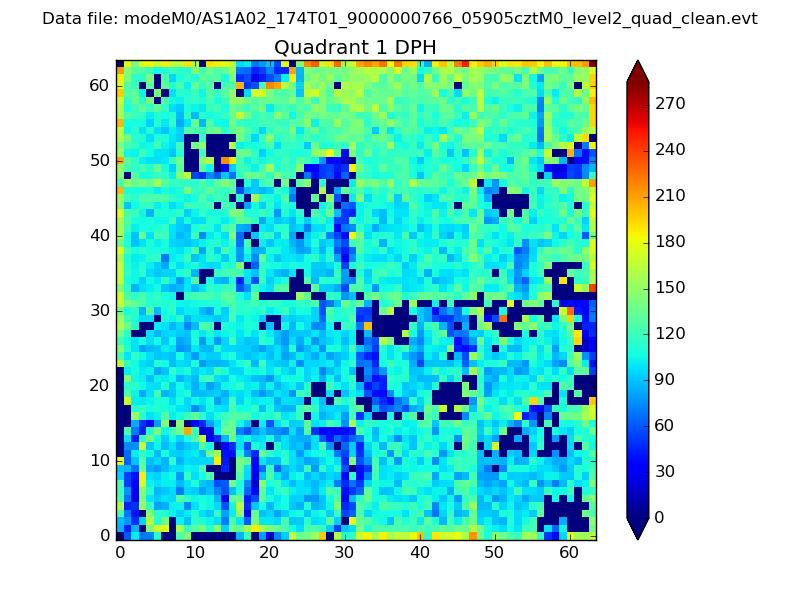
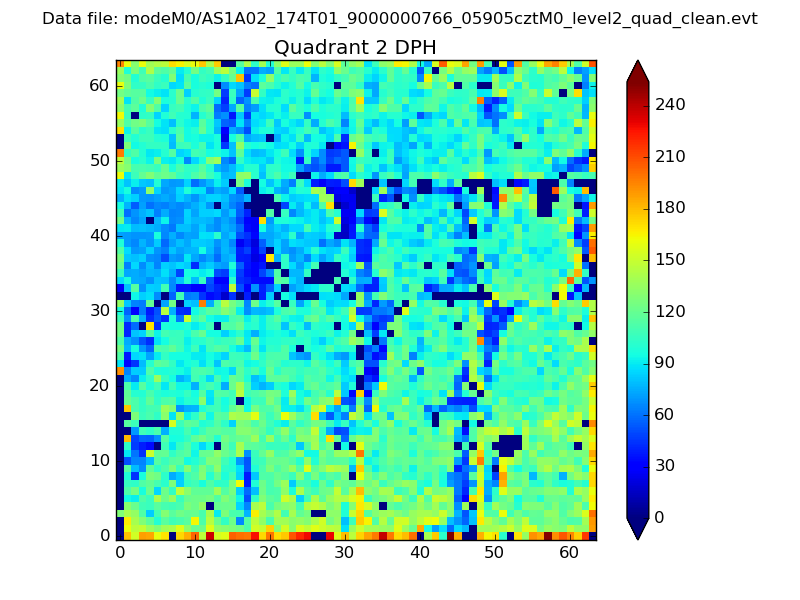
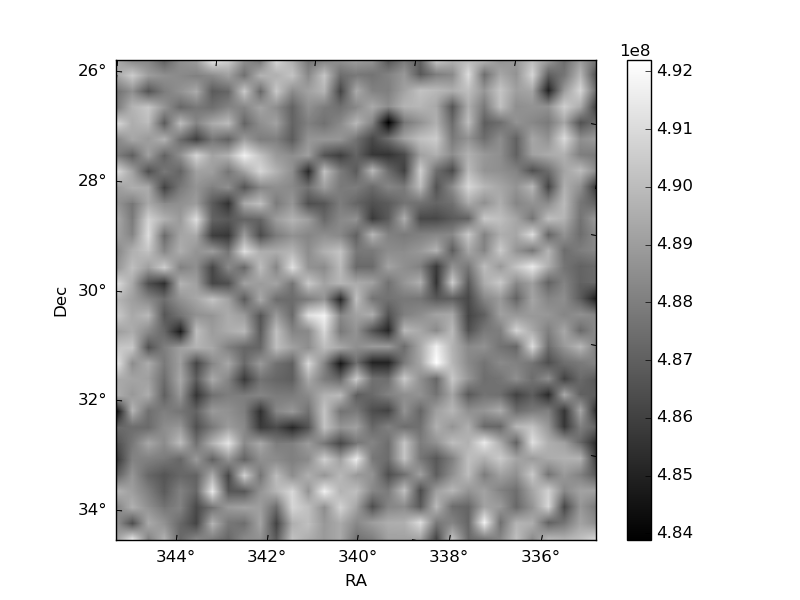
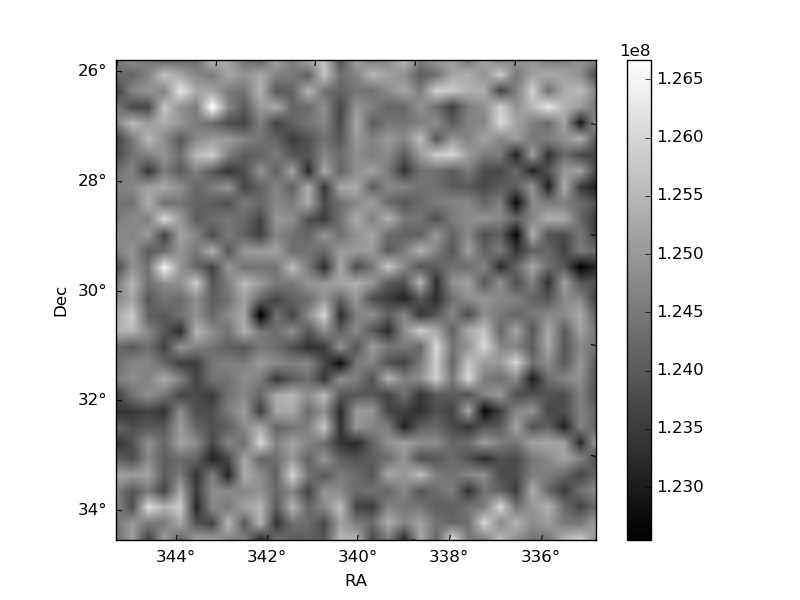
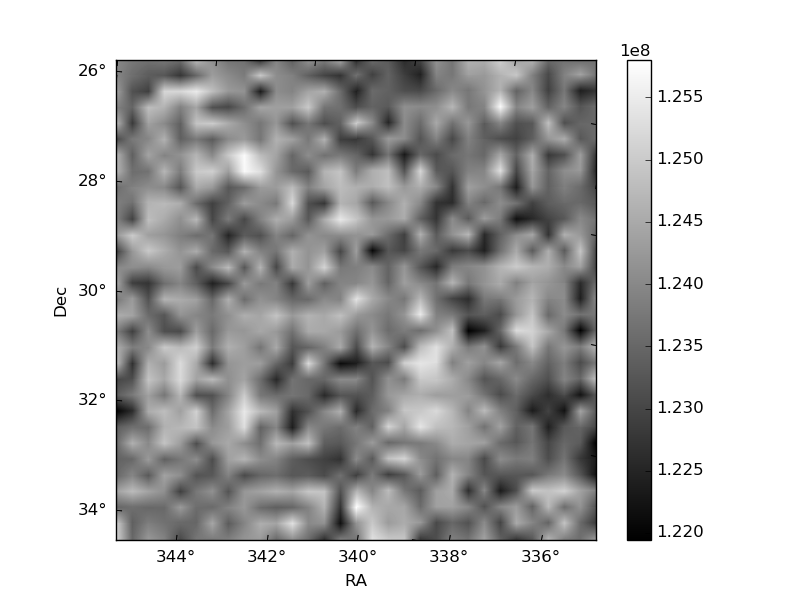
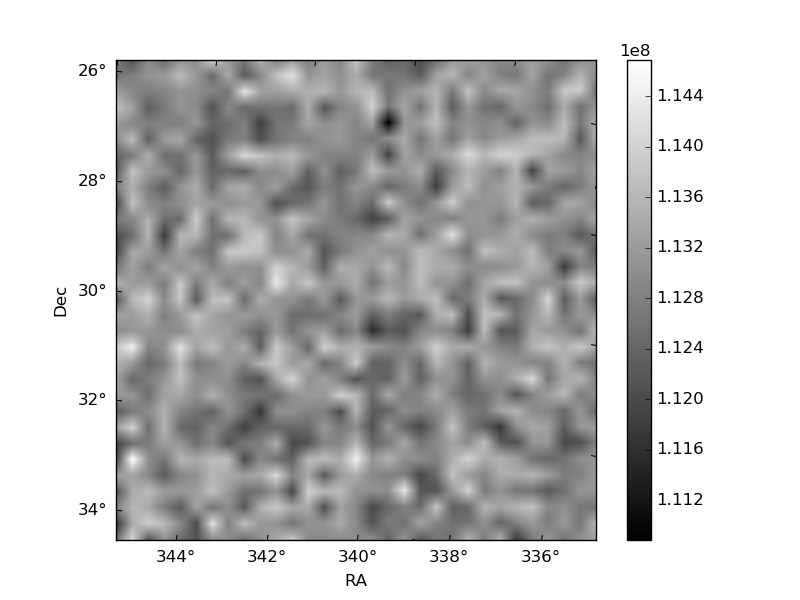
Histogram calculated using DETX and DETY for each event in the final _common_clean file
| Quadrant A | 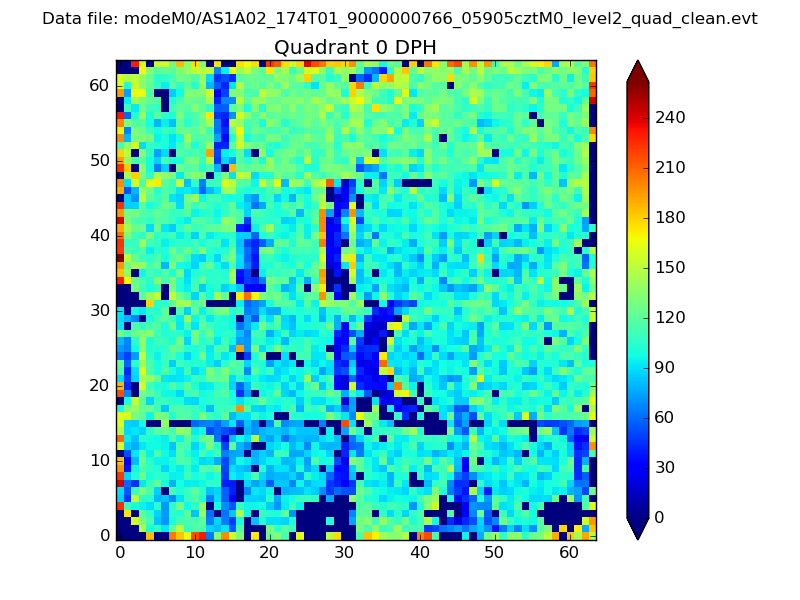 |
 |
Quadrant B |
|---|---|---|---|
| Quadrant D | 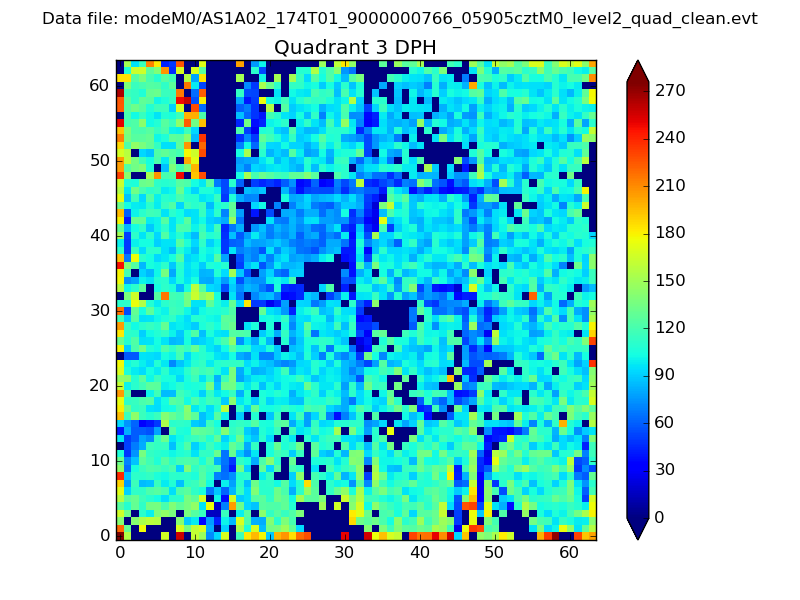 |
 |
Quadrant C |
| Plot type | Count rate plots | Images |
|---|---|---|
| Comparison with Poisson distribution Blue bars denote a histogram of data divided into 1 sec bins. Red curve is a Poisson curve with rate = median count rate of data. |
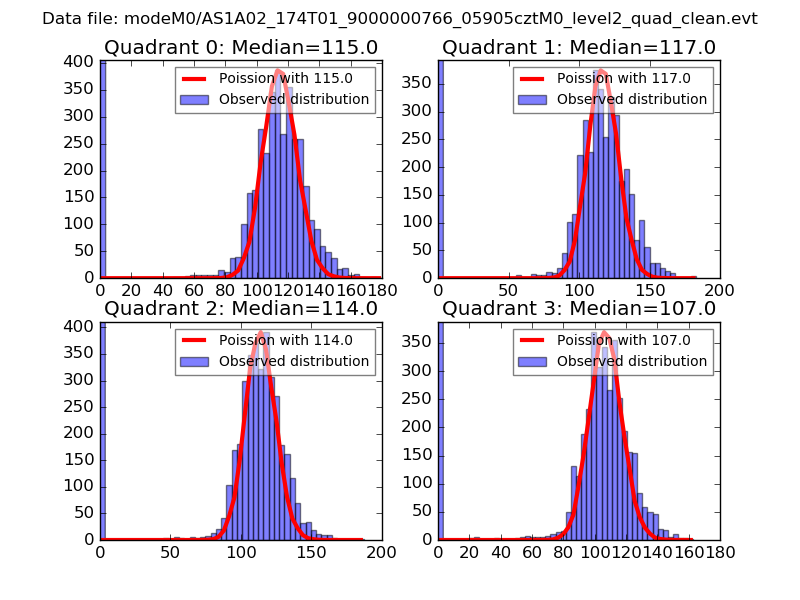 |
 |
| Quadrant-wise count rates Data is divided into 100 sec bins |
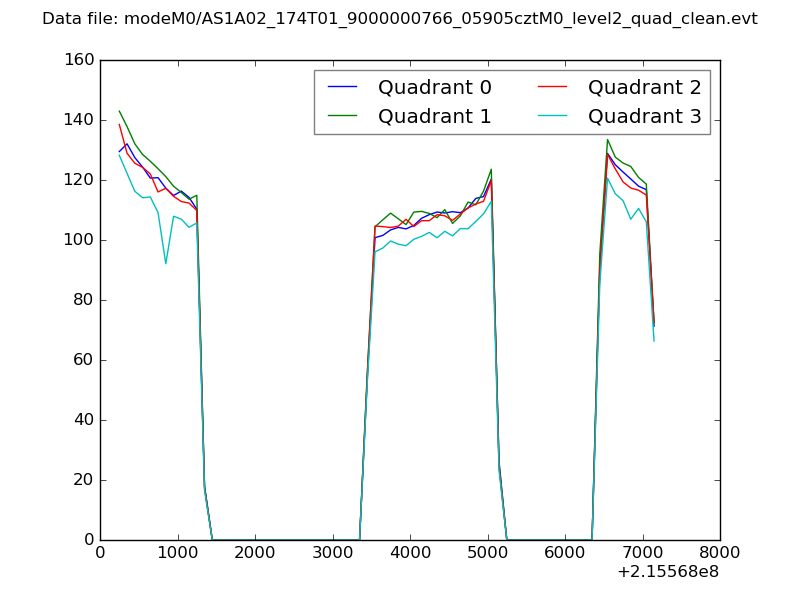 |
|
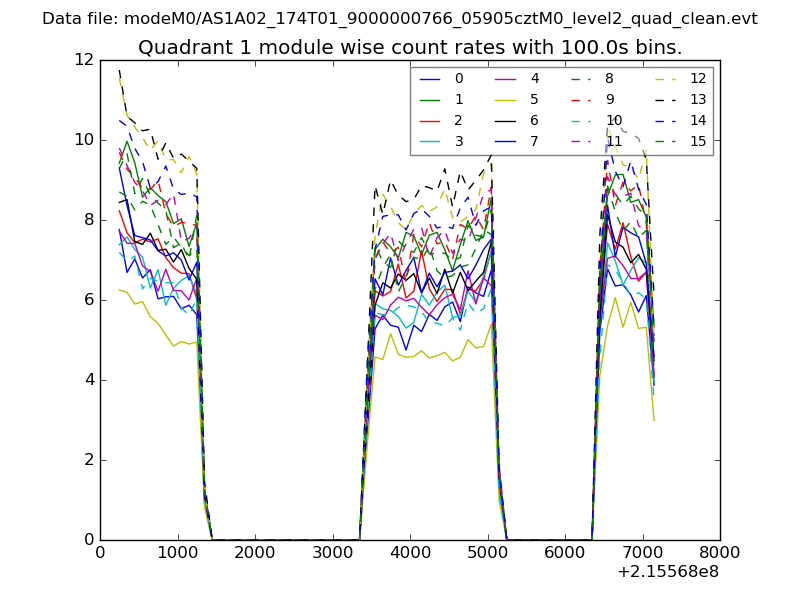
| Module-wise count rates for Quadrant A Data is divided into 100 sec bins |
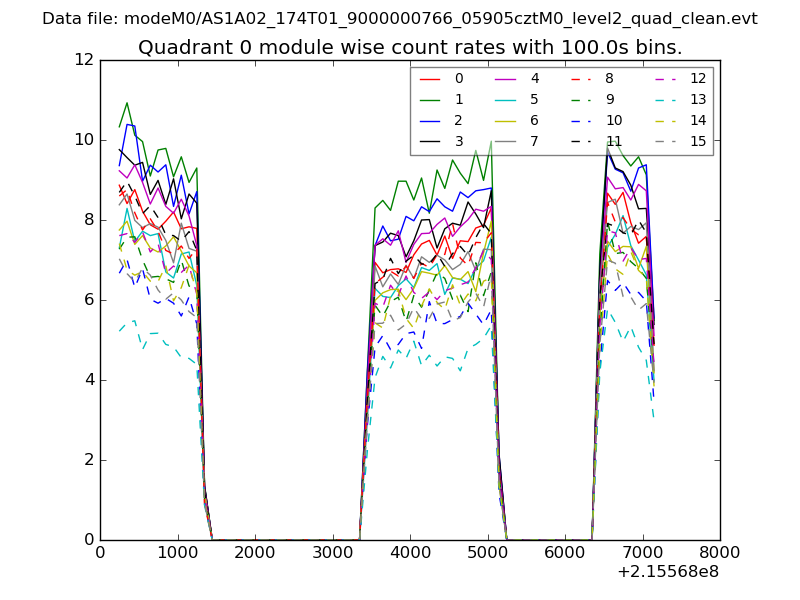 |
 |
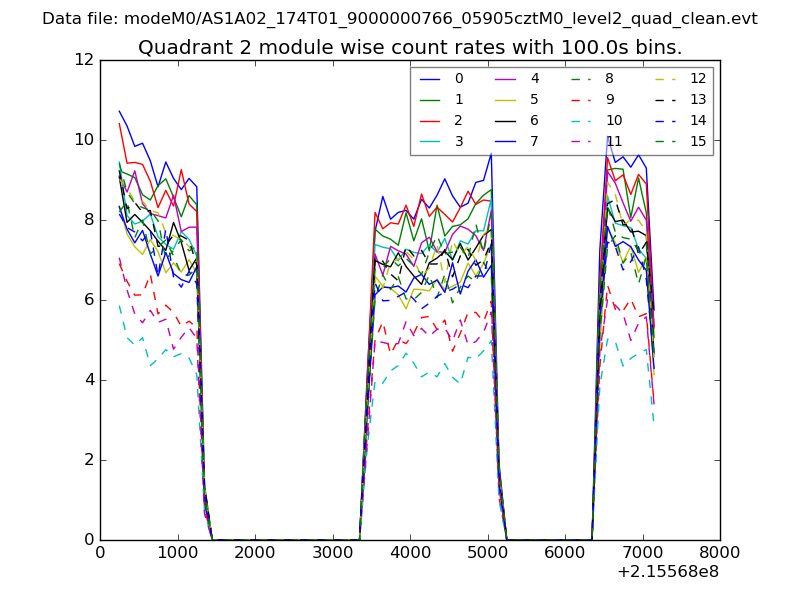
| Module-wise count rates for Quadrant B Data is divided into 100 sec bins |
 |
 |
| Module-wise count rates for Quadrant C Data is divided into 100 sec bins |
 |
 |
| Module-wise count rates for Quadrant D Data is divided into 100 sec bins |
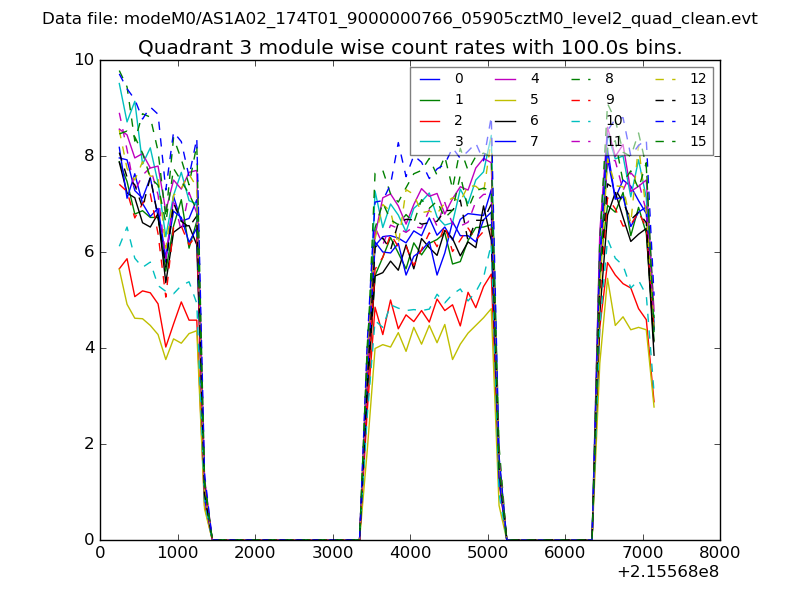 |
 |
| Parameter | Plot |
|---|---|
| CZT HV Monitor | 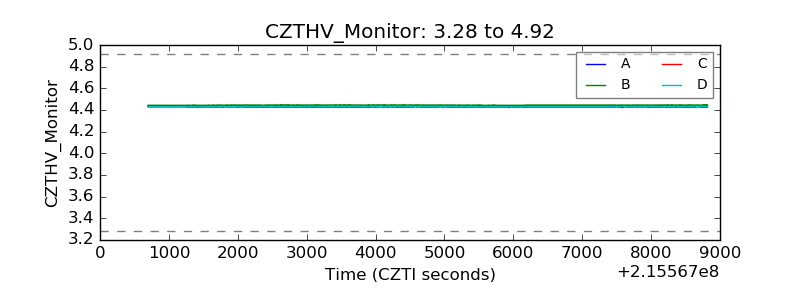 |
| D_VDD | 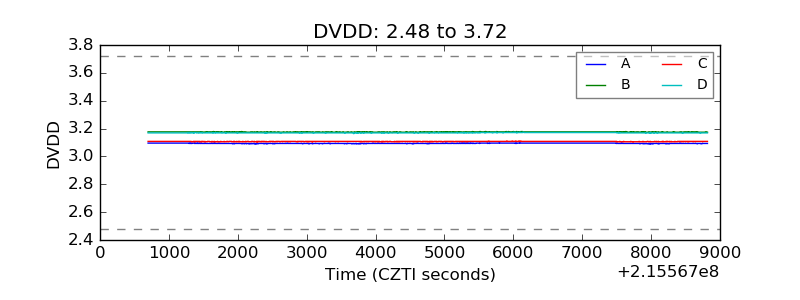 |
| Temperature 1 | 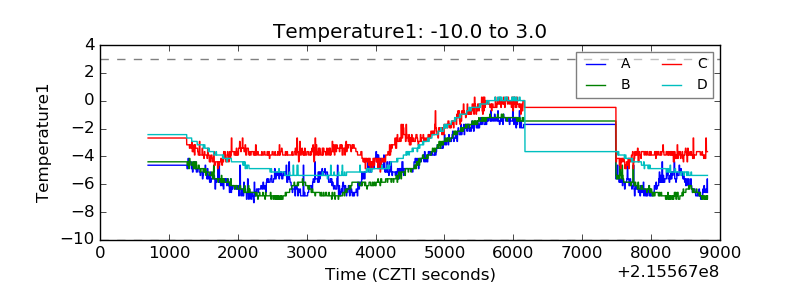 |
| Veto HV Monitor | 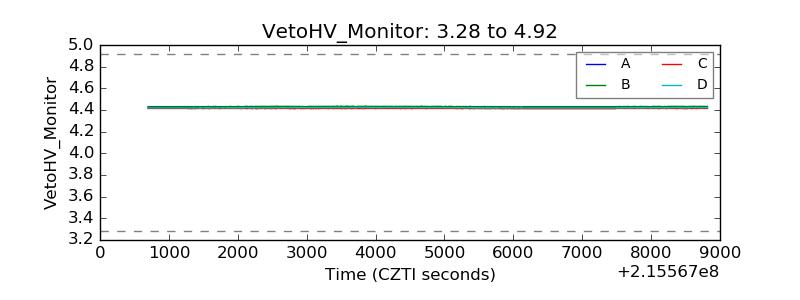 |
| Veto LLD | 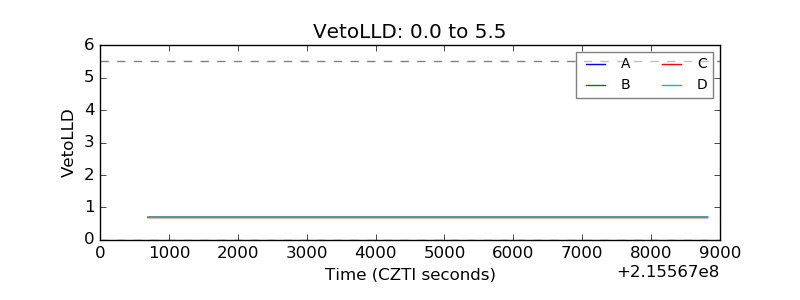 |
| Alpha Counter | 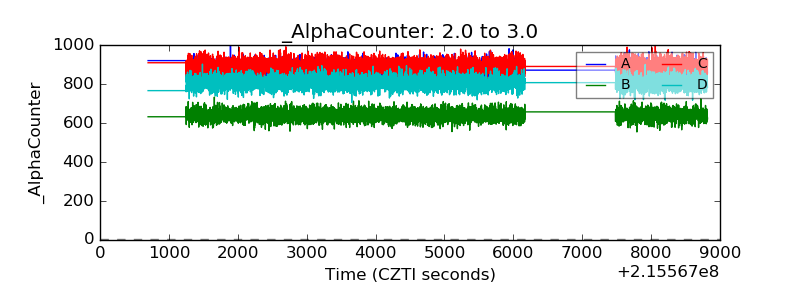 |
| _CPM_Rate | 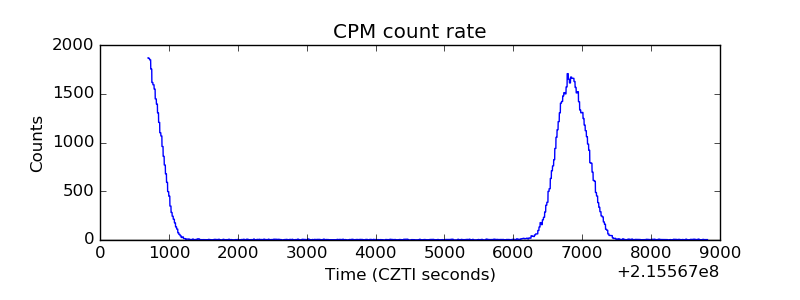 |
| CZT Counter | 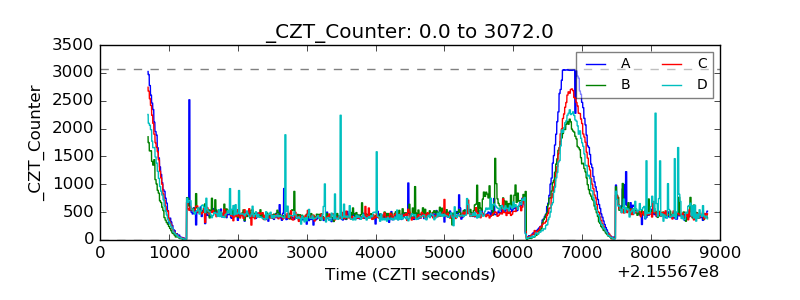 |
| +2.5 Volts monitor |  |
| +5 Volts monitor |  |
| _ROLL_ROT | 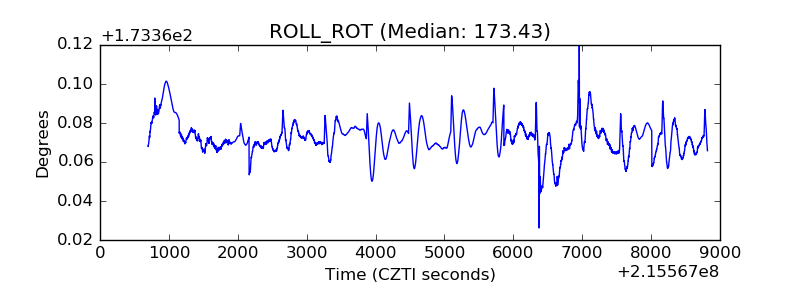 |
| _Roll_DEC |  |
| _Roll_RA | 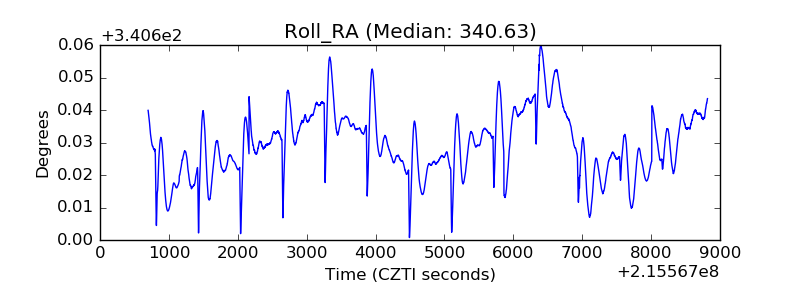 |
| Veto Counter | 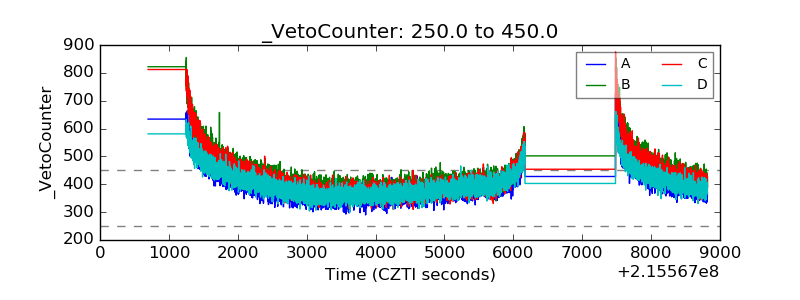 |