| Param | Original file | Final file |
|---|---|---|
| Filename | modeM0/AS1A02_174T01_9000000766_05907cztM0_level2.evt | modeM0/AS1A02_174T01_9000000766_05907cztM0_level2_quad_clean.evt |
| Size (bytes) | 479,695,680 | 58,106,880 |
| Size | 457.5 MB | 55.4 MB |
| Events in quadrant A | 3,030,429 | 329,393 |
| Events in quadrant B | 3,364,511 | 331,533 |
| Events in quadrant C | 3,768,493 | 324,763 |
| Events in quadrant D | 3,909,783 | 307,098 |
| Mode M9 | |||
|---|---|---|---|
| Quadrant | BADHDUFLAG | Total packets | Discarded packets |
| A | 0 | 16 | 0 |
| B | 0 | 16 | 0 |
| C | 0 | 16 | 0 |
| D | 0 | 17 | 0 |
| Mode M0 | |||
|---|---|---|---|
| Quadrant | BADHDUFLAG | Total packets | Discarded packets |
| A | 0 | 13760 | 3 |
| B | 0 | 14443 | 2 |
| C | 0 | 15813 | 2 |
| D | 0 | 16336 | 2 |
| Mode SS | |||
|---|---|---|---|
| Quadrant | BADHDUFLAG | Total packets | Discarded packets |
| A | 0 | 136 | 0 |
| B | 0 | 136 | 0 |
| C | 0 | 136 | 0 |
| D | 0 | 136 | 0 |
| Quadrant | Total seconds | Saturated seconds | Saturation percentage |
|---|---|---|---|
| A | 6688 | 58 | 0.867225% |
| B | 6688 | 124 | 1.854067% |
| C | 6688 | 134 | 2.003589% |
| D | 6688 | 166 | 2.482057% |
Noise dominated data is calculated using 1-second bins in cleaned event files. If a bin has >2000 counts, and if more than 50% of those come from <1% of pixels, then it is considered to be noise-dominated and hence unusable.
| Quadrant | # 1 sec bins | Bins with >0 counts | Bins with >2000 counts | High rate bins dominated by noise | Noise dominated (total time) | Noise dominated (detector-on time) | Marked lightcurve |
|---|---|---|---|---|---|---|---|
| A | 7758 | 6689 | 0 | 0 | 0.00% | 0.00% | 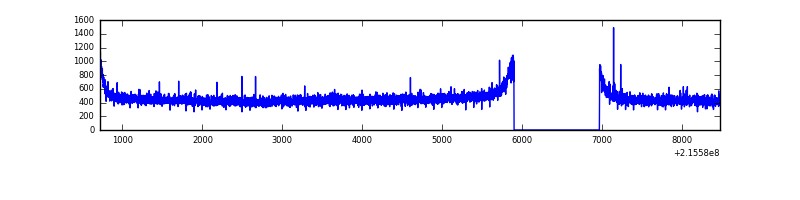 |
| B | 7758 | 6689 | 28 | 28 | 0.36% | 0.42% | 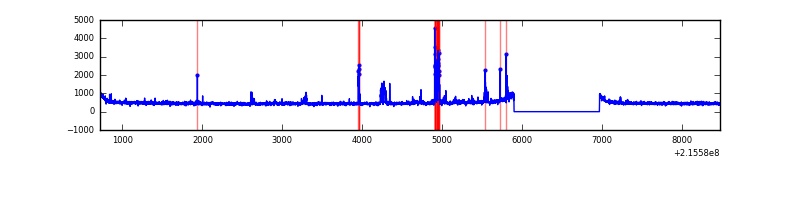 |
| C | 7758 | 6689 | 75 | 75 | 0.97% | 1.12% | 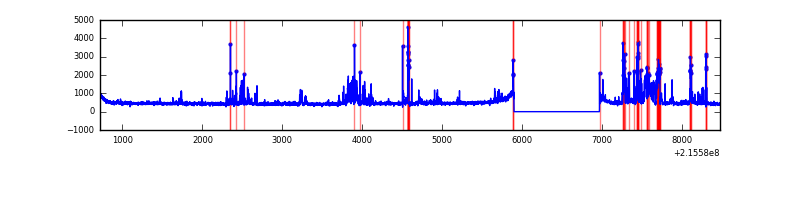 |
| D | 7758 | 6689 | 93 | 93 | 1.20% | 1.39% | 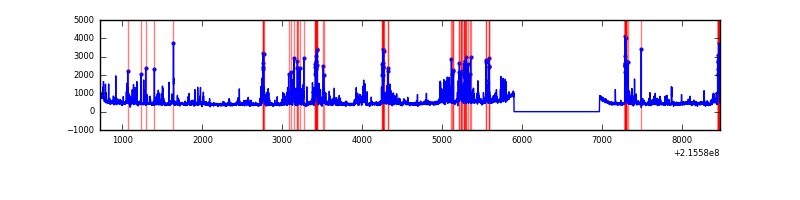 |
Top three noisy pixels from each quadrant. If the there are fewer than three noisy pixels in the level2.evt file, extra rows are filled as -1
| Pixel properties | Quadrant properties | ||||||
|---|---|---|---|---|---|---|---|
| Quadrant | DetID | PixID | Counts | Sigma | Mean | Median | Sigma |
| A | 0 | 226 | 7543 | 41.95 | 786 | 765 | 161.6 |
| A | 12 | 194 | 7468 | 41.48 | 786 | 765 | 161.6 |
| A | 7 | 16 | 5255 | 27.79 | 786 | 765 | 161.6 |
| B | 15 | 255 | 167852 | 1094.4 | 796 | 779 | 152.7 |
| B | 4 | 80 | 40093 | 257.52 | 796 | 779 | 152.7 |
| B | 0 | 214 | 28471 | 181.39 | 796 | 779 | 152.7 |
| C | 9 | 247 | 795103 | 4484.5 | 760 | 763 | 177.1 |
| C | 13 | 61 | 5985 | 29.48 | 760 | 763 | 177.1 |
| C | 12 | 4 | 5041 | 24.15 | 760 | 763 | 177.1 |
| D | 2 | 152 | 803513 | 4317.89 | 752 | 729 | 185.9 |
| D | 2 | 206 | 64558 | 343.31 | 752 | 729 | 185.9 |
| D | 2 | 63 | 40974 | 216.46 | 752 | 729 | 185.9 |
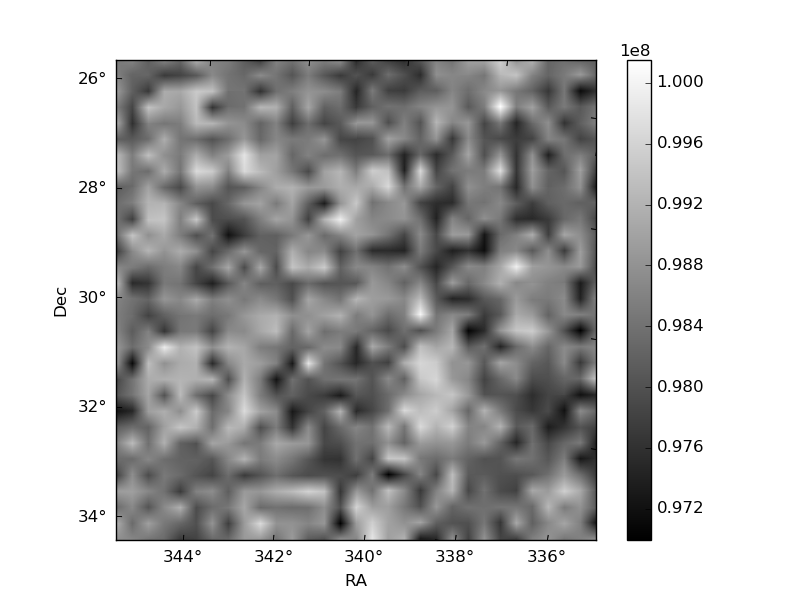
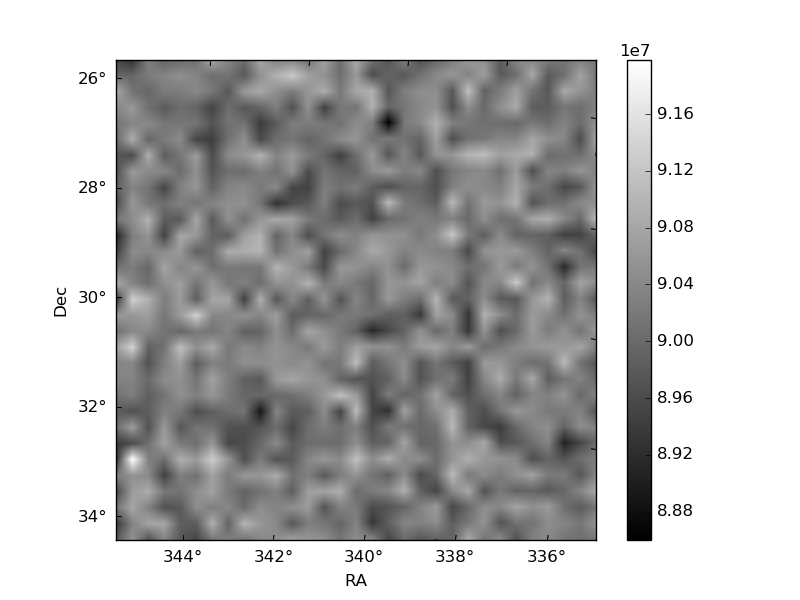
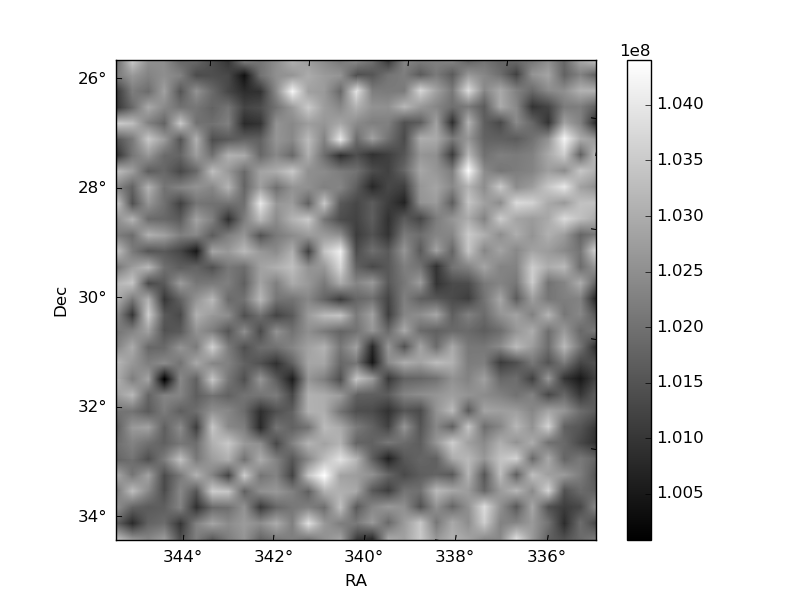
Histogram calculated using DETX and DETY for each event in the final _common_clean file
| Quadrant A | 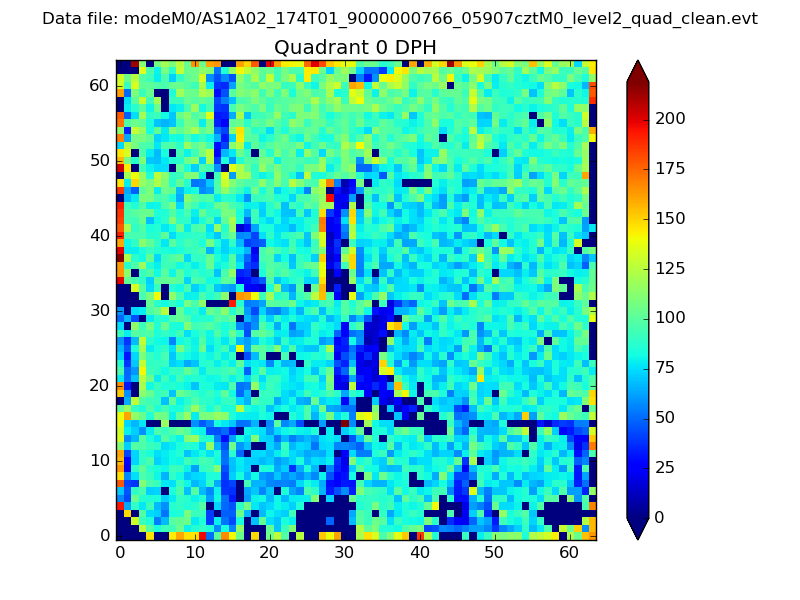 |
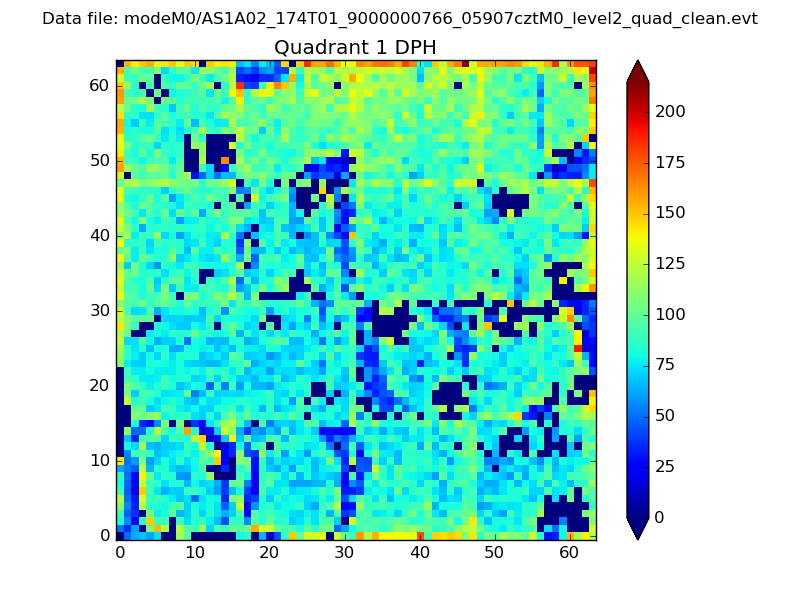 |
Quadrant B |
|---|---|---|---|
| Quadrant D | 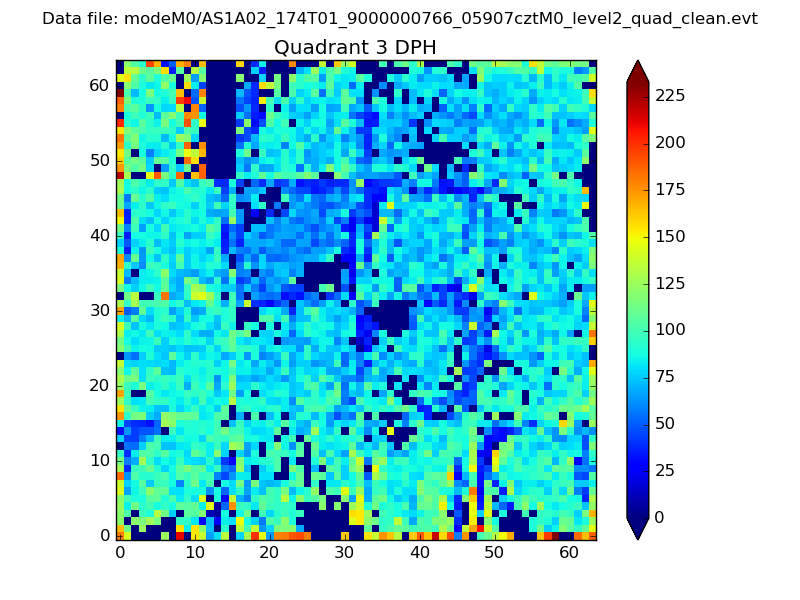 |
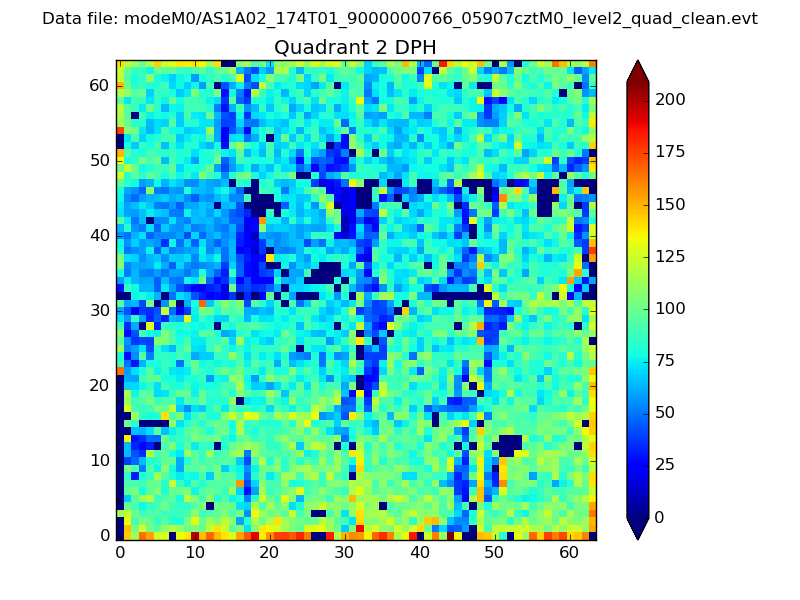 |
Quadrant C |
| Plot type | Count rate plots | Images |
|---|---|---|
| Comparison with Poisson distribution Blue bars denote a histogram of data divided into 1 sec bins. Red curve is a Poisson curve with rate = median count rate of data. |
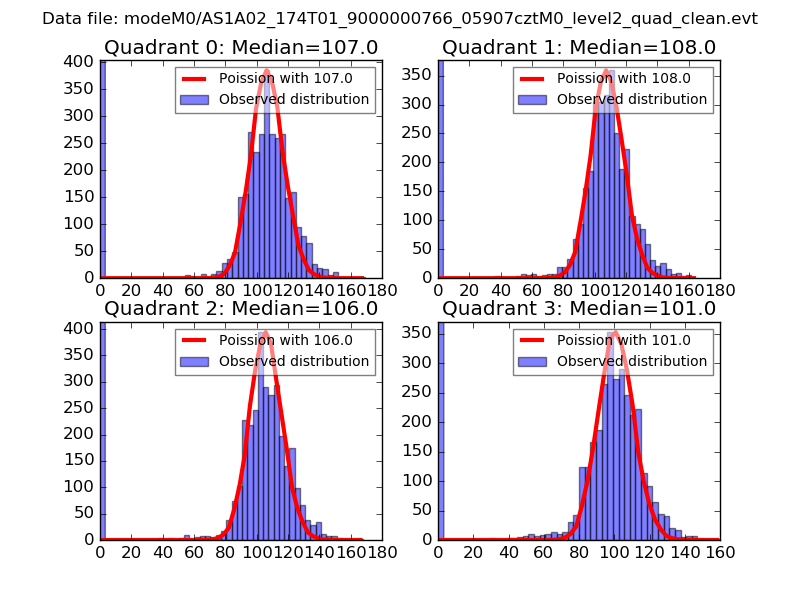 |
 |
| Quadrant-wise count rates Data is divided into 100 sec bins |
 |
|
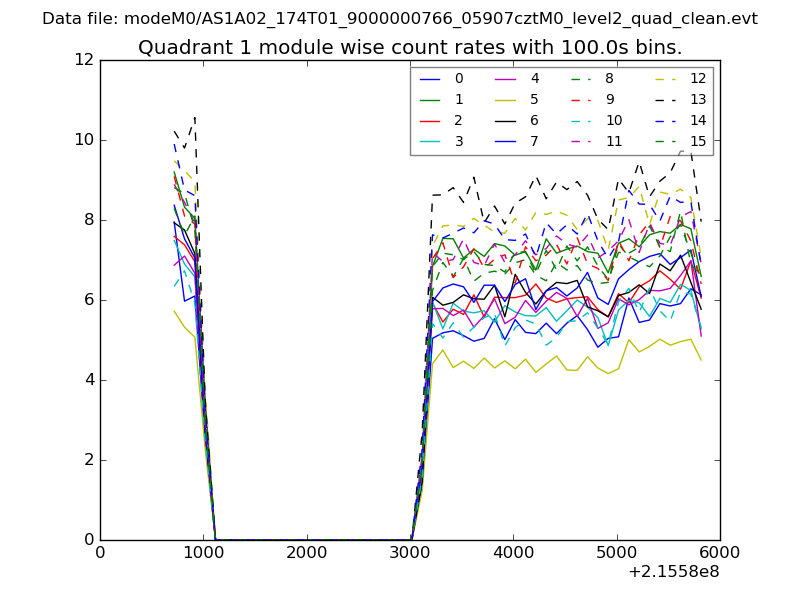
| Module-wise count rates for Quadrant A Data is divided into 100 sec bins |
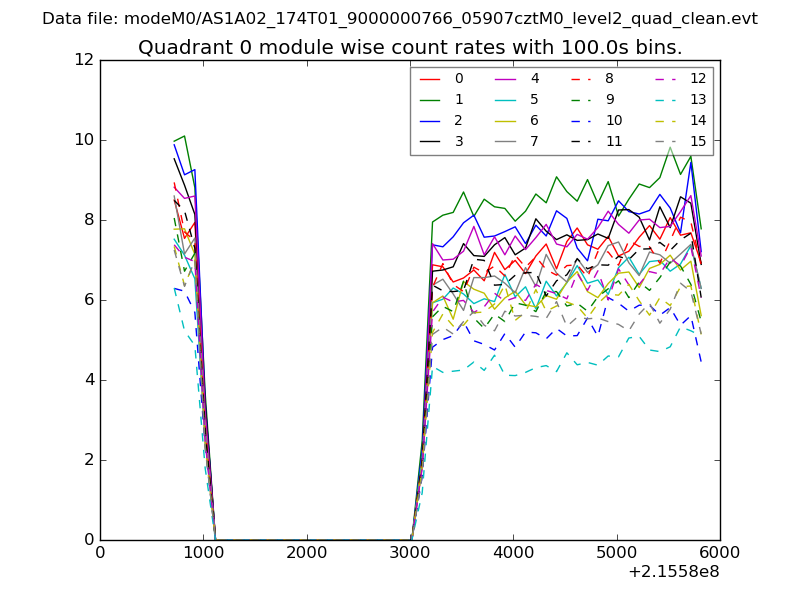 |
 |
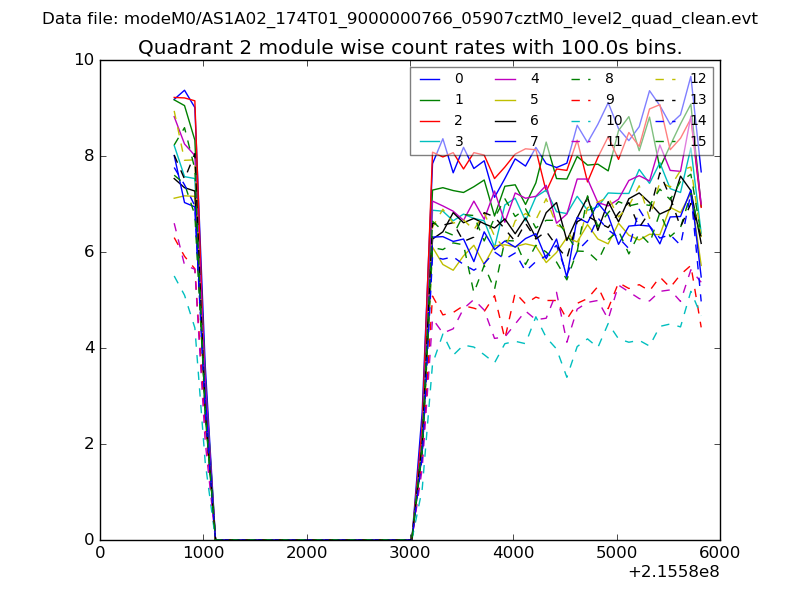
| Module-wise count rates for Quadrant B Data is divided into 100 sec bins |
 |
 |
| Module-wise count rates for Quadrant C Data is divided into 100 sec bins |
 |
 |
| Module-wise count rates for Quadrant D Data is divided into 100 sec bins |
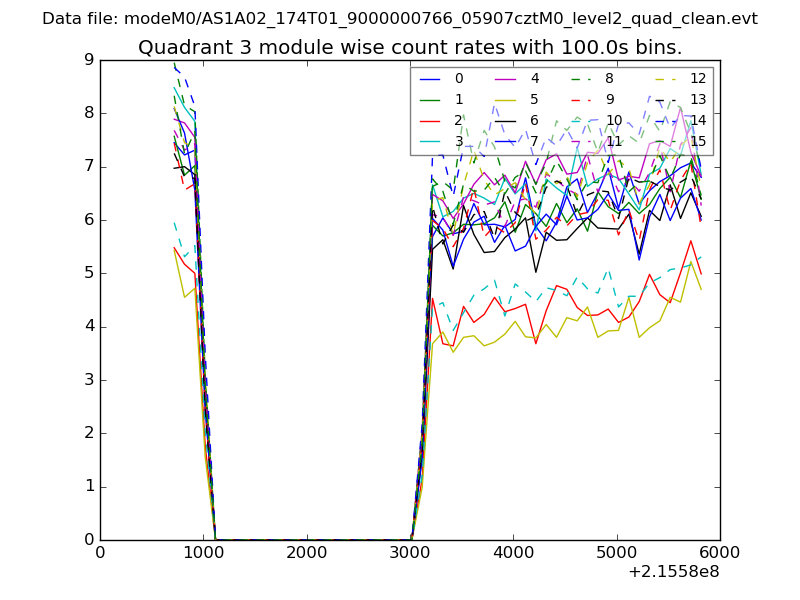 |
 |
| Parameter | Plot |
|---|---|
| CZT HV Monitor | 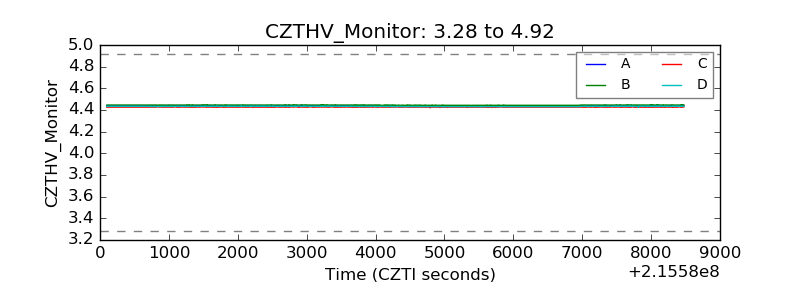 |
| D_VDD | 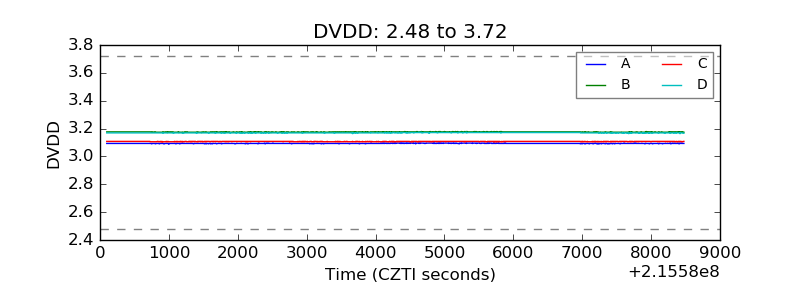 |
| Temperature 1 | 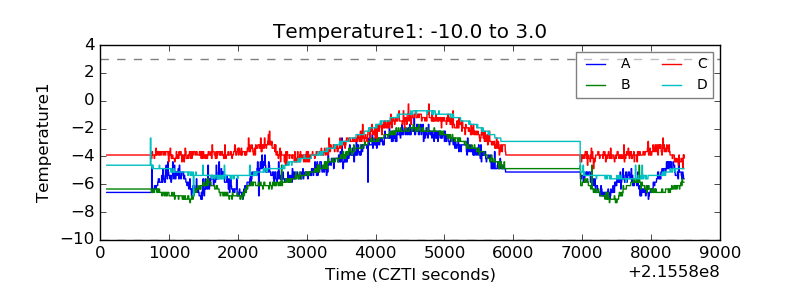 |
| Veto HV Monitor | 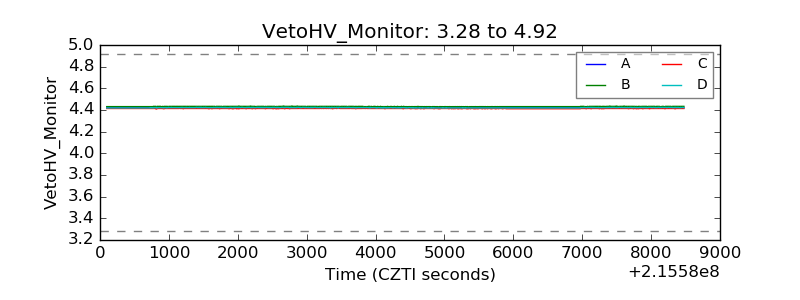 |
| Veto LLD | 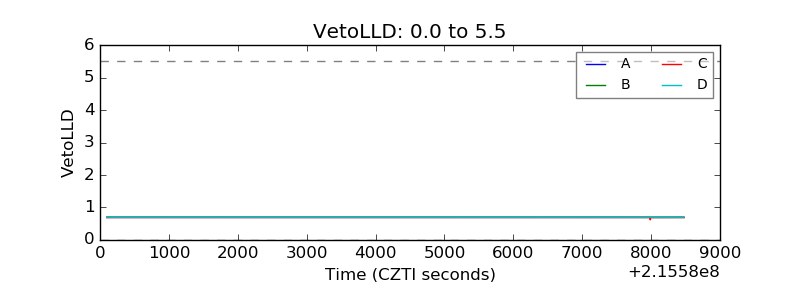 |
| Alpha Counter | 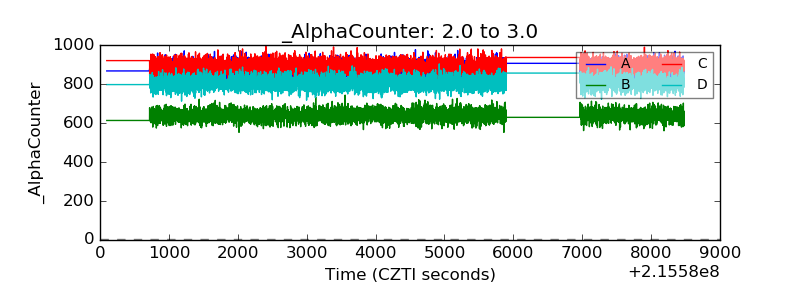 |
| _CPM_Rate | 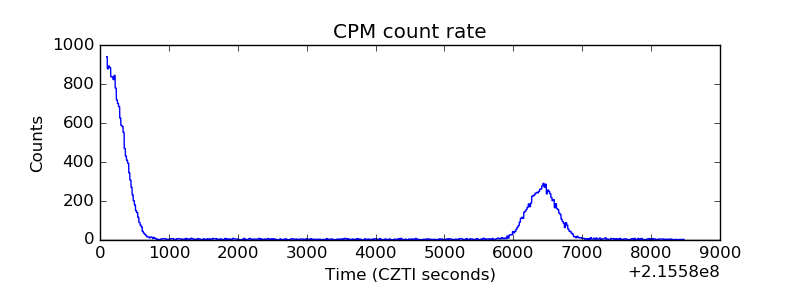 |
| CZT Counter | 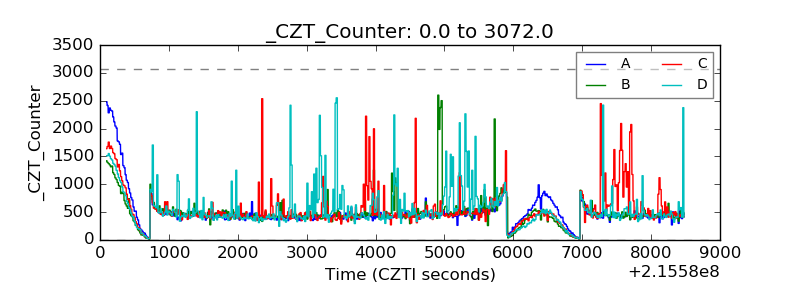 |
| +2.5 Volts monitor | 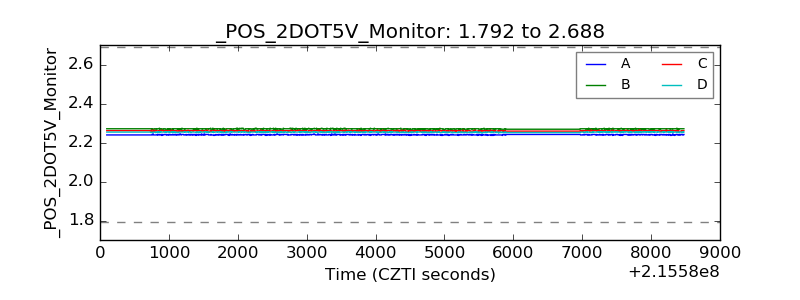 |
| +5 Volts monitor |  |
| _ROLL_ROT | 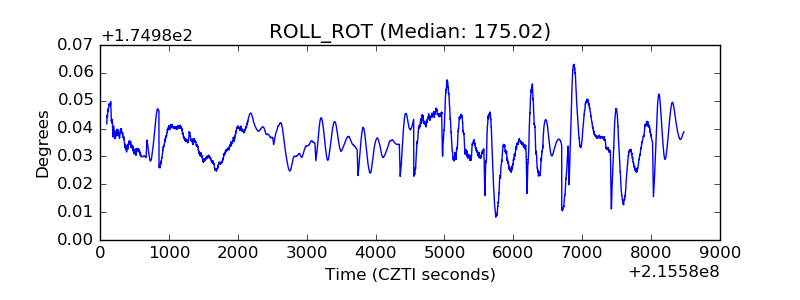 |
| _Roll_DEC | 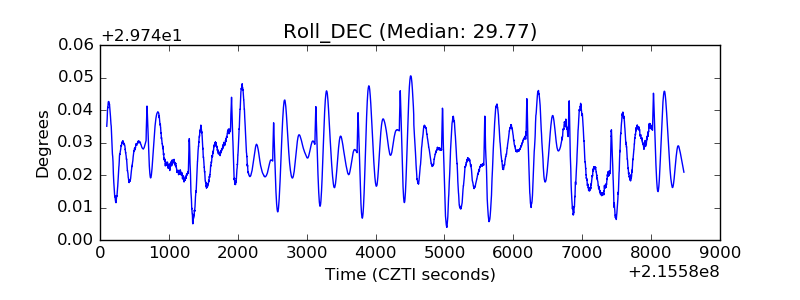 |
| _Roll_RA | 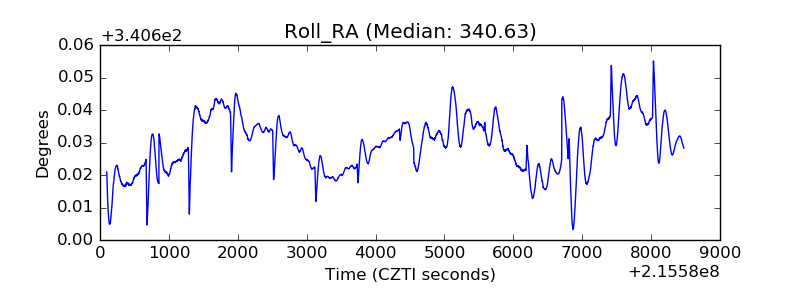 |
| Veto Counter | 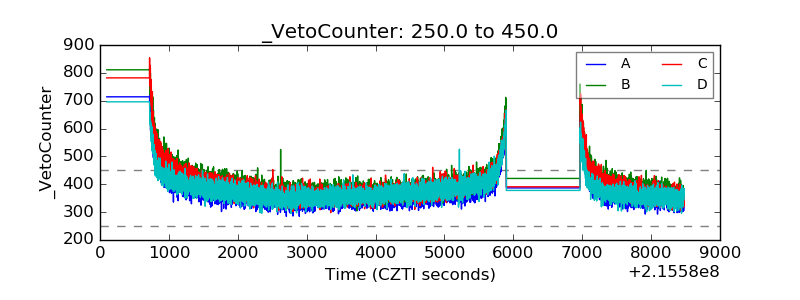 |