| Param | Original file | Final file |
|---|---|---|
| Filename | modeM0/AS1A02_174T01_9000000766_05908cztM0_level2.evt | modeM0/AS1A02_174T01_9000000766_05908cztM0_level2_quad_clean.evt |
| Size (bytes) | 505,255,680 | 70,948,800 |
| Size | 481.8 MB | 67.7 MB |
| Events in quadrant A | 3,132,180 | 428,530 |
| Events in quadrant B | 3,642,181 | 422,101 |
| Events in quadrant C | 4,371,581 | 422,066 |
| Events in quadrant D | 3,696,755 | 404,578 |
| Mode M9 | |||
|---|---|---|---|
| Quadrant | BADHDUFLAG | Total packets | Discarded packets |
| A | 0 | 17 | 0 |
| B | 0 | 17 | 0 |
| C | 0 | 17 | 0 |
| D | 0 | 17 | 0 |
| Mode M0 | |||
|---|---|---|---|
| Quadrant | BADHDUFLAG | Total packets | Discarded packets |
| A | 0 | 15285 | 1218 |
| B | 0 | 16508 | 1292 |
| C | 0 | 19219 | 1546 |
| D | 0 | 17094 | 1434 |
| Mode SS | |||
|---|---|---|---|
| Quadrant | BADHDUFLAG | Total packets | Discarded packets |
| A | 0 | 157 | 19 |
| B | 0 | 155 | 11 |
| C | 0 | 159 | 15 |
| D | 0 | 158 | 16 |
| Quadrant | Total seconds | Saturated seconds | Saturation percentage |
|---|---|---|---|
| A | 6757 | 119 | 1.761137% |
| B | 6750 | 244 | 3.614815% |
| C | 6734 | 376 | 5.583606% |
| D | 6740 | 148 | 2.195846% |
Noise dominated data is calculated using 1-second bins in cleaned event files. If a bin has >2000 counts, and if more than 50% of those come from <1% of pixels, then it is considered to be noise-dominated and hence unusable.
| Quadrant | # 1 sec bins | Bins with >0 counts | Bins with >2000 counts | High rate bins dominated by noise | Noise dominated (total time) | Noise dominated (detector-on time) | Marked lightcurve |
|---|---|---|---|---|---|---|---|
| A | 9532 | 6855 | 0 | 0 | 0.00% | 0.00% | 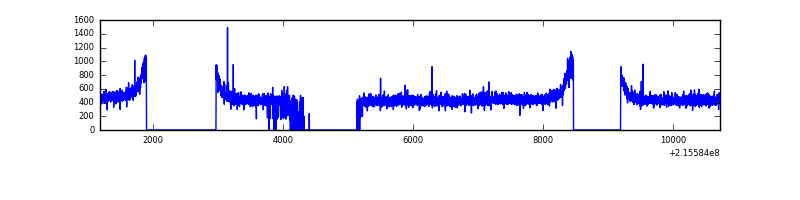 |
| B | 9532 | 6843 | 64 | 64 | 0.67% | 0.94% | 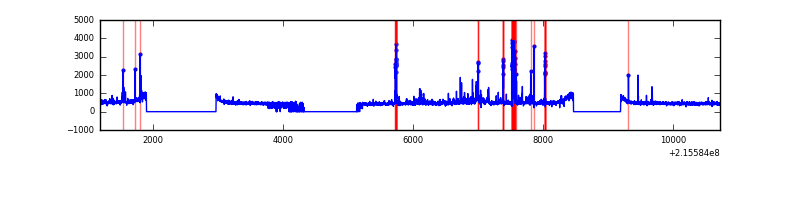 |
| C | 9532 | 6835 | 215 | 215 | 2.26% | 3.15% | 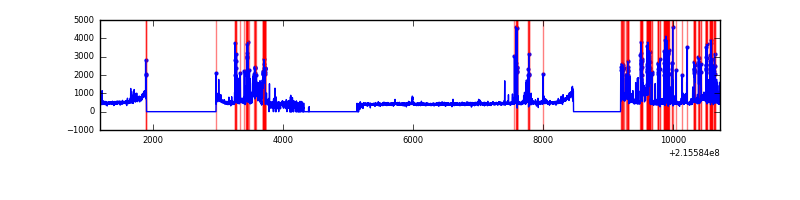 |
| D | 9532 | 6843 | 49 | 49 | 0.51% | 0.72% | 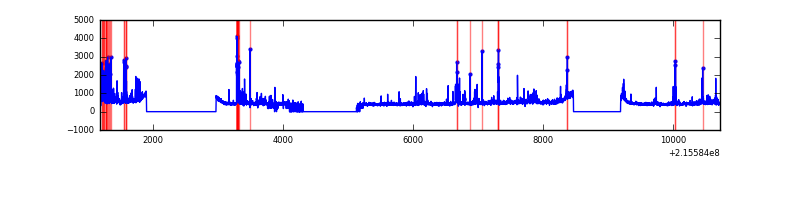 |
Top three noisy pixels from each quadrant. If the there are fewer than three noisy pixels in the level2.evt file, extra rows are filled as -1
| Pixel properties | Quadrant properties | ||||||
|---|---|---|---|---|---|---|---|
| Quadrant | DetID | PixID | Counts | Sigma | Mean | Median | Sigma |
| A | 12 | 194 | 7923 | 41.98 | 813 | 794 | 169.8 |
| A | 0 | 226 | 7757 | 41.0 | 813 | 794 | 169.8 |
| A | 7 | 16 | 5791 | 29.42 | 813 | 794 | 169.8 |
| B | 15 | 255 | 255629 | 1605.2 | 815 | 796 | 158.8 |
| B | 15 | 204 | 89837 | 560.87 | 815 | 796 | 158.8 |
| B | 0 | 214 | 75303 | 469.32 | 815 | 796 | 158.8 |
| C | 9 | 247 | 1352036 | 7456.09 | 773 | 777 | 181.2 |
| C | 13 | 61 | 6016 | 28.91 | 773 | 777 | 181.2 |
| C | 4 | 239 | 2478 | 9.39 | 773 | 777 | 181.2 |
| D | 2 | 152 | 392654 | 2018.76 | 784 | 757 | 194.1 |
| D | 8 | 195 | 97724 | 499.5 | 784 | 757 | 194.1 |
| D | 2 | 63 | 83219 | 424.78 | 784 | 757 | 194.1 |
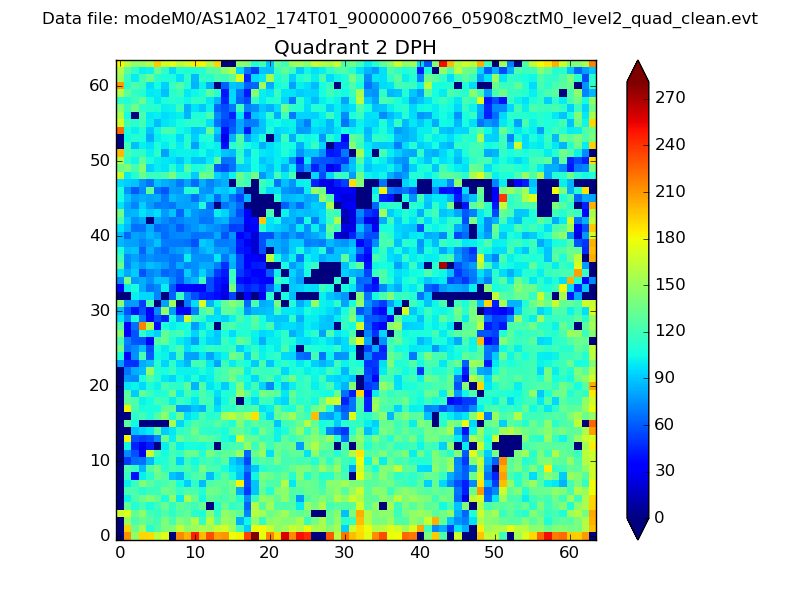
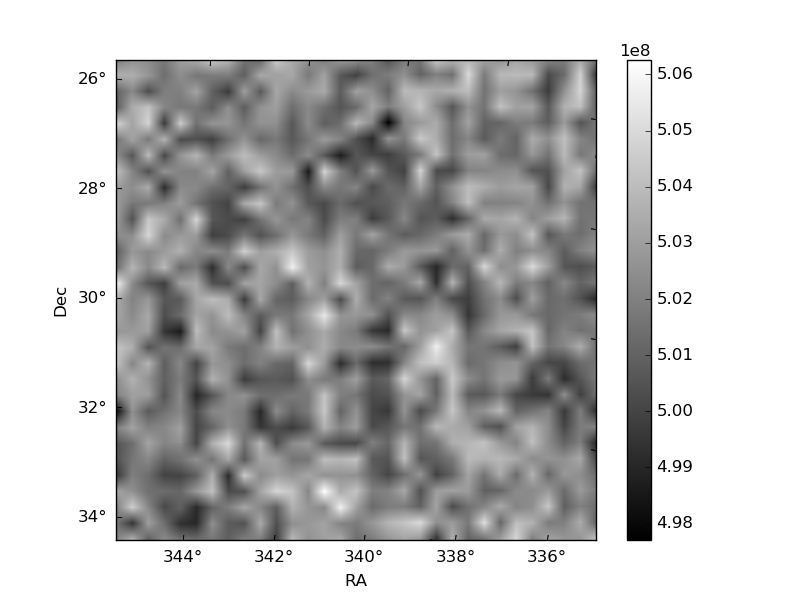
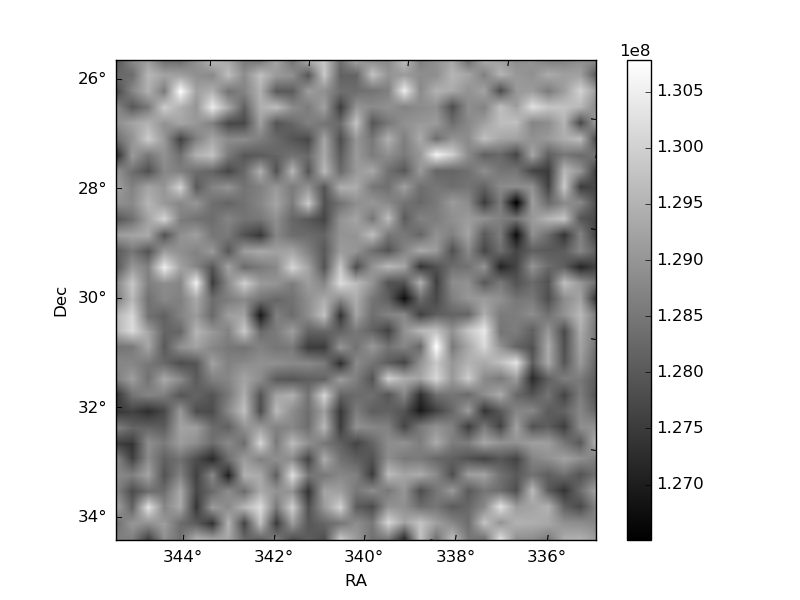
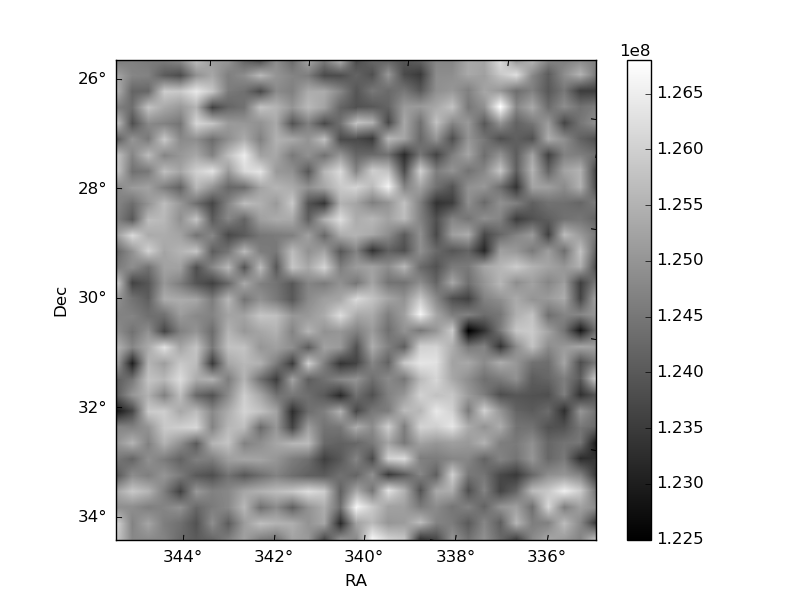
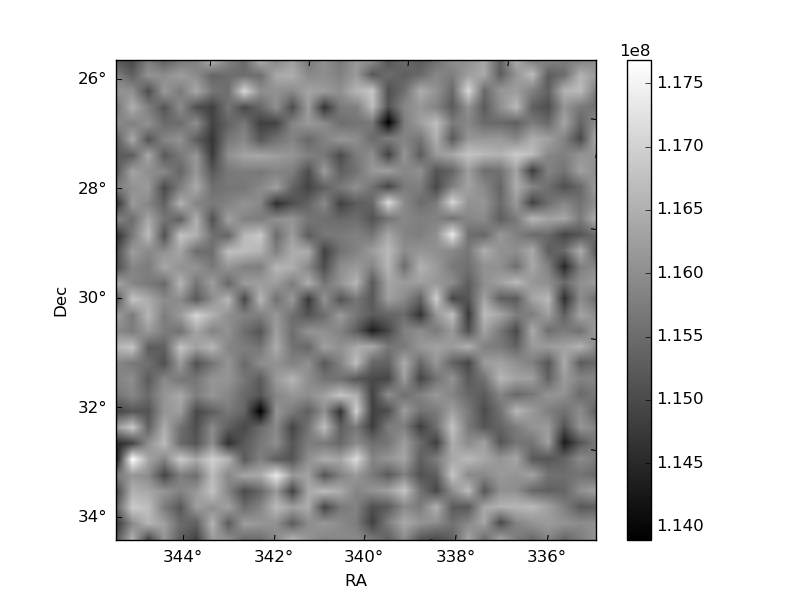
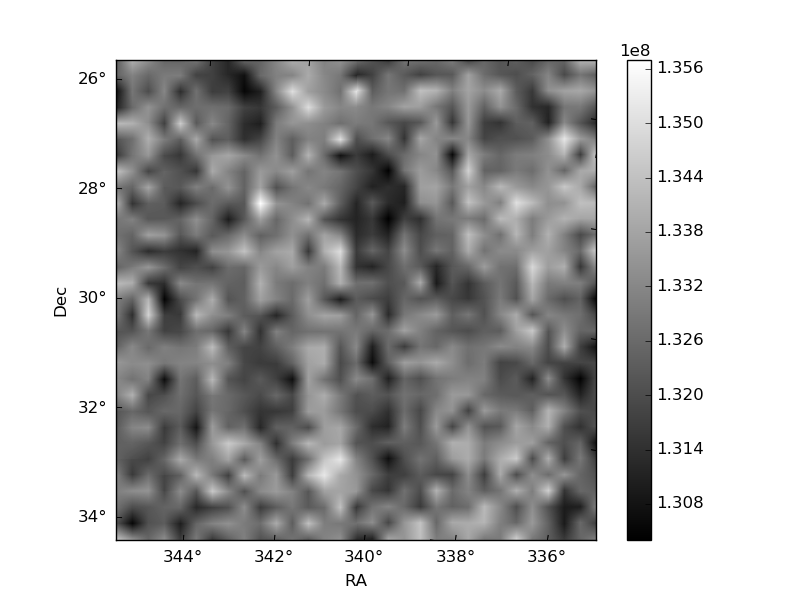
Histogram calculated using DETX and DETY for each event in the final _common_clean file
| Quadrant A | 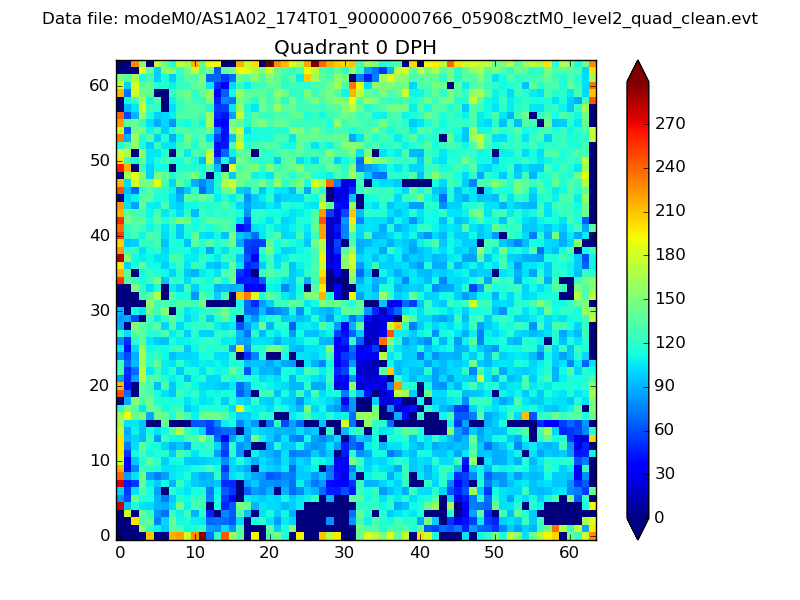 |
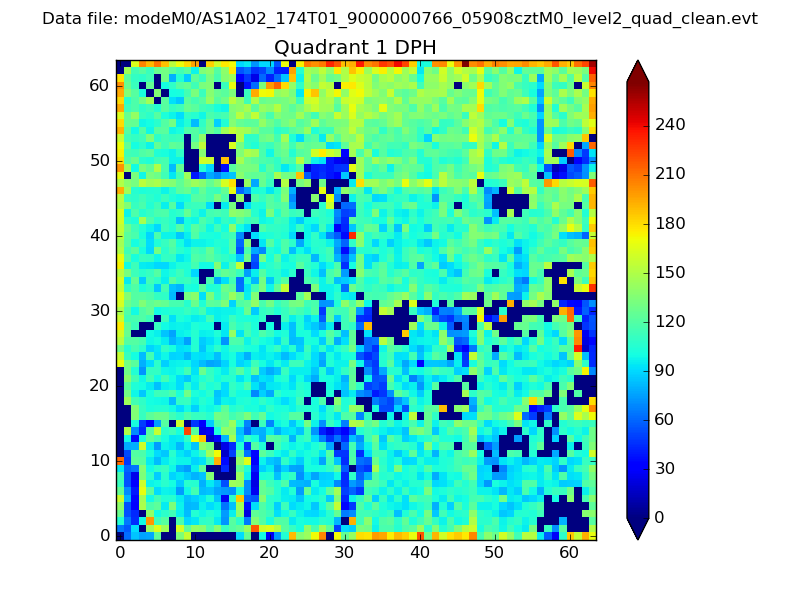 |
Quadrant B |
|---|---|---|---|
| Quadrant D | 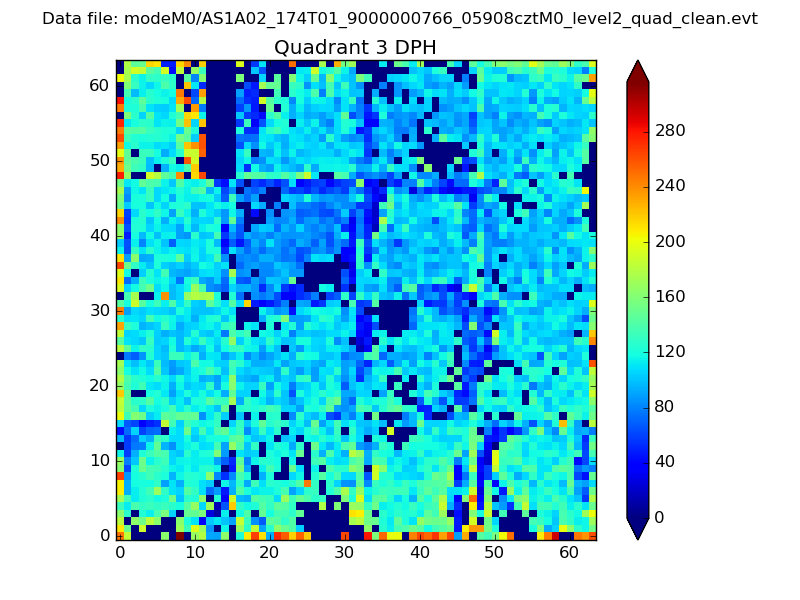 |
 |
Quadrant C |
| Plot type | Count rate plots | Images |
|---|---|---|
| Comparison with Poisson distribution Blue bars denote a histogram of data divided into 1 sec bins. Red curve is a Poisson curve with rate = median count rate of data. |
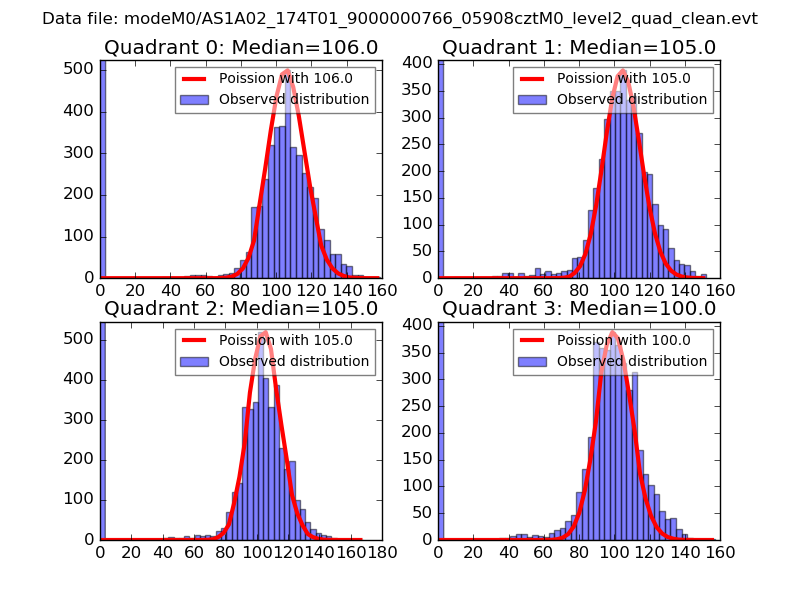 |
 |
| Quadrant-wise count rates Data is divided into 100 sec bins |
 |
|
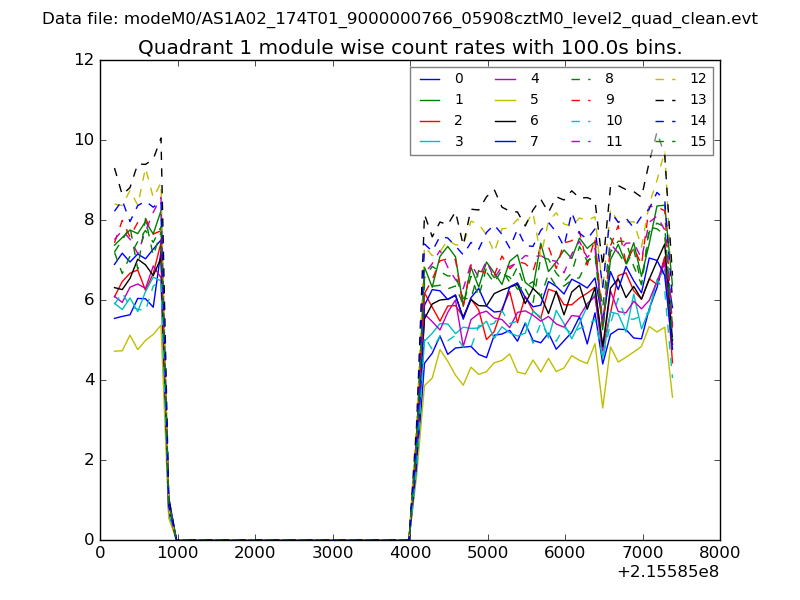
| Module-wise count rates for Quadrant A Data is divided into 100 sec bins |
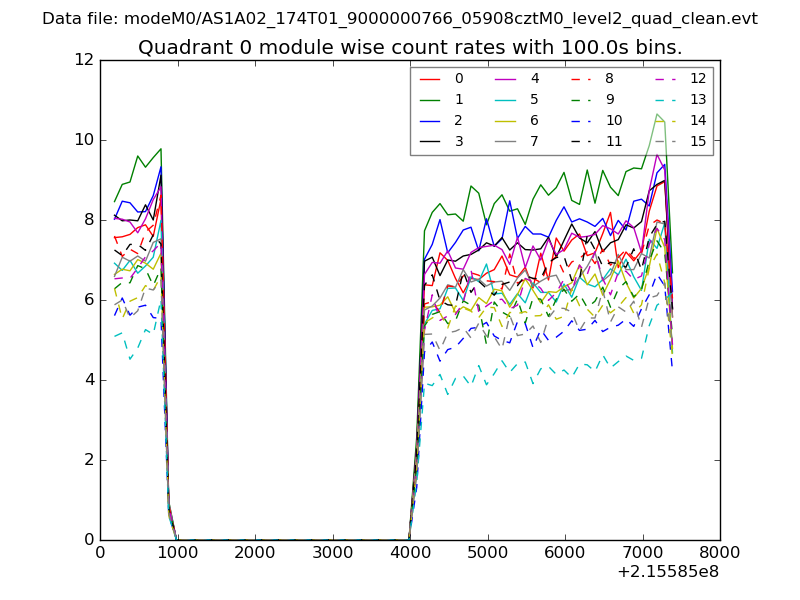 |
 |
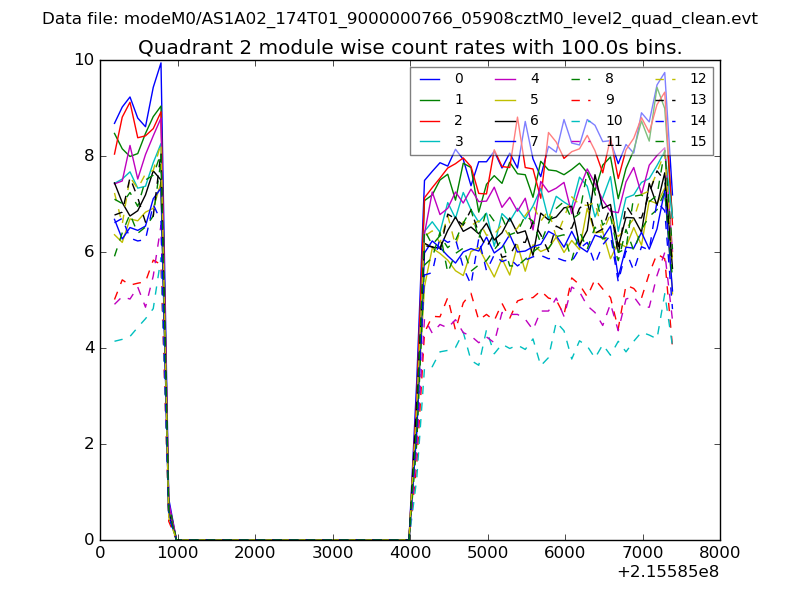
| Module-wise count rates for Quadrant B Data is divided into 100 sec bins |
 |
 |
| Module-wise count rates for Quadrant C Data is divided into 100 sec bins |
 |
 |
| Module-wise count rates for Quadrant D Data is divided into 100 sec bins |
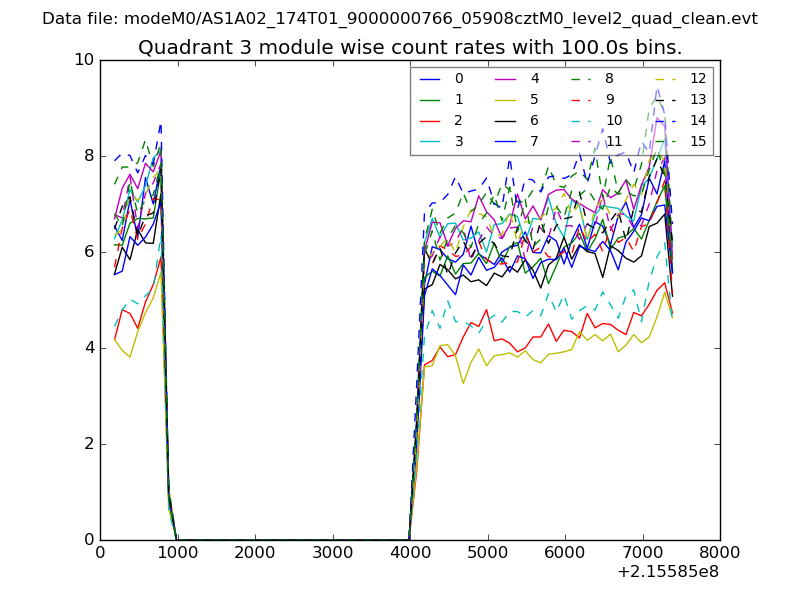 |
 |
| Parameter | Plot |
|---|---|
| CZT HV Monitor | 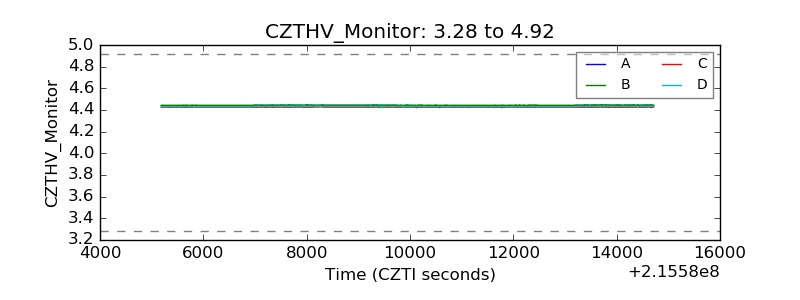 |
| D_VDD | 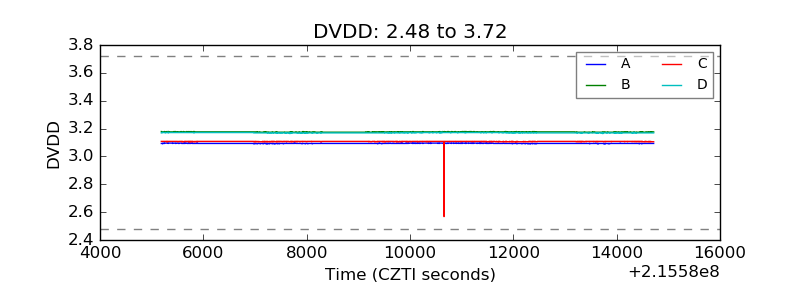 |
| Temperature 1 | 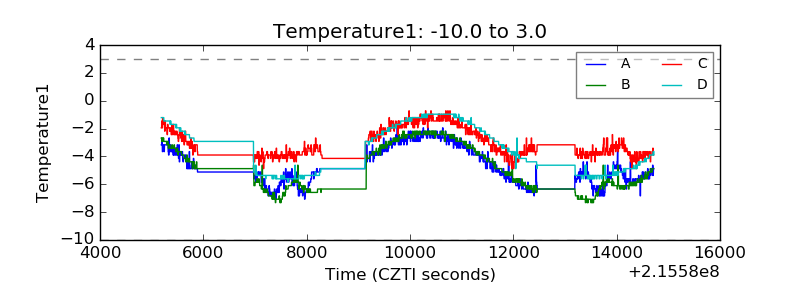 |
| Veto HV Monitor | 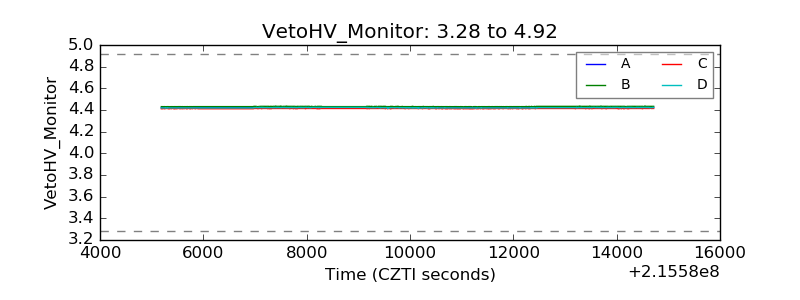 |
| Veto LLD | 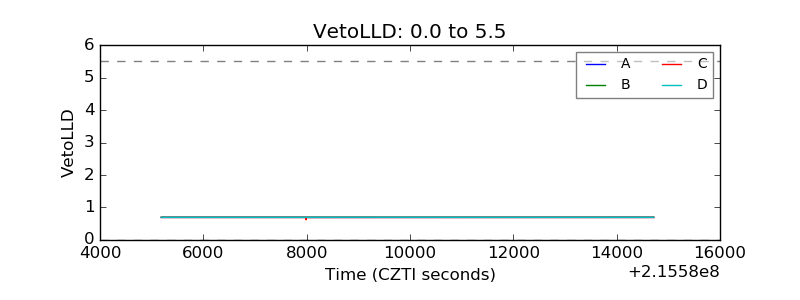 |
| Alpha Counter | 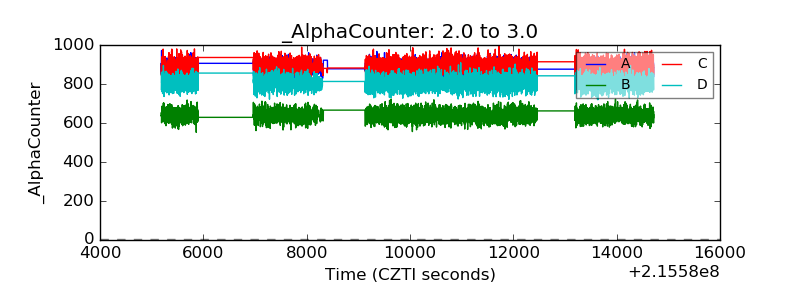 |
| _CPM_Rate | 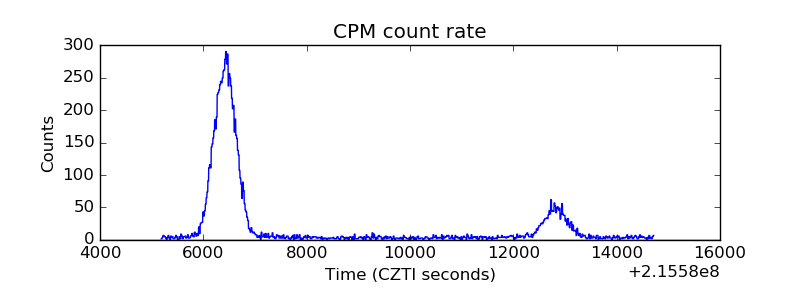 |
| CZT Counter | 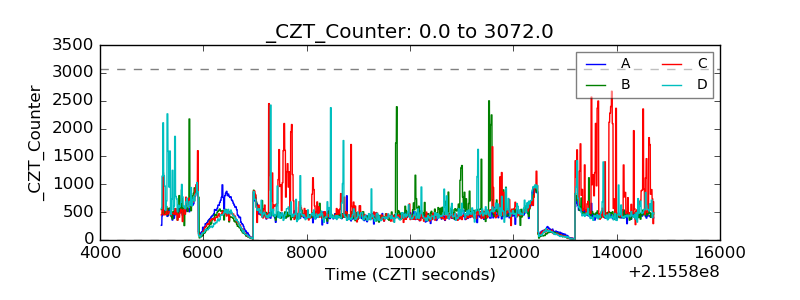 |
| +2.5 Volts monitor | 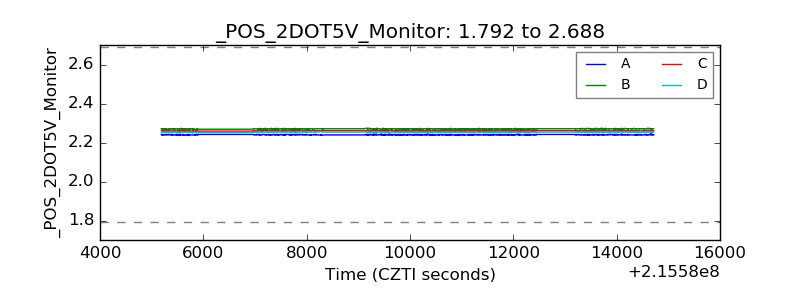 |
| +5 Volts monitor |  |
| _ROLL_ROT | 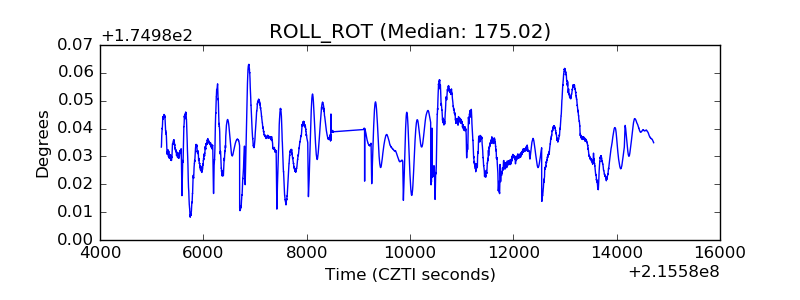 |
| _Roll_DEC | 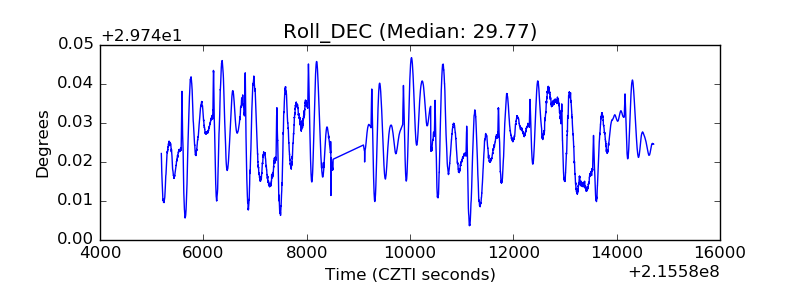 |
| _Roll_RA | 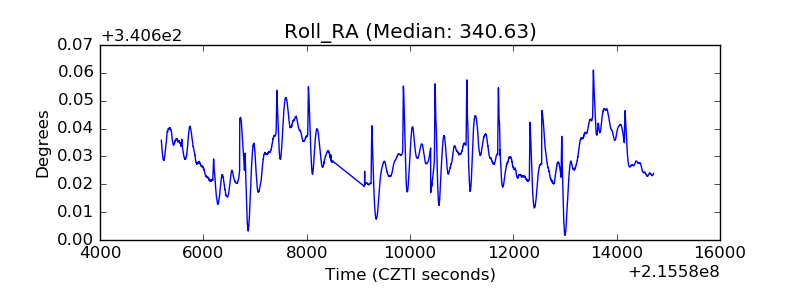 |
| Veto Counter | 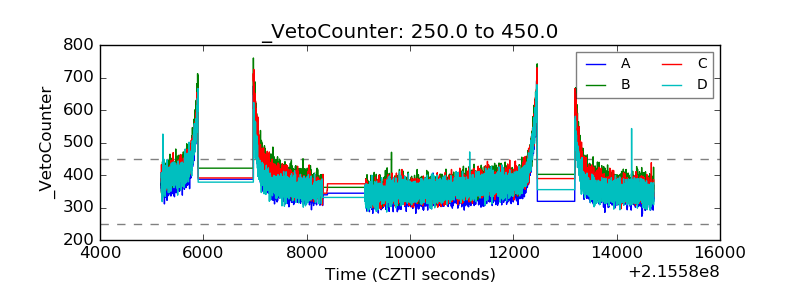 |