| Param | Original file | Final file |
|---|---|---|
| Filename | modeM0/AS1A02_174T01_9000000766_05909cztM0_level2.evt | modeM0/AS1A02_174T01_9000000766_05909cztM0_level2_quad_clean.evt |
| Size (bytes) | 755,245,440 | 112,968,000 |
| Size | 720.3 MB | 107.7 MB |
| Events in quadrant A | 4,751,207 | 688,537 |
| Events in quadrant B | 5,382,967 | 682,696 |
| Events in quadrant C | 6,032,680 | 674,088 |
| Events in quadrant D | 5,977,188 | 632,800 |
| Mode M9 | |||
|---|---|---|---|
| Quadrant | BADHDUFLAG | Total packets | Discarded packets |
| A | 0 | 9 | 2 |
| B | 0 | 9 | 2 |
| C | 0 | 9 | 3 |
| D | 0 | 9 | 3 |
| Mode M0 | |||
|---|---|---|---|
| Quadrant | BADHDUFLAG | Total packets | Discarded packets |
| A | 0 | 26229 | 4210 |
| B | 0 | 27747 | 4518 |
| C | 0 | 32311 | 6803 |
| D | 0 | 30826 | 5733 |
| Mode SS | |||
|---|---|---|---|
| Quadrant | BADHDUFLAG | Total packets | Discarded packets |
| A | 0 | 262 | 46 |
| B | 0 | 262 | 48 |
| C | 0 | 262 | 42 |
| D | 0 | 262 | 40 |
| Quadrant | Total seconds | Saturated seconds | Saturation percentage |
|---|---|---|---|
| A | 10839 | 100 | 0.922594% |
| B | 10773 | 209 | 1.940035% |
| C | 10578 | 304 | 2.873889% |
| D | 10635 | 218 | 2.049835% |
Noise dominated data is calculated using 1-second bins in cleaned event files. If a bin has >2000 counts, and if more than 50% of those come from <1% of pixels, then it is considered to be noise-dominated and hence unusable.
| Quadrant | # 1 sec bins | Bins with >0 counts | Bins with >2000 counts | High rate bins dominated by noise | Noise dominated (total time) | Noise dominated (detector-on time) | Marked lightcurve |
|---|---|---|---|---|---|---|---|
| A | 13767 | 11958 | 0 | 0 | 0.00% | 0.00% | 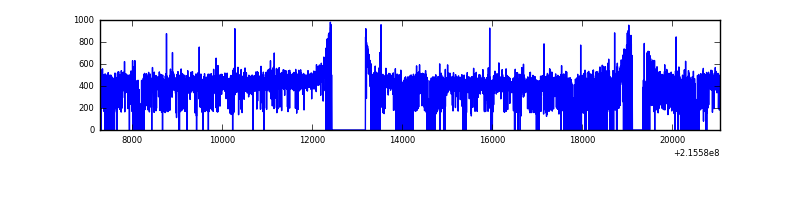 |
| B | 13767 | 11922 | 64 | 64 | 0.46% | 0.54% | 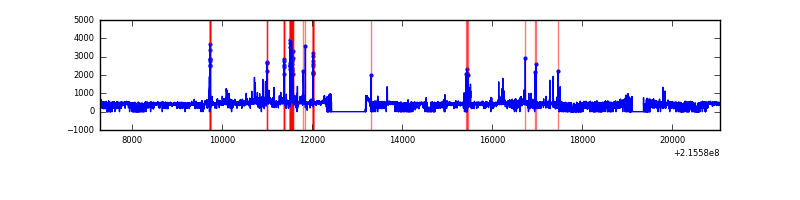 |
| C | 13766 | 11761 | 159 | 159 | 1.16% | 1.35% | 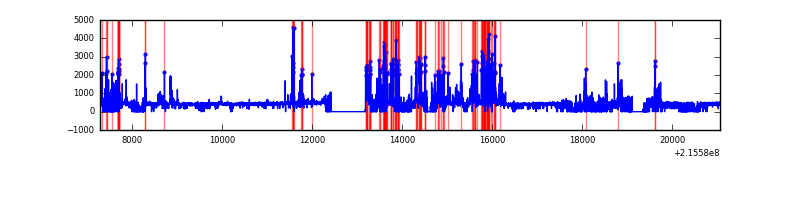 |
| D | 13767 | 11827 | 122 | 122 | 0.89% | 1.03% | 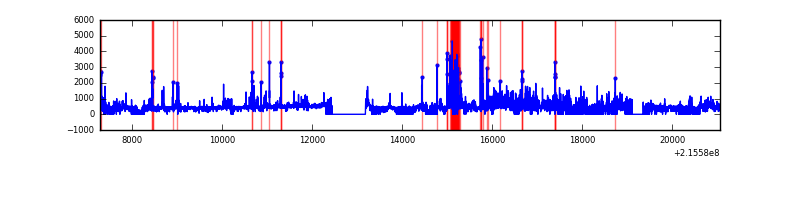 |
Top three noisy pixels from each quadrant. If the there are fewer than three noisy pixels in the level2.evt file, extra rows are filled as -1
| Pixel properties | Quadrant properties | ||||||
|---|---|---|---|---|---|---|---|
| Quadrant | DetID | PixID | Counts | Sigma | Mean | Median | Sigma |
| A | 12 | 194 | 11999 | 42.61 | 1234 | 1204 | 253.4 |
| A | 0 | 226 | 11865 | 42.08 | 1234 | 1204 | 253.4 |
| A | 13 | 254 | 5345 | 16.34 | 1234 | 1204 | 253.4 |
| B | 15 | 255 | 297665 | 1259.57 | 1232 | 1202 | 235.4 |
| B | 0 | 214 | 96052 | 402.99 | 1232 | 1202 | 235.4 |
| B | 15 | 204 | 94483 | 396.32 | 1232 | 1202 | 235.4 |
| C | 9 | 247 | 1509075 | 5605.28 | 1158 | 1164 | 269.0 |
| C | 13 | 61 | 9100 | 29.5 | 1158 | 1164 | 269.0 |
| C | 8 | 222 | 3536 | 8.82 | 1158 | 1164 | 269.0 |
| D | 2 | 152 | 769116 | 2679.77 | 1166 | 1128 | 286.6 |
| D | 2 | 63 | 358887 | 1248.34 | 1166 | 1128 | 286.6 |
| D | 8 | 195 | 232452 | 807.17 | 1166 | 1128 | 286.6 |
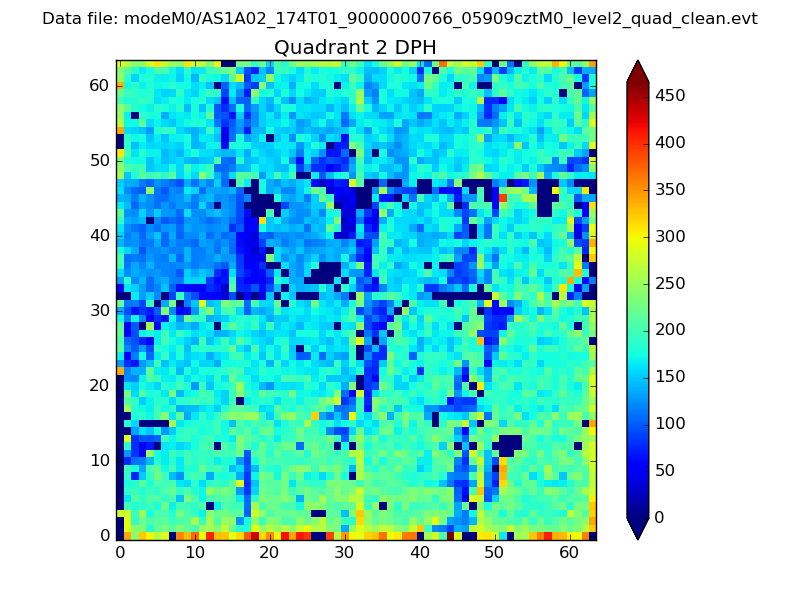
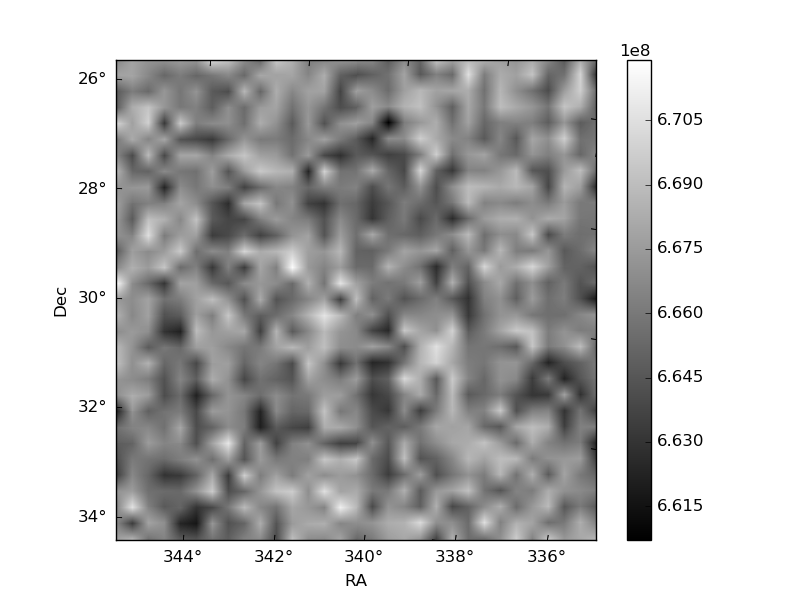
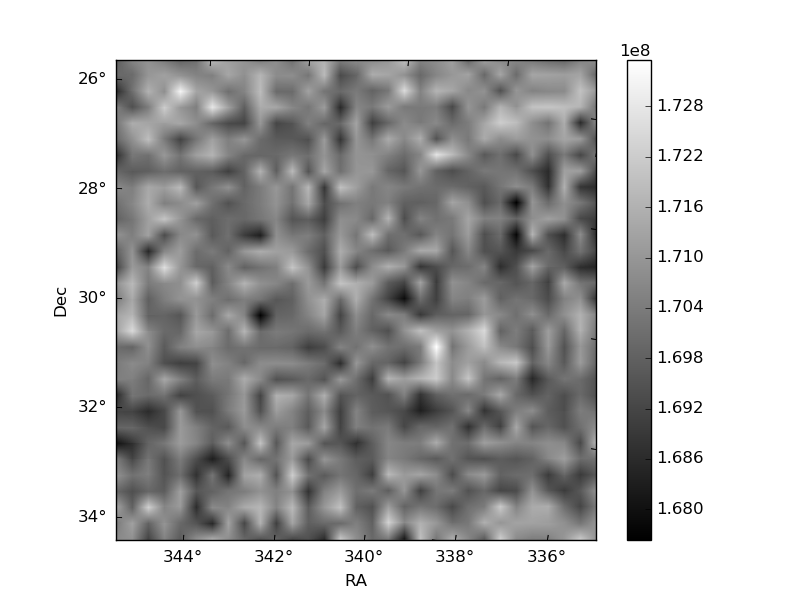
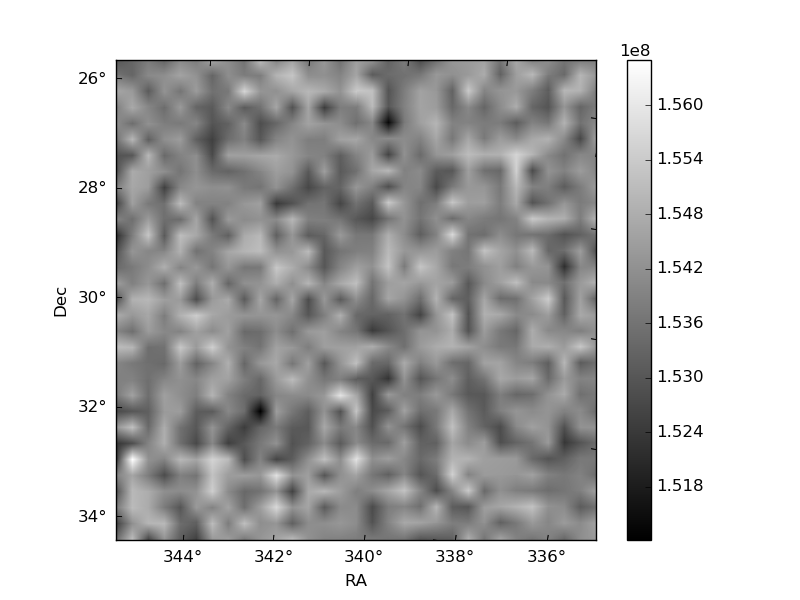
Histogram calculated using DETX and DETY for each event in the final _common_clean file
| Quadrant A | 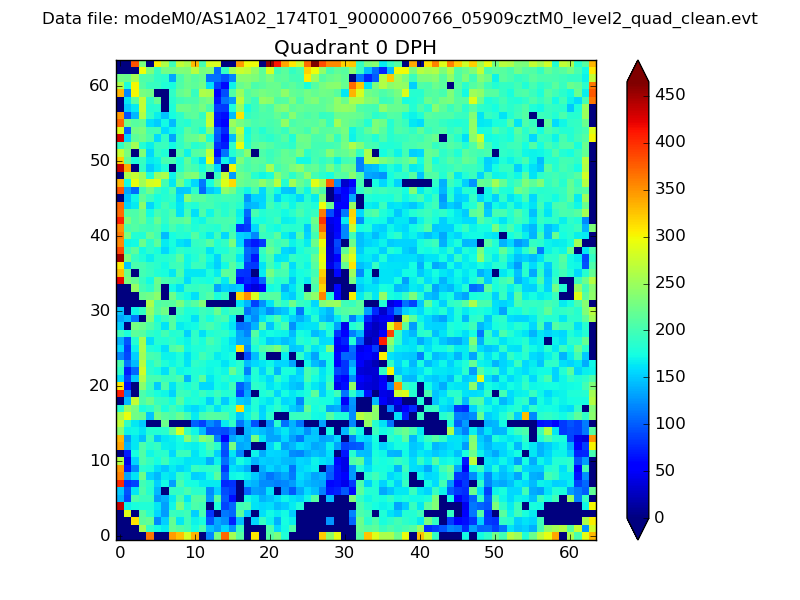 |
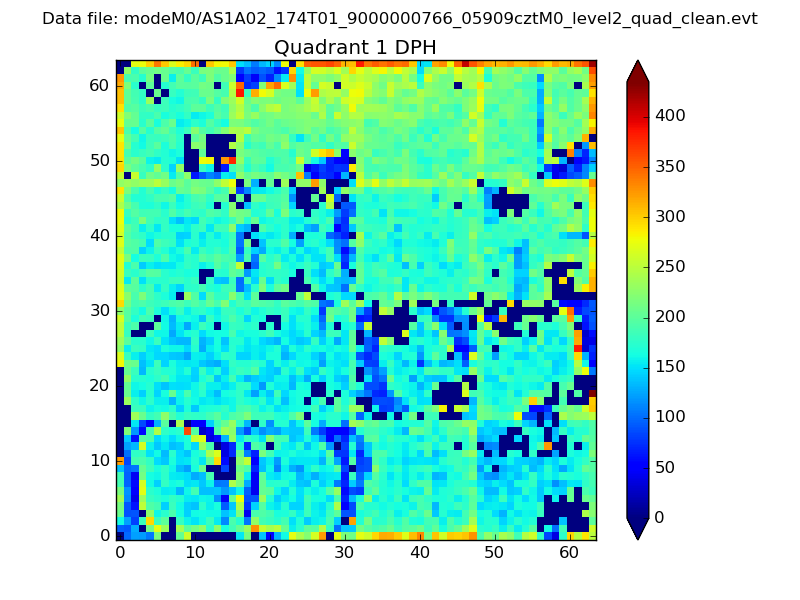 |
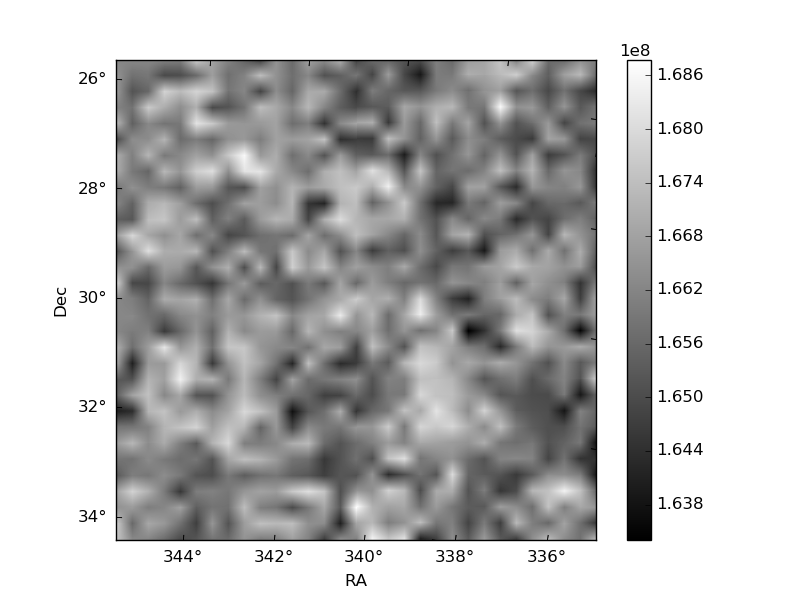
Quadrant B |
|---|---|---|---|
| Quadrant D | 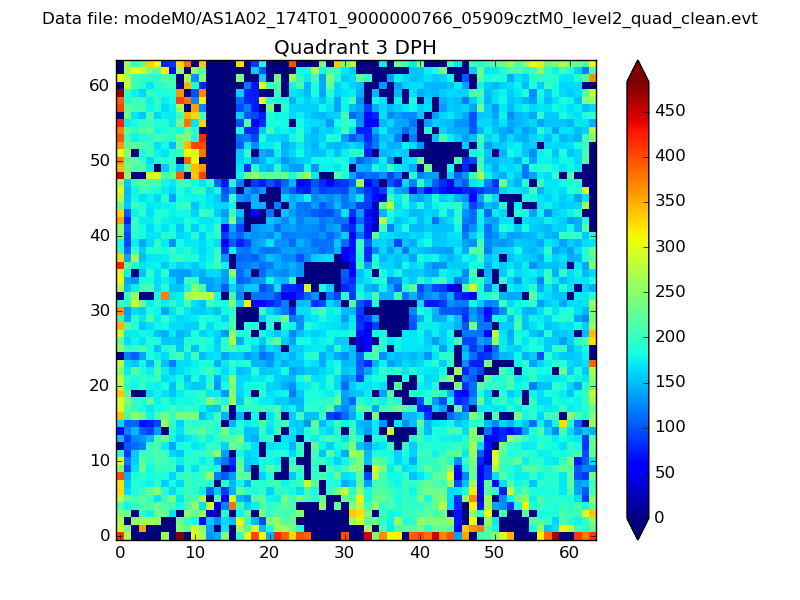 |
 |
Quadrant C |
| Plot type | Count rate plots | Images |
|---|---|---|
| Comparison with Poisson distribution Blue bars denote a histogram of data divided into 1 sec bins. Red curve is a Poisson curve with rate = median count rate of data. |
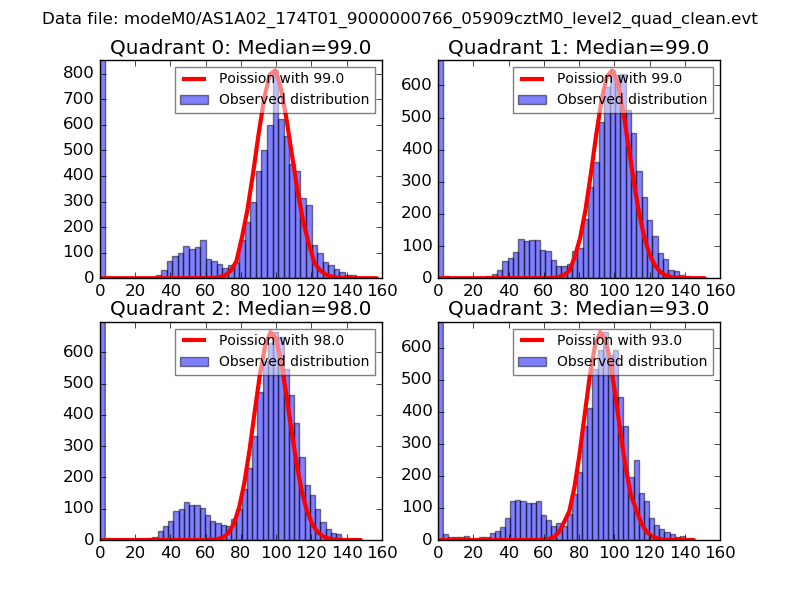 |
 |
| Quadrant-wise count rates Data is divided into 100 sec bins |
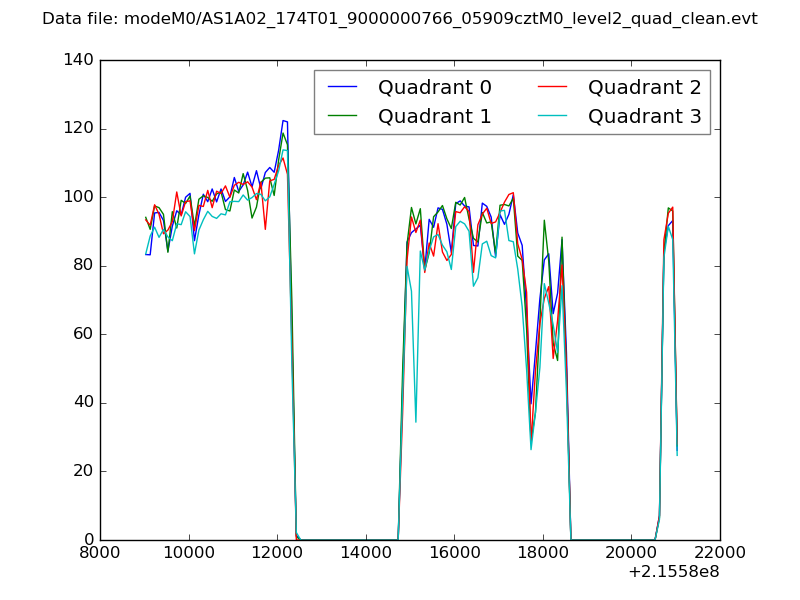 |
|
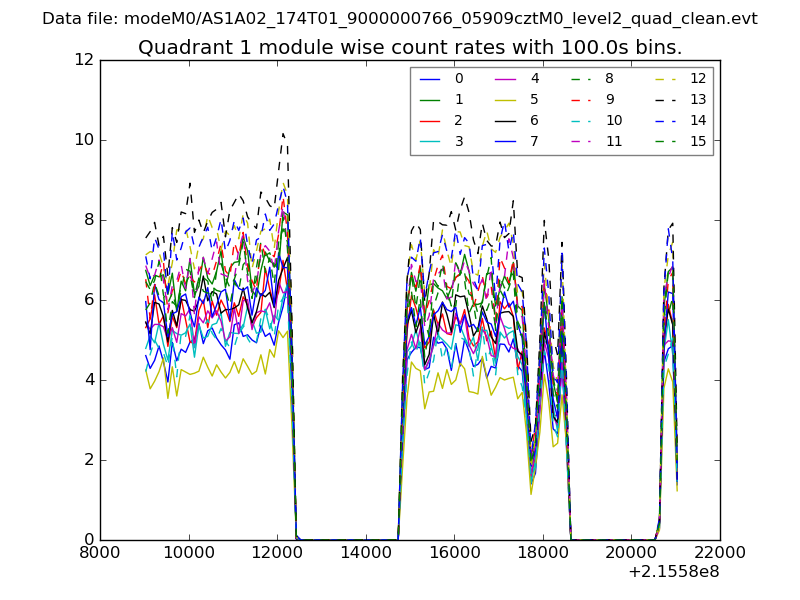
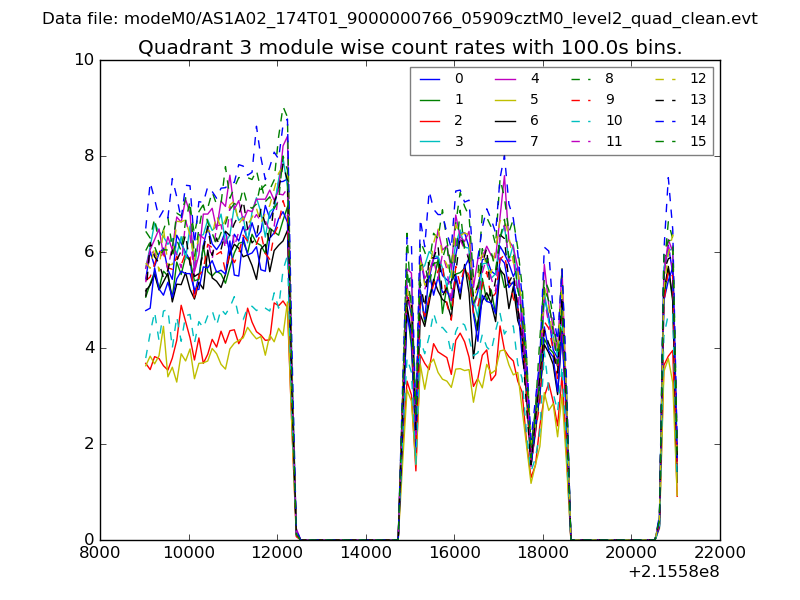
| Module-wise count rates for Quadrant A Data is divided into 100 sec bins |
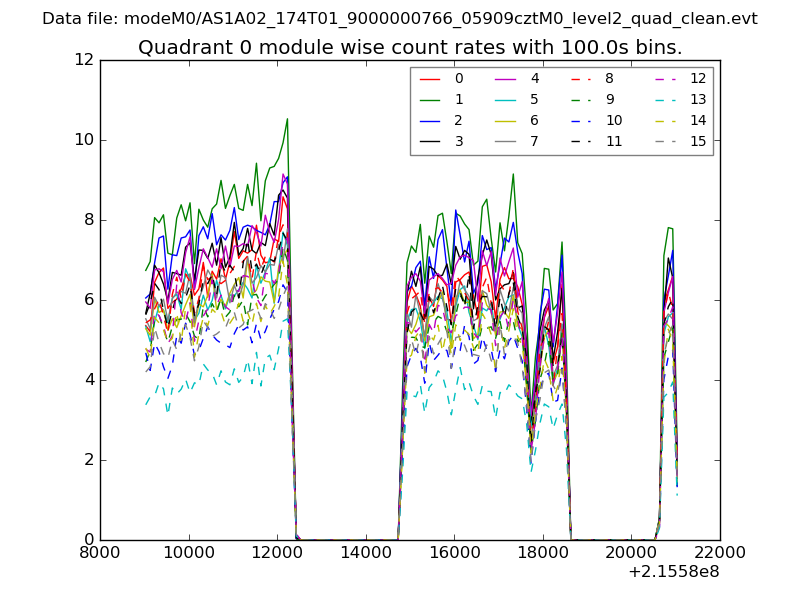 |
 |
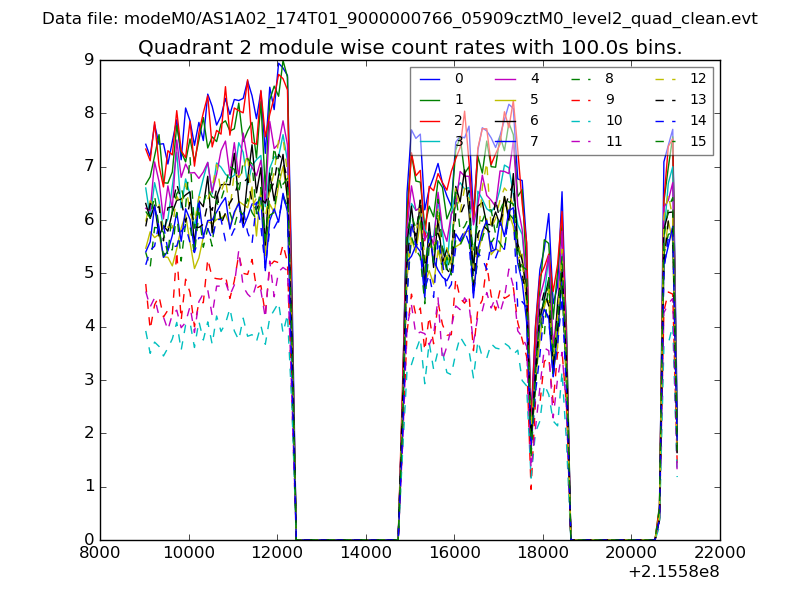
| Module-wise count rates for Quadrant B Data is divided into 100 sec bins |
 |
 |
| Module-wise count rates for Quadrant C Data is divided into 100 sec bins |
 |
 |
| Module-wise count rates for Quadrant D Data is divided into 100 sec bins |
 |
 |
| Parameter | Plot |
|---|---|
| CZT HV Monitor | 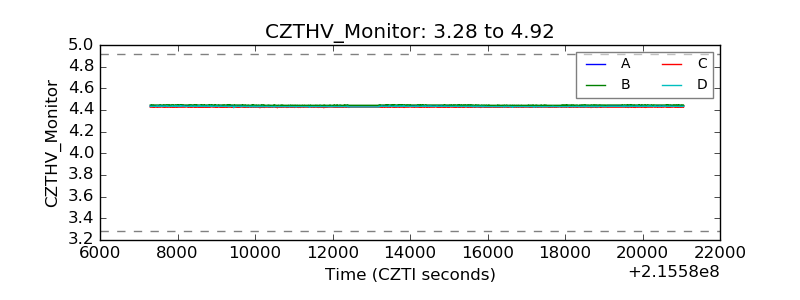 |
| D_VDD | 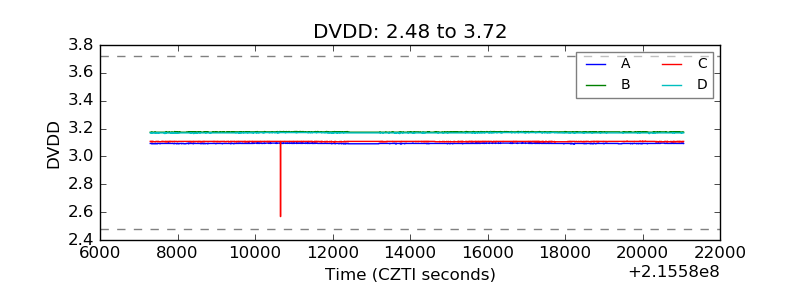 |
| Temperature 1 | 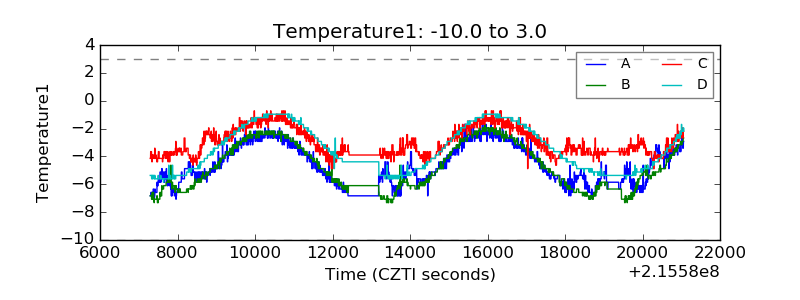 |
| Veto HV Monitor | 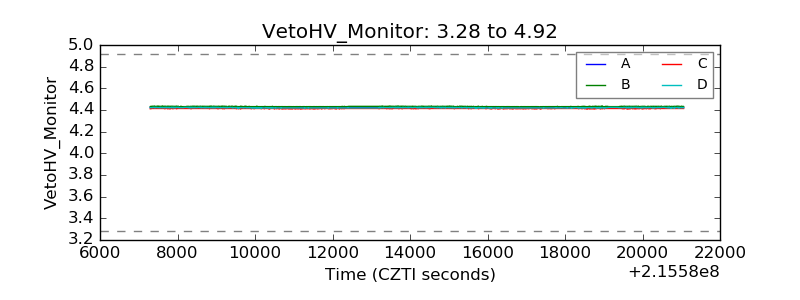 |
| Veto LLD | 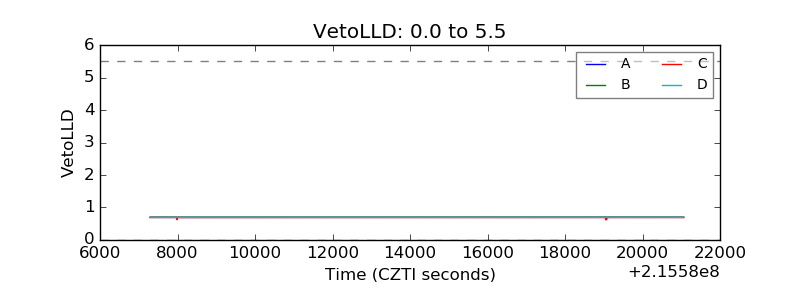 |
| Alpha Counter | 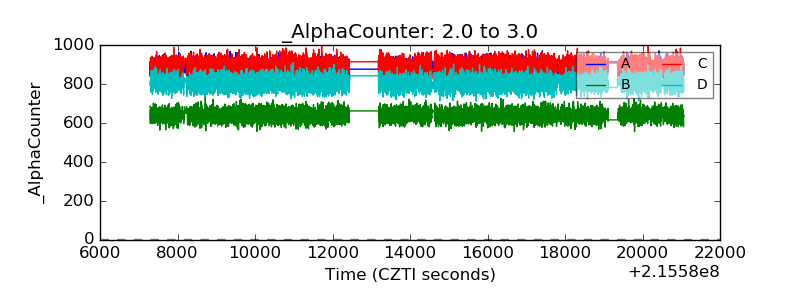 |
| _CPM_Rate | 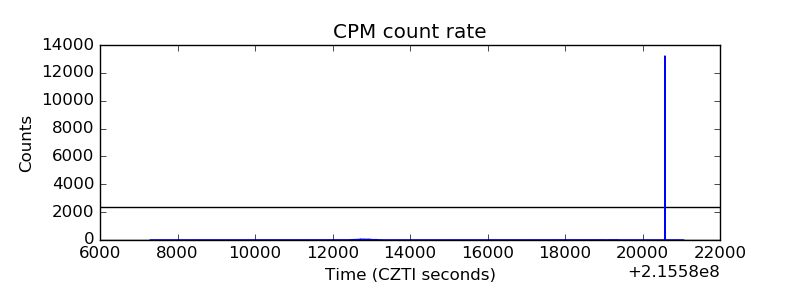 |
| CZT Counter | 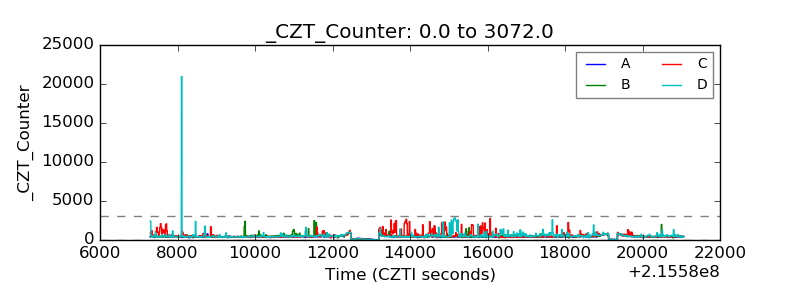 |
| +2.5 Volts monitor |  |
| +5 Volts monitor |  |
| _ROLL_ROT | 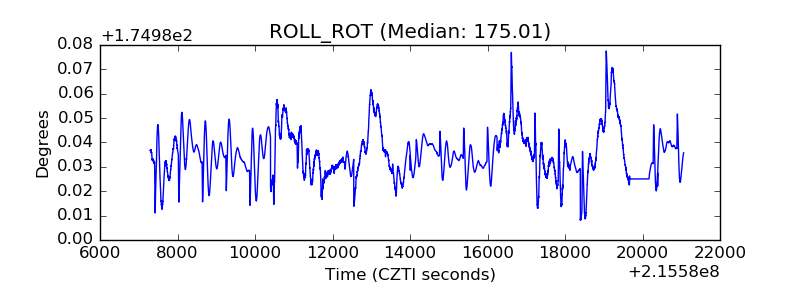 |
| _Roll_DEC | 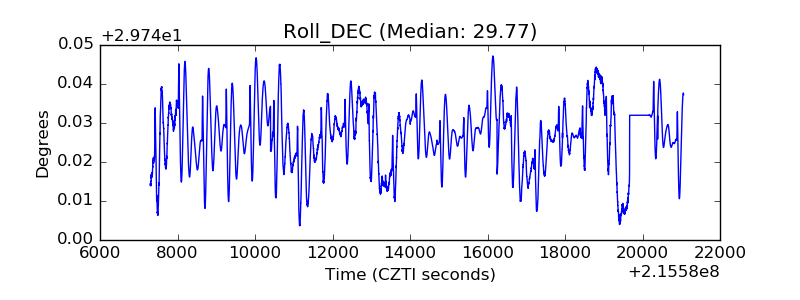 |
| _Roll_RA | 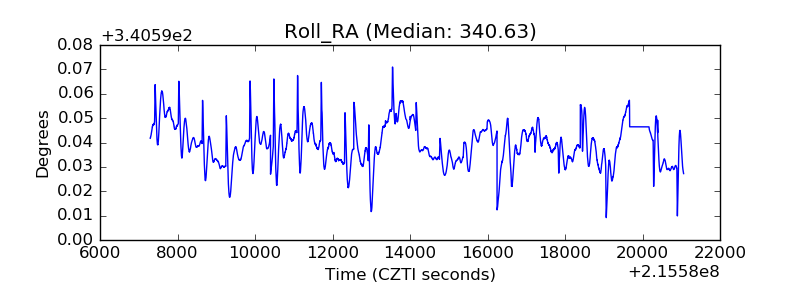 |
| Veto Counter | 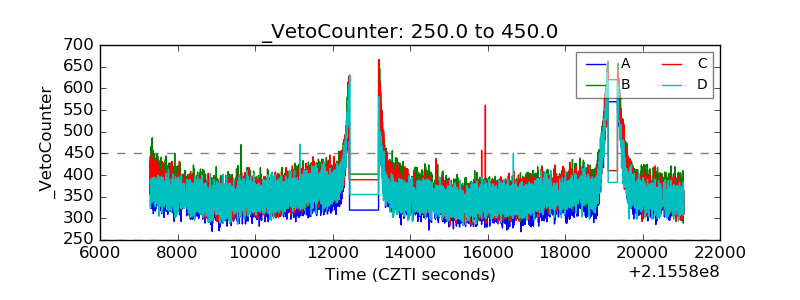 |