| Param | Original file | Final file |
|---|---|---|
| Filename | modeM0/AS1A02_174T01_9000000766_05910cztM0_level2.evt | modeM0/AS1A02_174T01_9000000766_05910cztM0_level2_quad_clean.evt |
| Size (bytes) | 337,530,240 | 50,014,080 |
| Size | 321.9 MB | 47.7 MB |
| Events in quadrant A | 1,322,551 | 213,846 |
| Events in quadrant B | 2,809,200 | 320,974 |
| Events in quadrant C | 2,595,752 | 326,426 |
| Events in quadrant D | 3,147,930 | 297,769 |
| Mode M9 | |||
|---|---|---|---|
| Quadrant | BADHDUFLAG | Total packets | Discarded packets |
| A | 0 | 2 | 0 |
| B | 0 | 2 | 0 |
| C | 0 | 2 | 0 |
| D | 0 | 2 | 0 |
| Mode M0 | |||
|---|---|---|---|
| Quadrant | BADHDUFLAG | Total packets | Discarded packets |
| A | 0 | 16484 | 10283 |
| B | 0 | 17290 | 5105 |
| C | 0 | 16699 | 4784 |
| D | 0 | 19168 | 6103 |
| Mode SS | |||
|---|---|---|---|
| Quadrant | BADHDUFLAG | Total packets | Discarded packets |
| A | 0 | 164 | 54 |
| B | 0 | 161 | 31 |
| C | 0 | 164 | 42 |
| D | 0 | 164 | 48 |
| Quadrant | Total seconds | Saturated seconds | Saturation percentage |
|---|---|---|---|
| A | 3011 | 88 | 2.922617% |
| B | 5663 | 268 | 4.732474% |
| C | 5717 | 124 | 2.168970% |
| D | 5595 | 174 | 3.109920% |
Noise dominated data is calculated using 1-second bins in cleaned event files. If a bin has >2000 counts, and if more than 50% of those come from <1% of pixels, then it is considered to be noise-dominated and hence unusable.
| Quadrant | # 1 sec bins | Bins with >0 counts | Bins with >2000 counts | High rate bins dominated by noise | Noise dominated (total time) | Noise dominated (detector-on time) | Marked lightcurve |
|---|---|---|---|---|---|---|---|
| A | 4630 | 3649 | 0 | 0 | 0.00% | 0.00% | 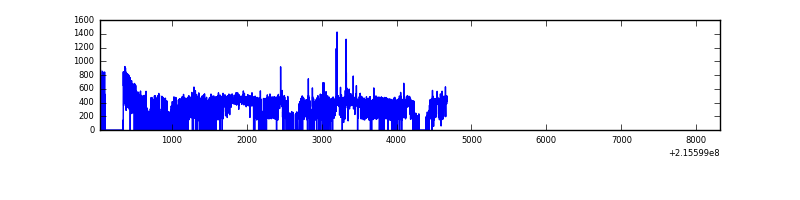 |
| B | 8271 | 6679 | 14 | 14 | 0.17% | 0.21% | 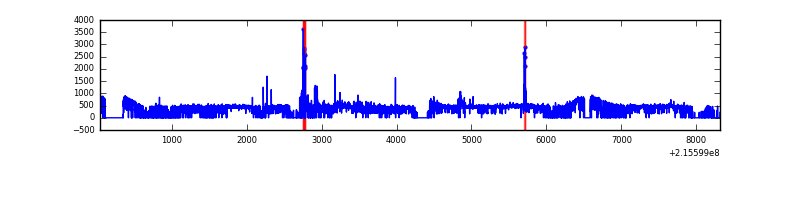 |
| C | 8269 | 6677 | 0 | 0 | 0.00% | 0.00% | 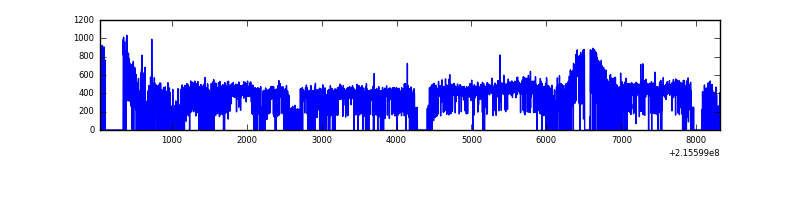 |
| D | 8209 | 6633 | 15 | 15 | 0.18% | 0.23% |  |
Top three noisy pixels from each quadrant. If the there are fewer than three noisy pixels in the level2.evt file, extra rows are filled as -1
| Pixel properties | Quadrant properties | ||||||
|---|---|---|---|---|---|---|---|
| Quadrant | DetID | PixID | Counts | Sigma | Mean | Median | Sigma |
| A | 7 | 16 | 9141 | 122.24 | 340 | 332 | 72.1 |
| A | 15 | 236 | 3380 | 42.3 | 340 | 332 | 72.1 |
| A | 0 | 226 | 3336 | 41.69 | 340 | 332 | 72.1 |
| B | 0 | 214 | 52519 | 397.87 | 670 | 652 | 130.4 |
| B | 15 | 255 | 41031 | 309.75 | 670 | 652 | 130.4 |
| B | 0 | 219 | 37246 | 280.71 | 670 | 652 | 130.4 |
| C | 9 | 247 | 25030 | 158.62 | 656 | 657 | 153.7 |
| C | 13 | 61 | 5188 | 29.49 | 656 | 657 | 153.7 |
| C | 8 | 128 | 4288 | 23.63 | 656 | 657 | 153.7 |
| D | 8 | 195 | 275769 | 1722.69 | 642 | 619 | 159.7 |
| D | 2 | 152 | 199436 | 1244.77 | 642 | 619 | 159.7 |
| D | 1 | 20 | 161200 | 1005.38 | 642 | 619 | 159.7 |
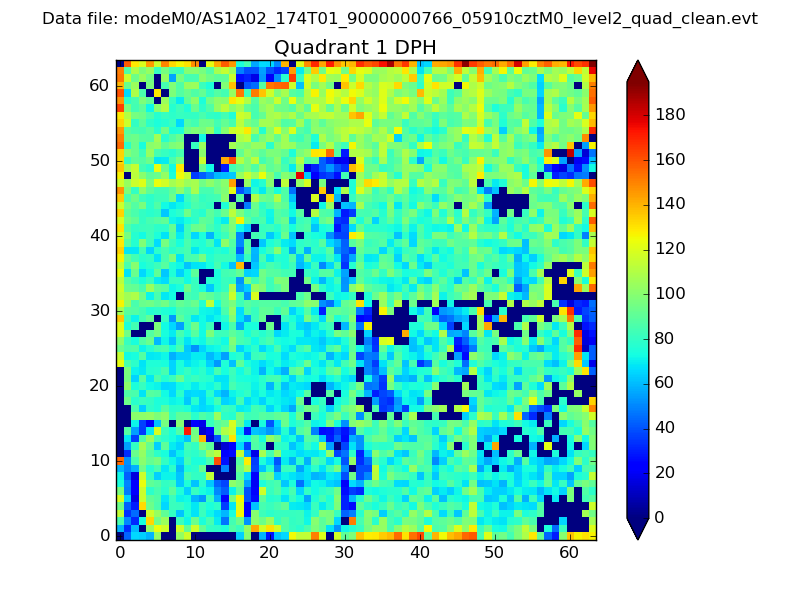
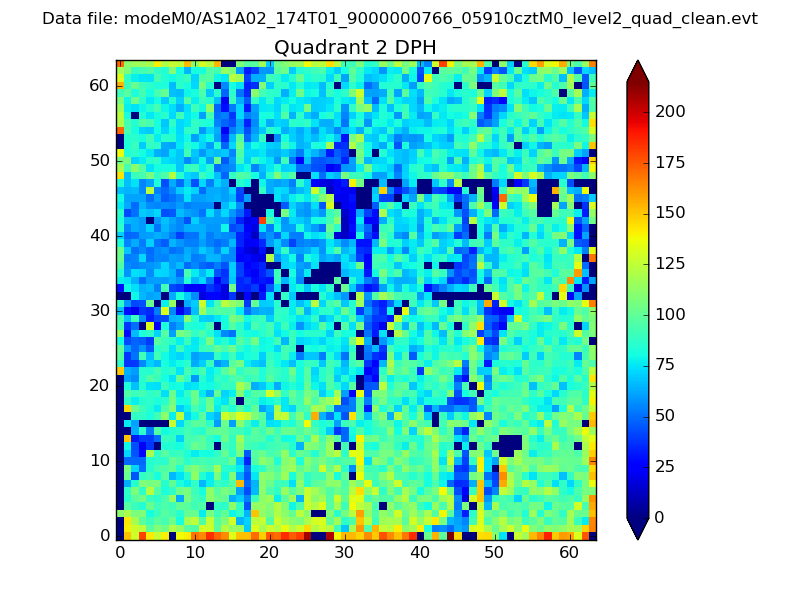
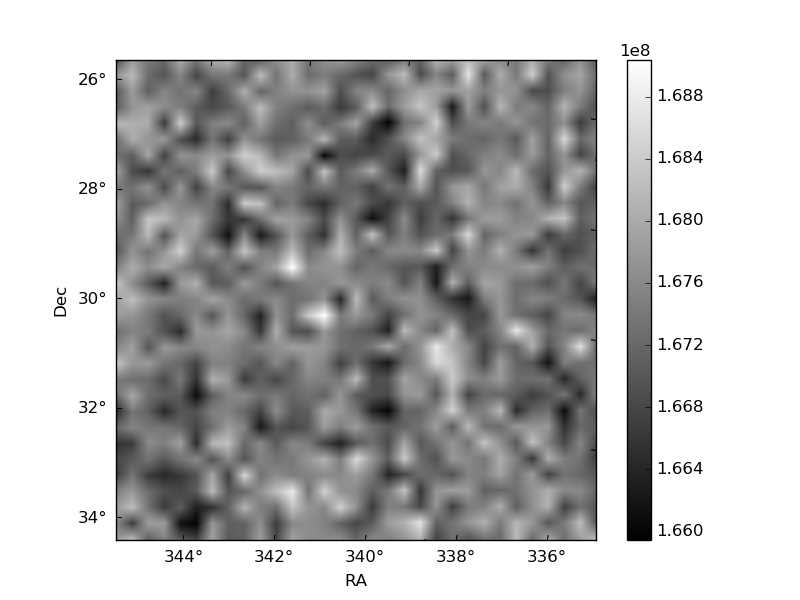
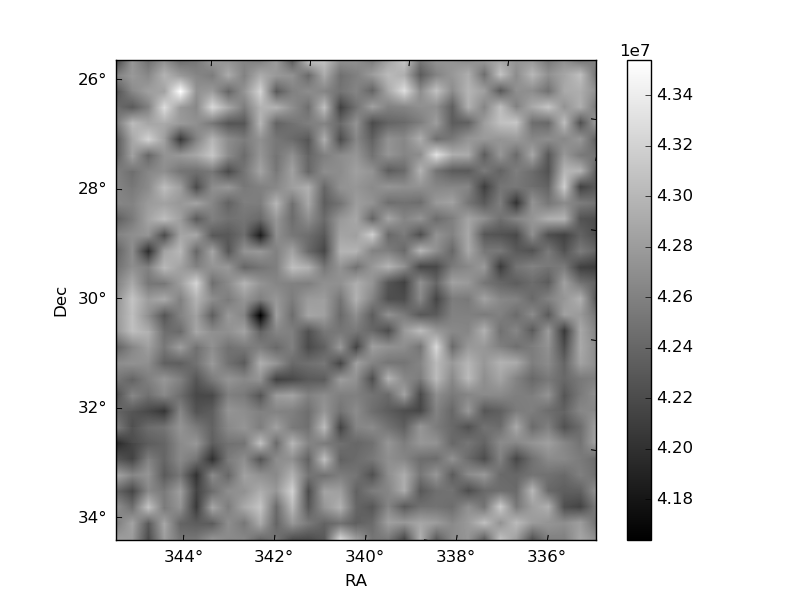
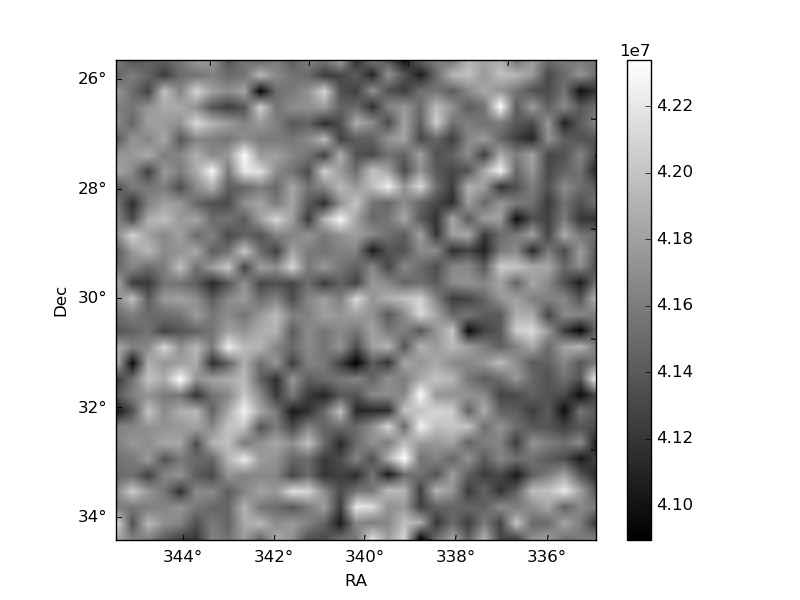
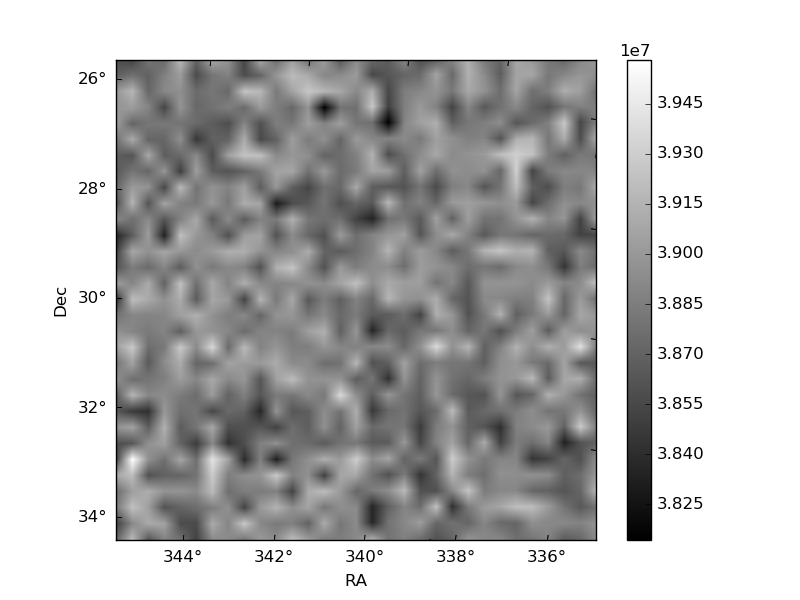
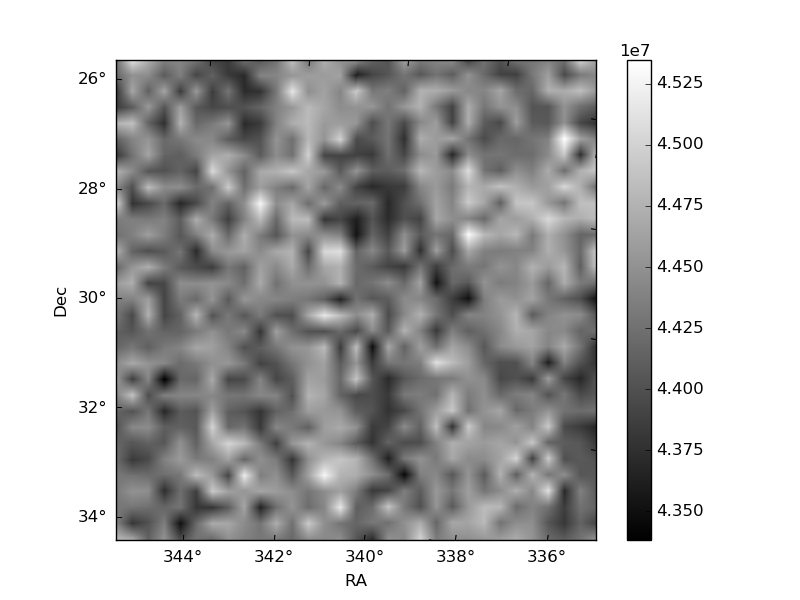
Histogram calculated using DETX and DETY for each event in the final _common_clean file
| Quadrant A | 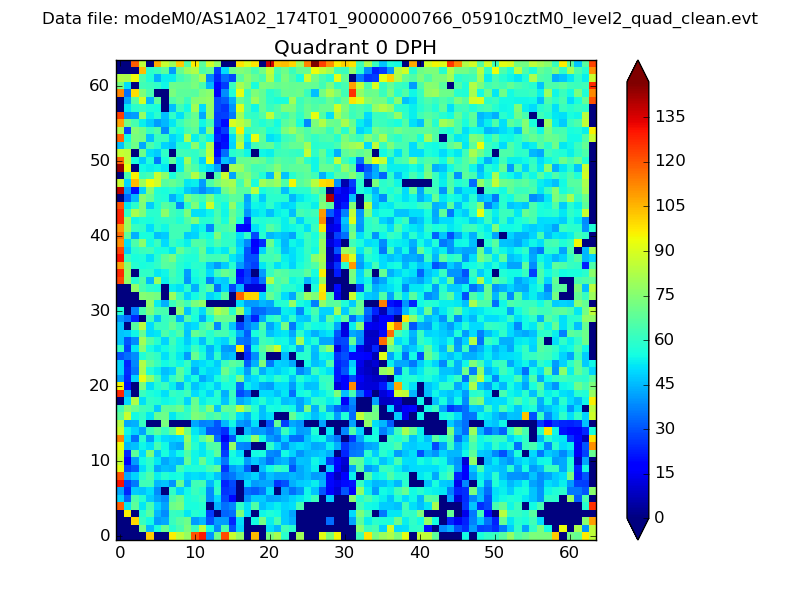 |
 |
Quadrant B |
|---|---|---|---|
| Quadrant D | 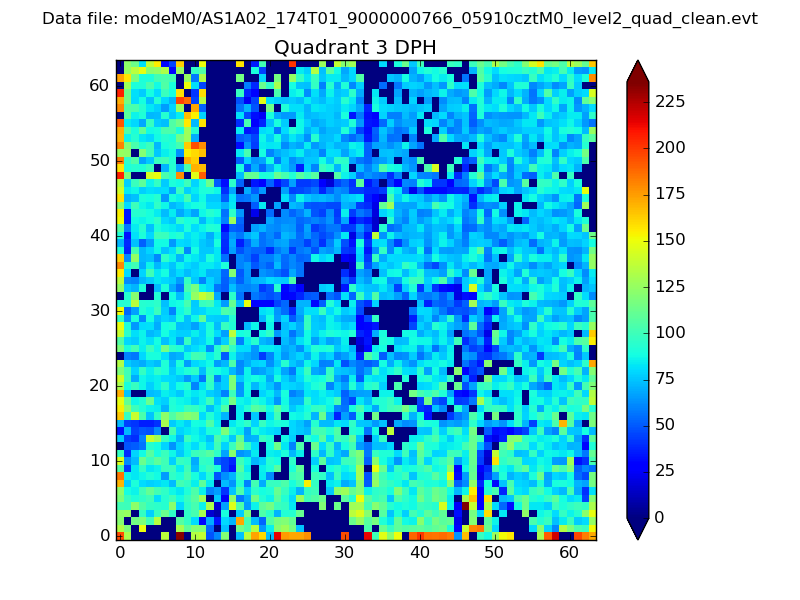 |
 |
Quadrant C |
| Plot type | Count rate plots | Images |
|---|---|---|
| Comparison with Poisson distribution Blue bars denote a histogram of data divided into 1 sec bins. Red curve is a Poisson curve with rate = median count rate of data. |
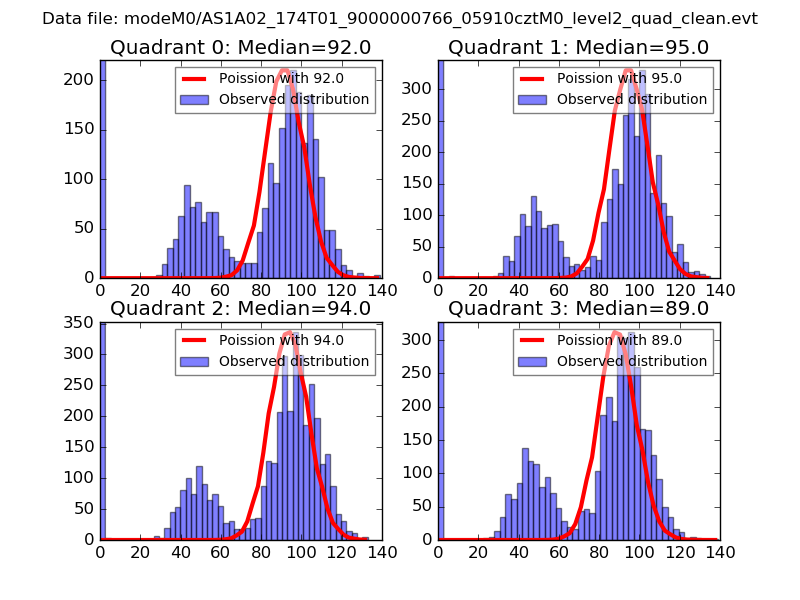 |
 |
| Quadrant-wise count rates Data is divided into 100 sec bins |
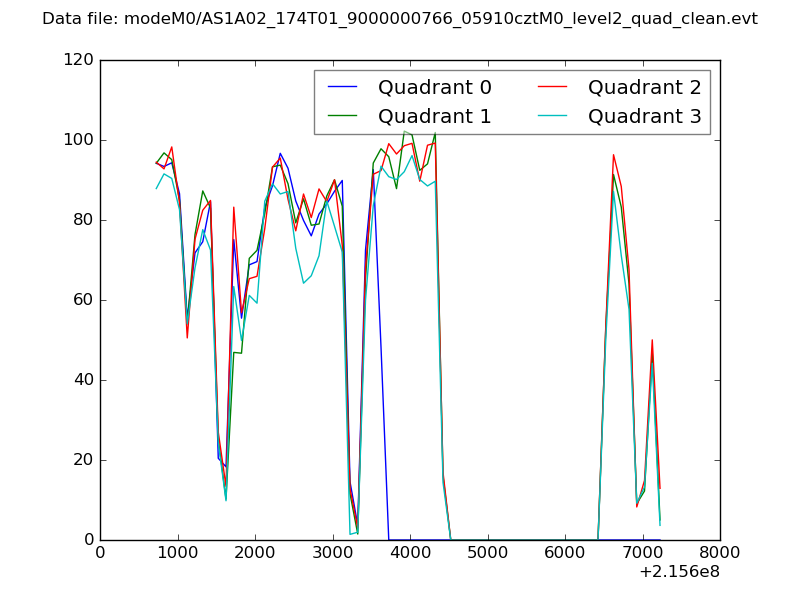 |
|
| Module-wise count rates for Quadrant A Data is divided into 100 sec bins |
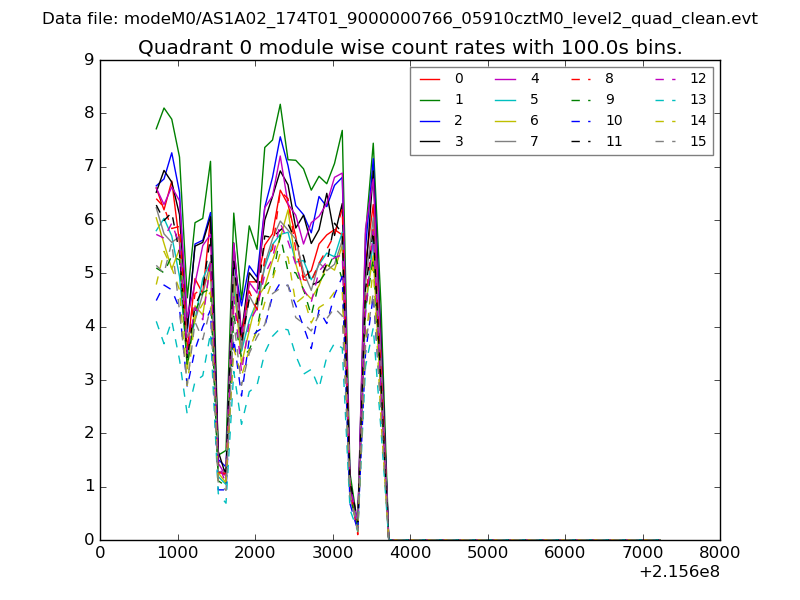 |
 |
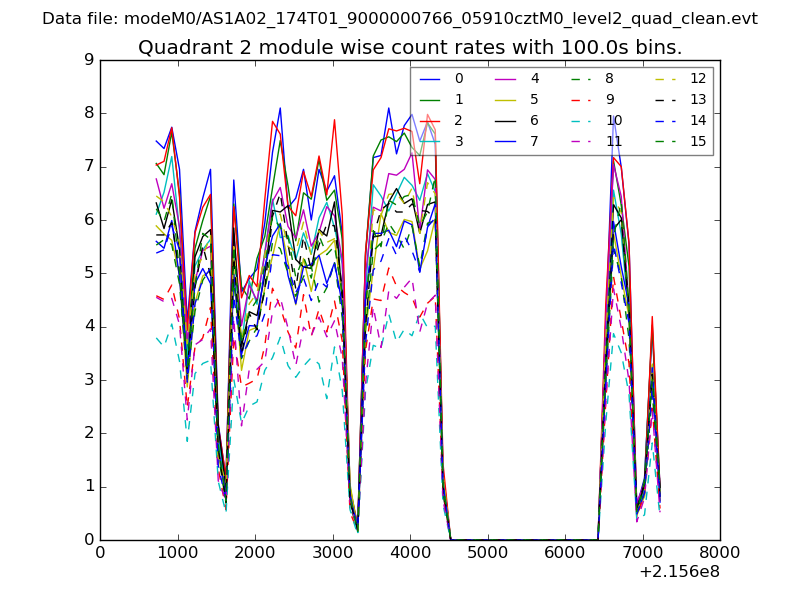
| Module-wise count rates for Quadrant B Data is divided into 100 sec bins |
 |
 |
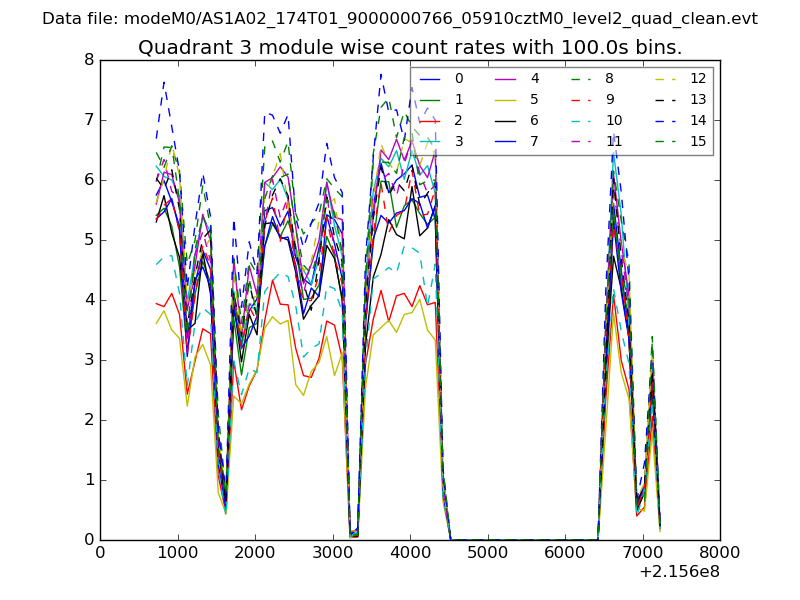
| Module-wise count rates for Quadrant C Data is divided into 100 sec bins |
 |
 |
| Module-wise count rates for Quadrant D Data is divided into 100 sec bins |
 |
 |
| Parameter | Plot |
|---|---|
| CZT HV Monitor | 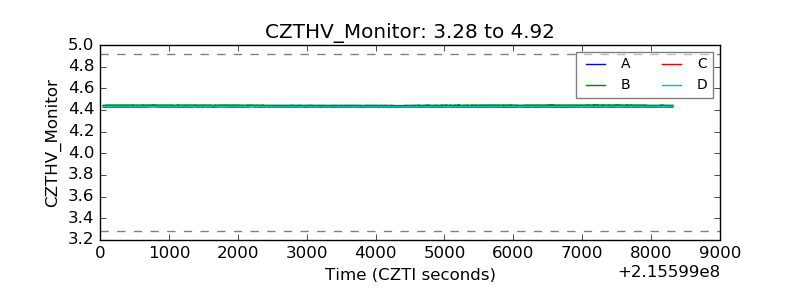 |
| D_VDD | 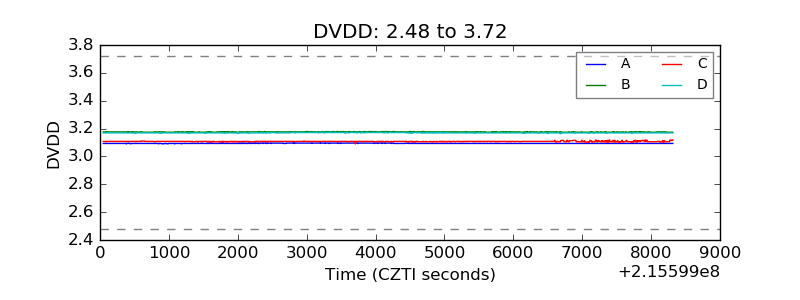 |
| Temperature 1 | 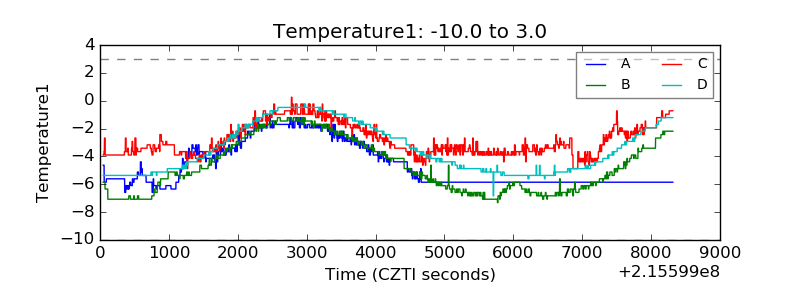 |
| Veto HV Monitor | 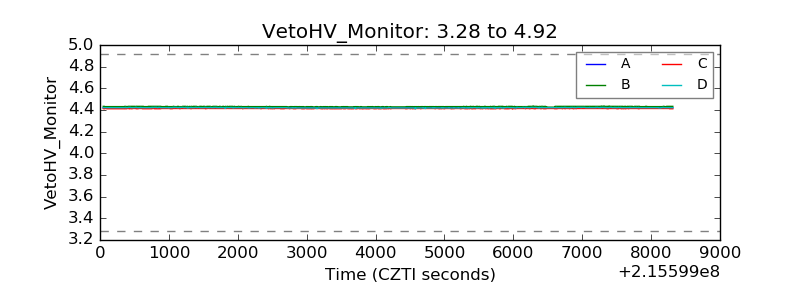 |
| Veto LLD | 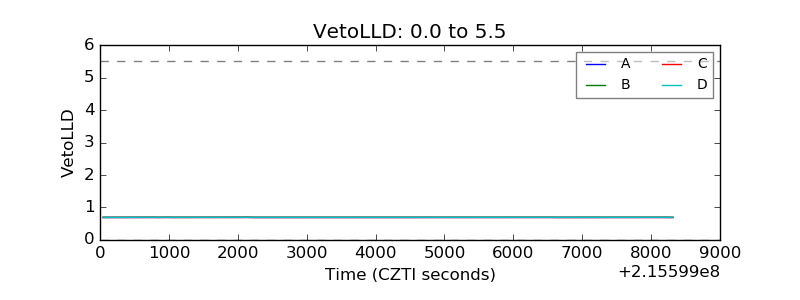 |
| Alpha Counter | 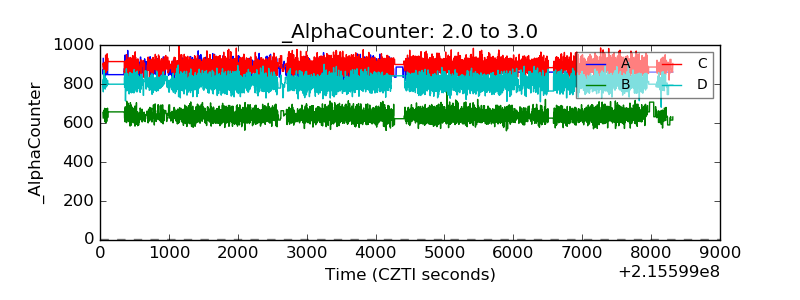 |
| _CPM_Rate | 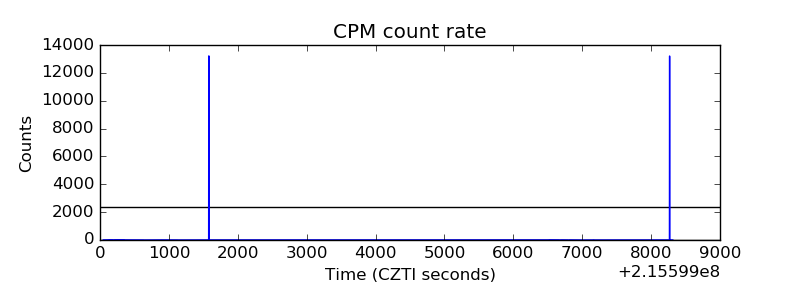 |
| CZT Counter | 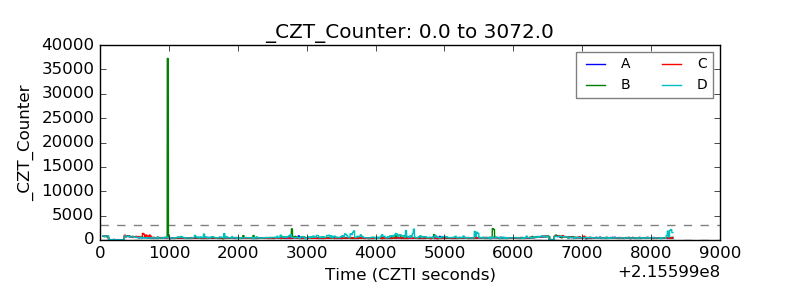 |
| +2.5 Volts monitor |  |
| +5 Volts monitor |  |
| _ROLL_ROT | 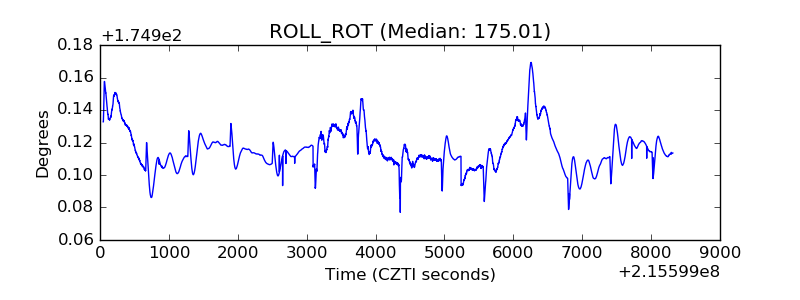 |
| _Roll_DEC | 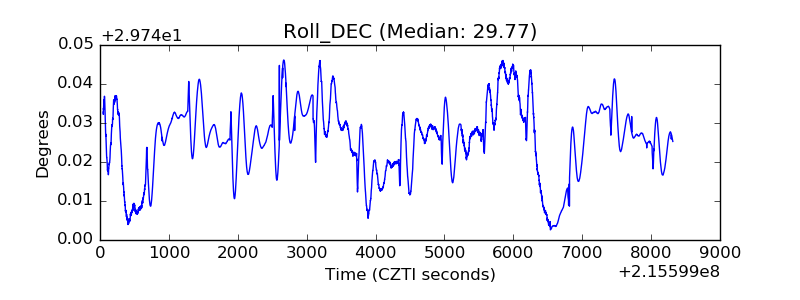 |
| _Roll_RA | 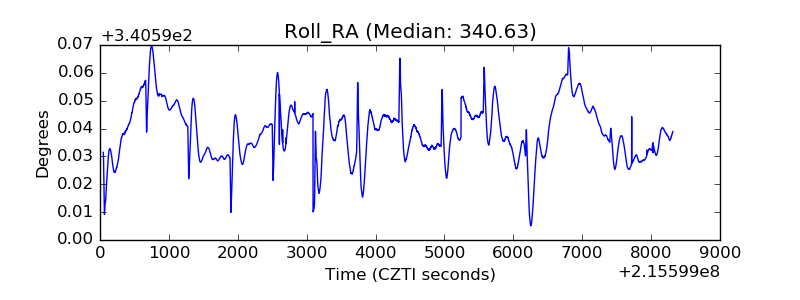 |
| Veto Counter | 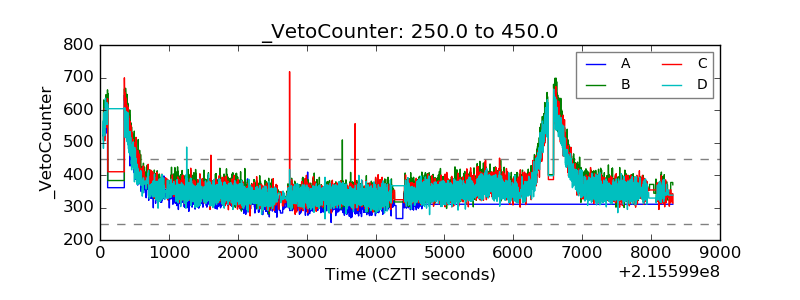 |