| Param | Original file | Final file |
|---|---|---|
| Filename | modeM0/AS1A02_174T01_9000000766_05914cztM0_level2.evt | modeM0/AS1A02_174T01_9000000766_05914cztM0_level2_quad_clean.evt |
| Size (bytes) | 2,233,457,280 | 309,706,560 |
| Size | 2.1 GB | 295.4 MB |
| Events in quadrant A | 13,225,834 | 1,907,520 |
| Events in quadrant B | 14,569,130 | 1,899,120 |
| Events in quadrant C | 12,857,685 | 1,895,356 |
| Events in quadrant D | 25,030,750 | 1,683,863 |
| Mode M9 | |||
|---|---|---|---|
| Quadrant | BADHDUFLAG | Total packets | Discarded packets |
| A | 0 | 22 | 0 |
| B | 0 | 22 | 0 |
| C | 0 | 22 | 0 |
| D | 0 | 22 | 0 |
| Mode M0 | |||
|---|---|---|---|
| Quadrant | BADHDUFLAG | Total packets | Discarded packets |
| A | 0 | 61294 | 622 |
| B | 0 | 63907 | 813 |
| C | 0 | 60311 | 665 |
| D | 0 | 96885 | 2548 |
| Mode SS | |||
|---|---|---|---|
| Quadrant | BADHDUFLAG | Total packets | Discarded packets |
| A | 0 | 600 | 8 |
| B | 0 | 600 | 10 |
| C | 0 | 600 | 8 |
| D | 0 | 600 | 4 |
| Quadrant | Total seconds | Saturated seconds | Saturation percentage |
|---|---|---|---|
| A | 29047 | 574 | 1.976108% |
| B | 28996 | 613 | 2.114085% |
| C | 29026 | 293 | 1.009440% |
| D | 28817 | 2830 | 9.820592% |
Noise dominated data is calculated using 1-second bins in cleaned event files. If a bin has >2000 counts, and if more than 50% of those come from <1% of pixels, then it is considered to be noise-dominated and hence unusable.
| Quadrant | # 1 sec bins | Bins with >0 counts | Bins with >2000 counts | High rate bins dominated by noise | Noise dominated (total time) | Noise dominated (detector-on time) | Marked lightcurve |
|---|---|---|---|---|---|---|---|
| A | 31726 | 29348 | 53 | 53 | 0.17% | 0.18% | 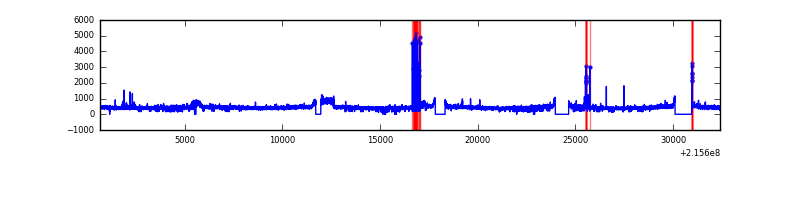 |
| B | 31726 | 29331 | 73 | 73 | 0.23% | 0.25% | 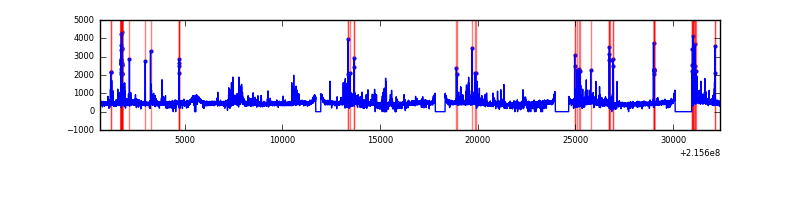 |
| C | 31726 | 29338 | 17 | 17 | 0.05% | 0.06% | 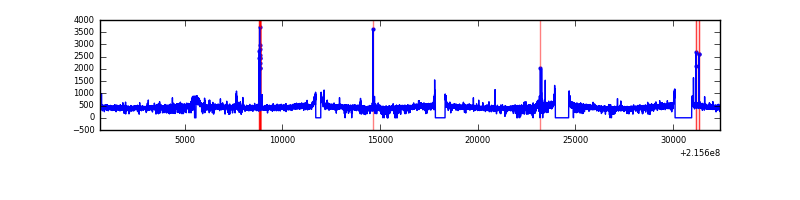 |
| D | 31726 | 29256 | 2315 | 2315 | 7.30% | 7.91% | 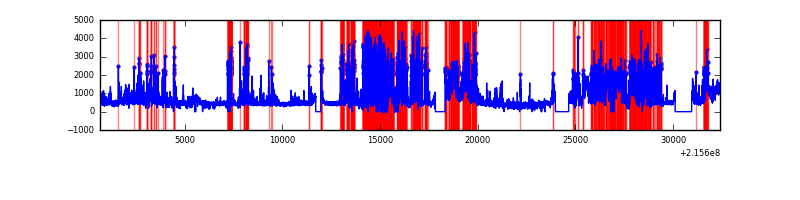 |
Top three noisy pixels from each quadrant. If the there are fewer than three noisy pixels in the level2.evt file, extra rows are filled as -1
| Pixel properties | Quadrant properties | ||||||
|---|---|---|---|---|---|---|---|
| Quadrant | DetID | PixID | Counts | Sigma | Mean | Median | Sigma |
| A | 15 | 236 | 350299 | 514.33 | 3301 | 3216 | 674.8 |
| A | 15 | 234 | 136944 | 198.17 | 3301 | 3216 | 674.8 |
| A | 12 | 194 | 32428 | 43.29 | 3301 | 3216 | 674.8 |
| B | 0 | 214 | 462625 | 724.81 | 3325 | 3244 | 633.8 |
| B | 15 | 255 | 337878 | 527.98 | 3325 | 3244 | 633.8 |
| B | 0 | 219 | 246252 | 383.42 | 3325 | 3244 | 633.8 |
| C | 9 | 247 | 207485 | 273.58 | 3229 | 3243 | 746.6 |
| C | 13 | 61 | 25739 | 30.13 | 3229 | 3243 | 746.6 |
| C | 8 | 128 | 17835 | 19.55 | 3229 | 3243 | 746.6 |
| D | 1 | 20 | 5535148 | 7264.5 | 3107 | 3015 | 761.5 |
| D | 2 | 152 | 2424240 | 3179.42 | 3107 | 3015 | 761.5 |
| D | 15 | 217 | 2102458 | 2756.88 | 3107 | 3015 | 761.5 |
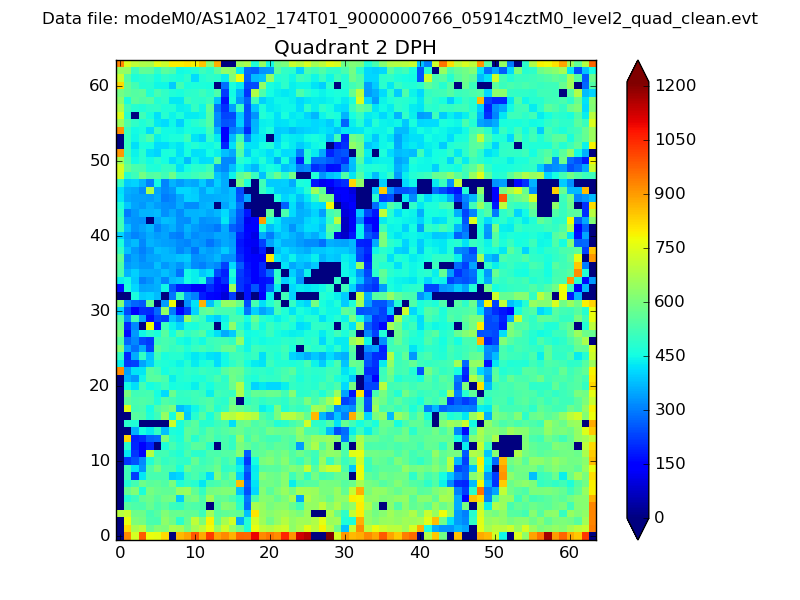
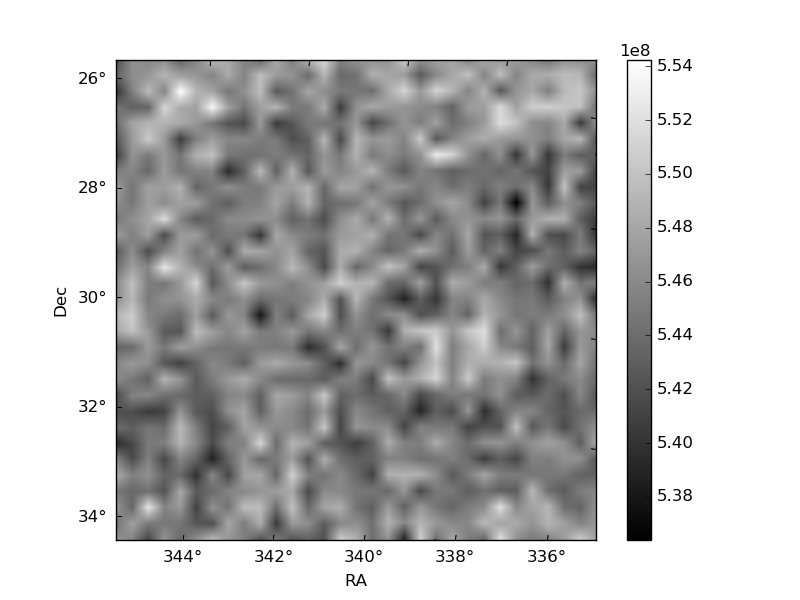
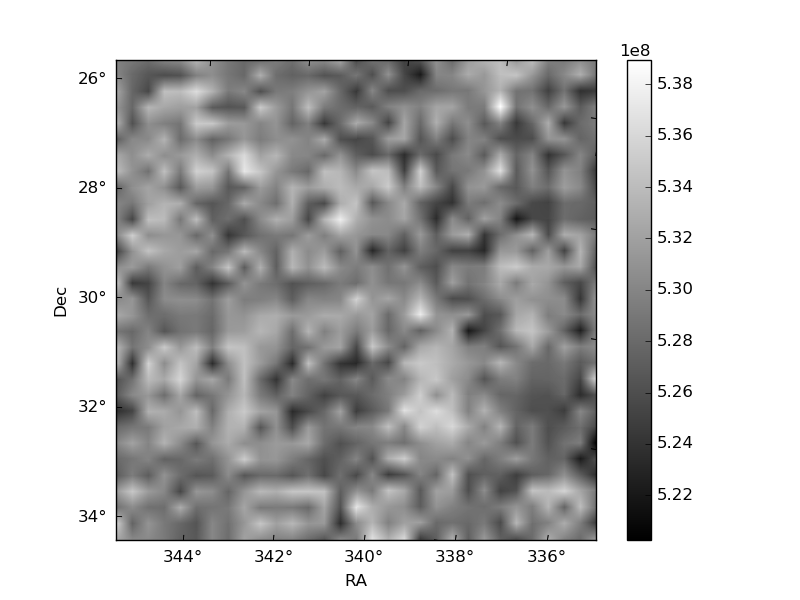
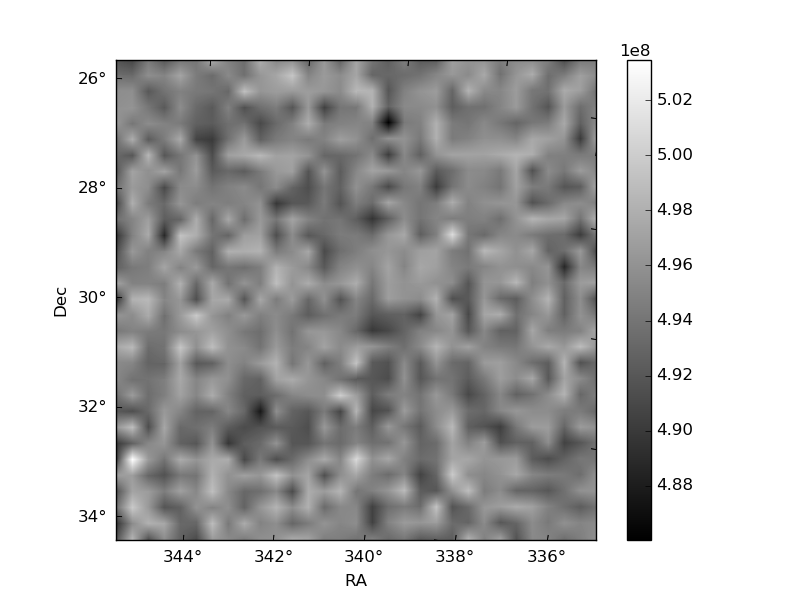
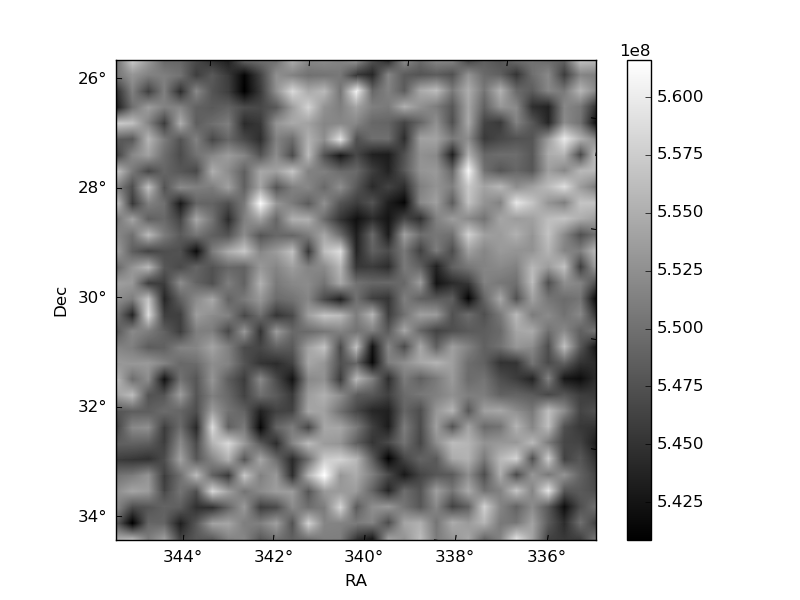
Histogram calculated using DETX and DETY for each event in the final _common_clean file
| Quadrant A | 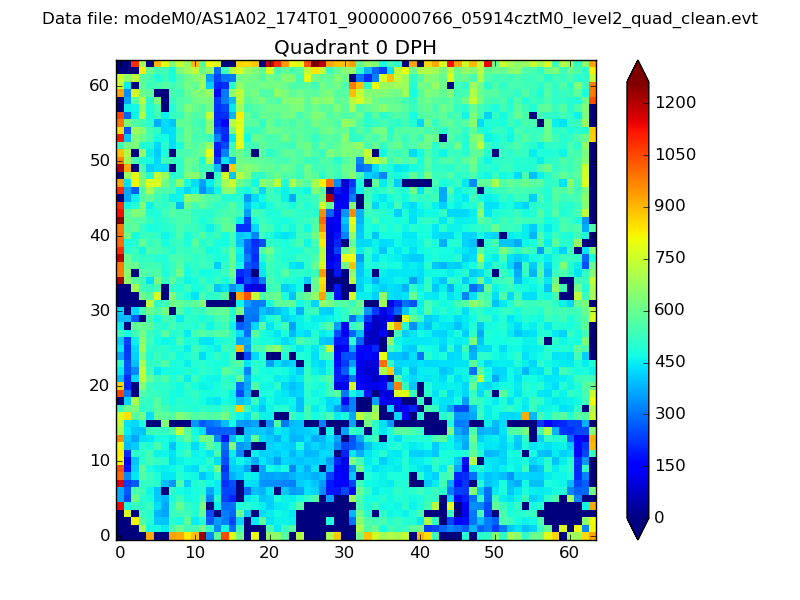 |
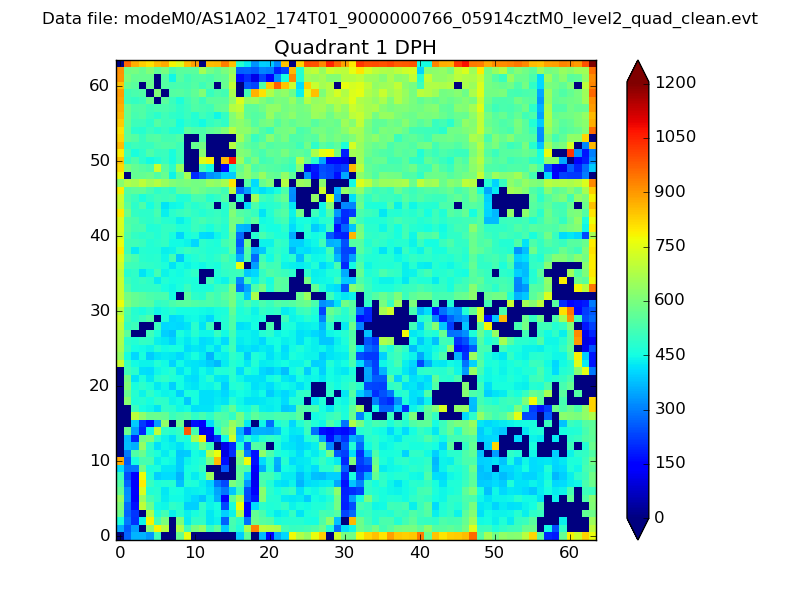 |
Quadrant B |
|---|---|---|---|
| Quadrant D | 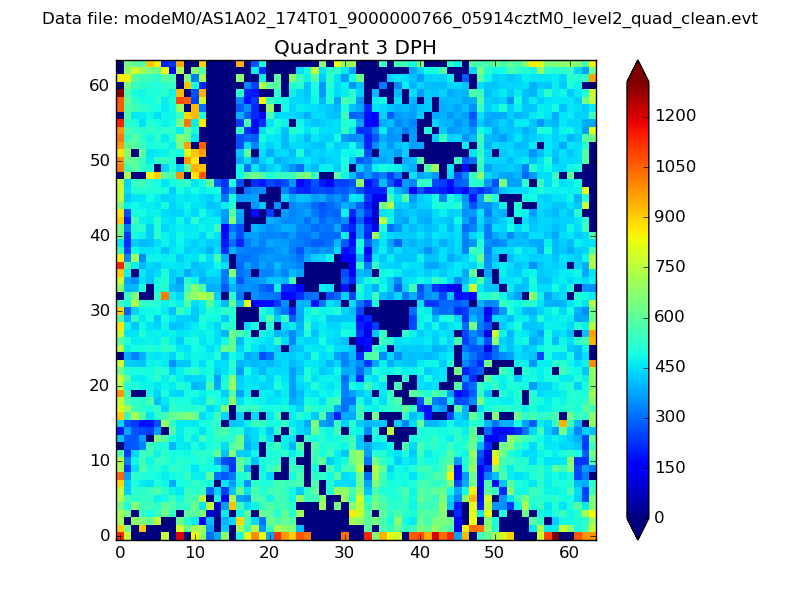 |
 |
Quadrant C |
| Plot type | Count rate plots | Images |
|---|---|---|
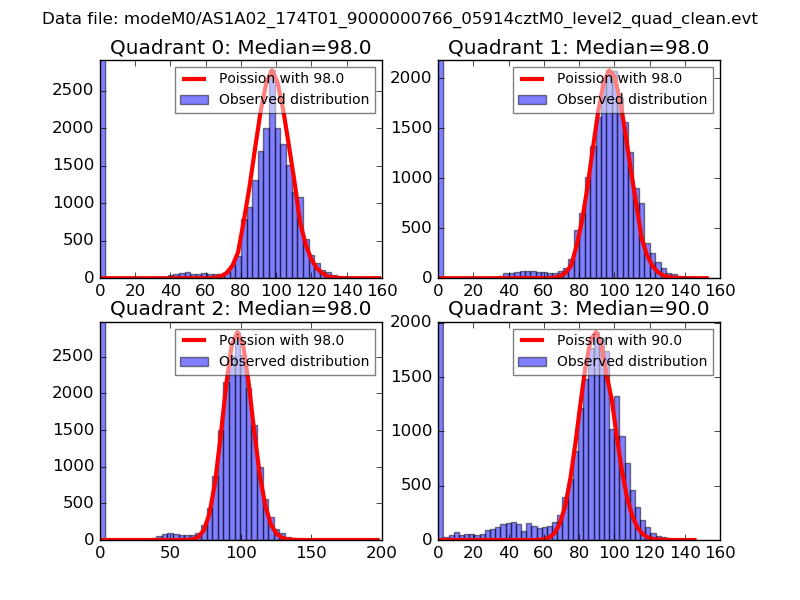
| Comparison with Poisson distribution Blue bars denote a histogram of data divided into 1 sec bins. Red curve is a Poisson curve with rate = median count rate of data. |
 |
 |
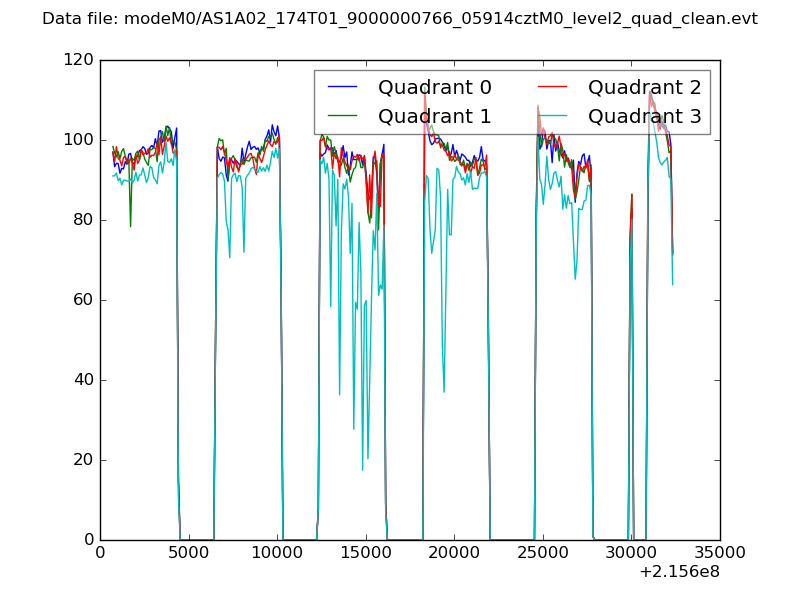
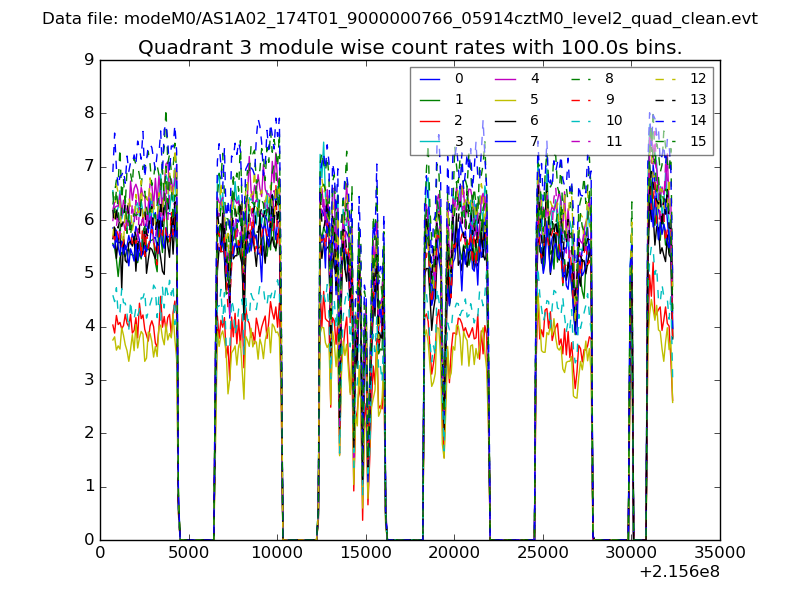
| Quadrant-wise count rates Data is divided into 100 sec bins |
 |
|
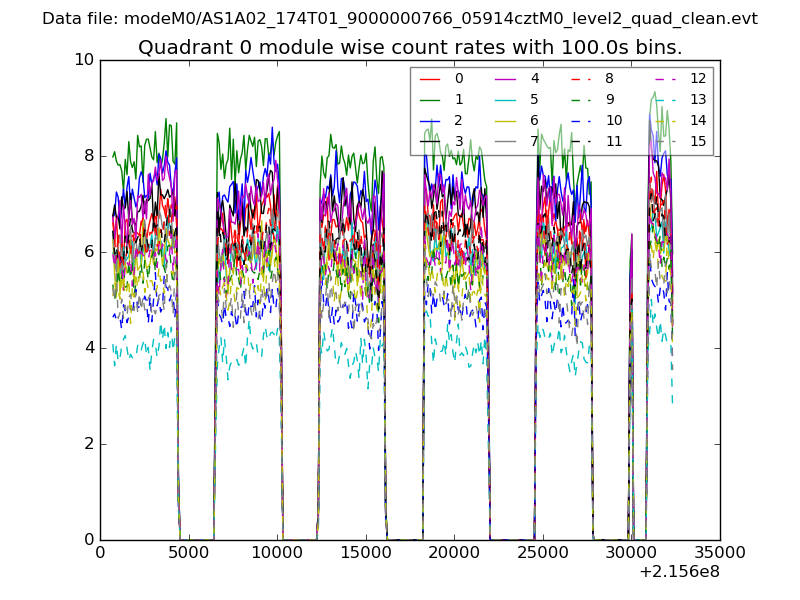
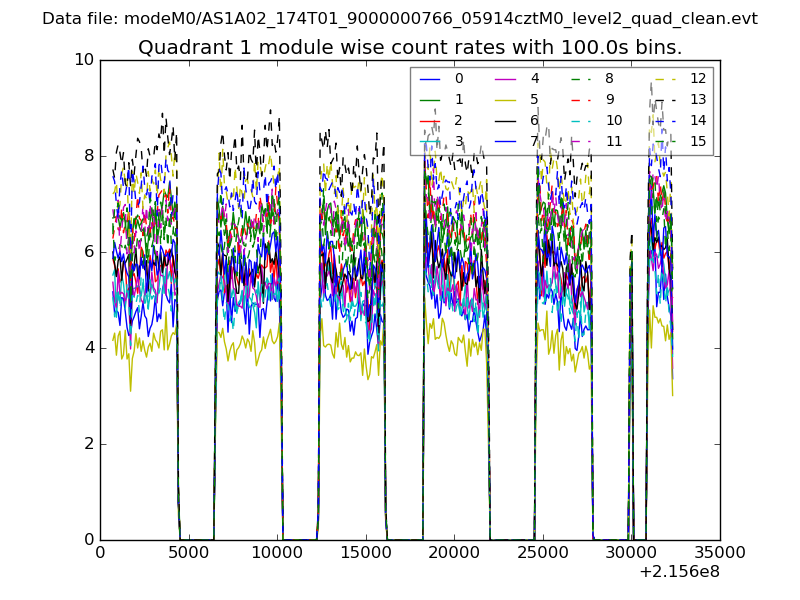
| Module-wise count rates for Quadrant A Data is divided into 100 sec bins |
 |
 |
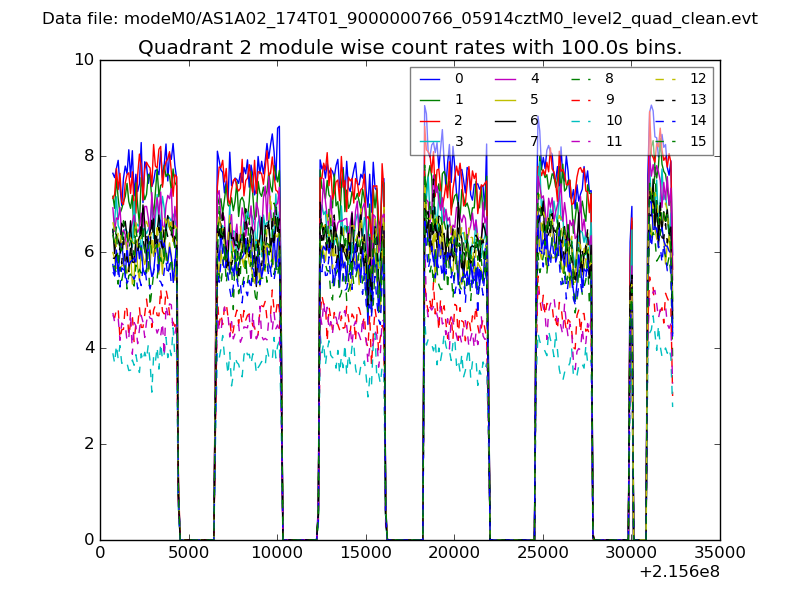
| Module-wise count rates for Quadrant B Data is divided into 100 sec bins |
 |
 |
| Module-wise count rates for Quadrant C Data is divided into 100 sec bins |
 |
 |
| Module-wise count rates for Quadrant D Data is divided into 100 sec bins |
 |
 |
| Parameter | Plot |
|---|---|
| CZT HV Monitor |  |
| D_VDD | 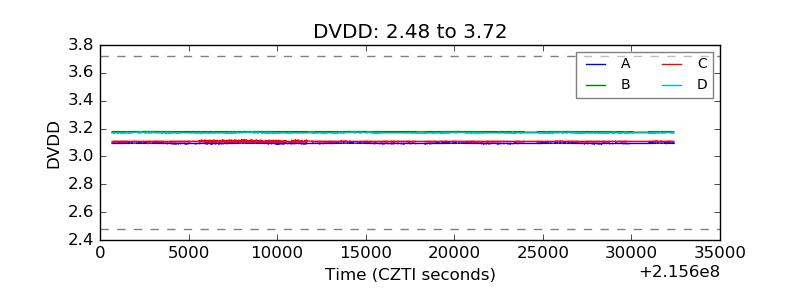 |
| Temperature 1 |  |
| Veto HV Monitor | 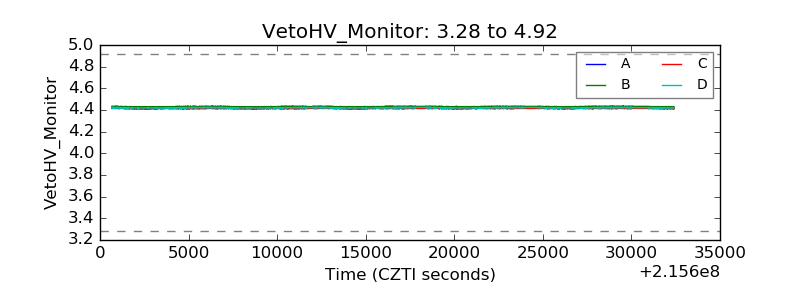 |
| Veto LLD | 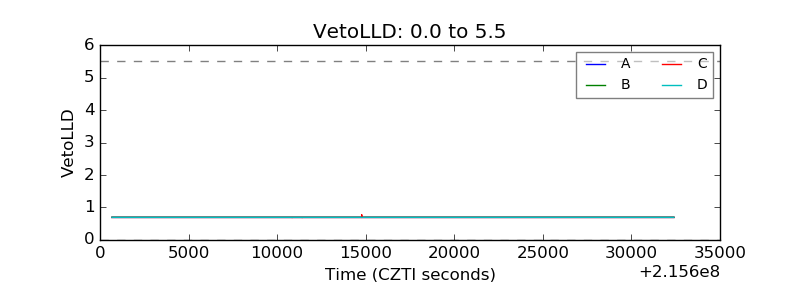 |
| Alpha Counter | 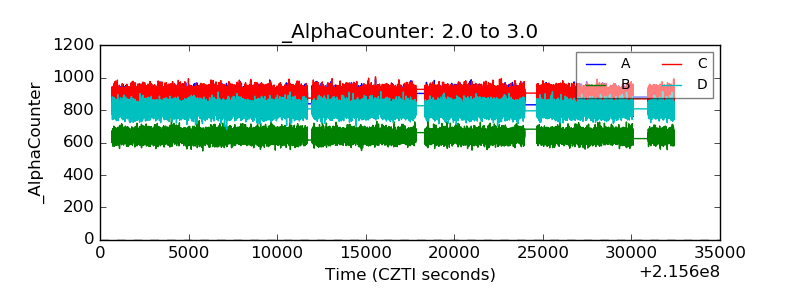 |
| _CPM_Rate | 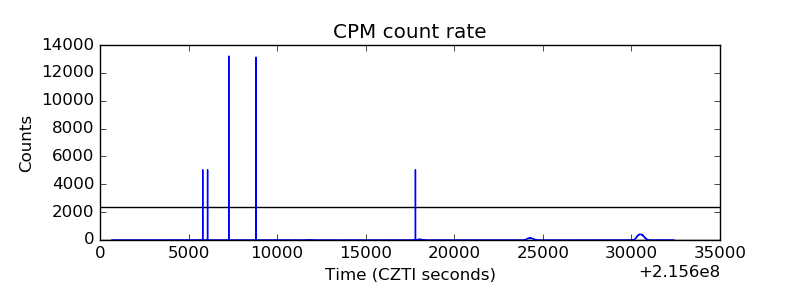 |
| CZT Counter | 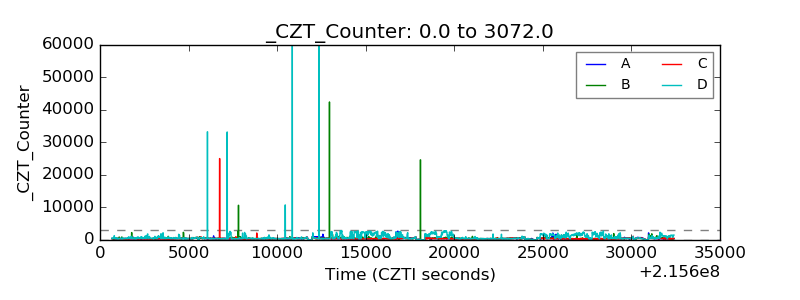 |
| +2.5 Volts monitor | 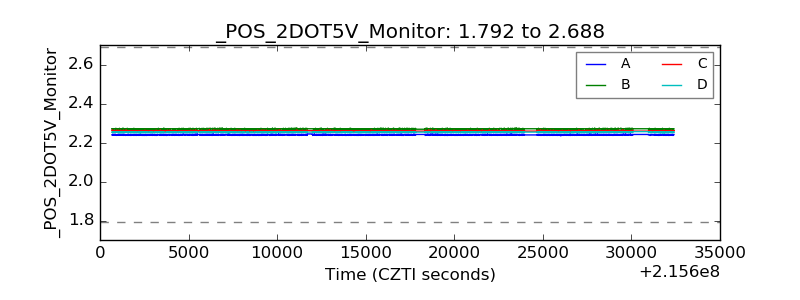 |
| +5 Volts monitor |  |
| _ROLL_ROT | 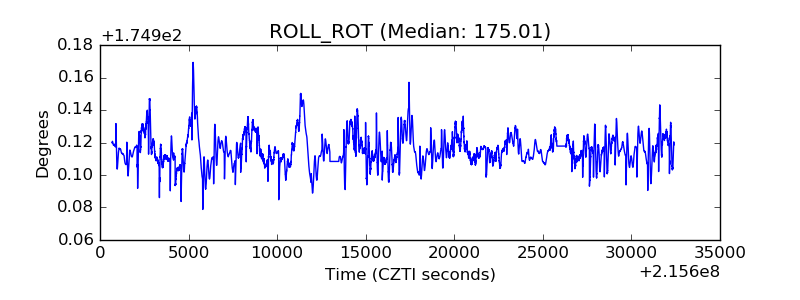 |
| _Roll_DEC | 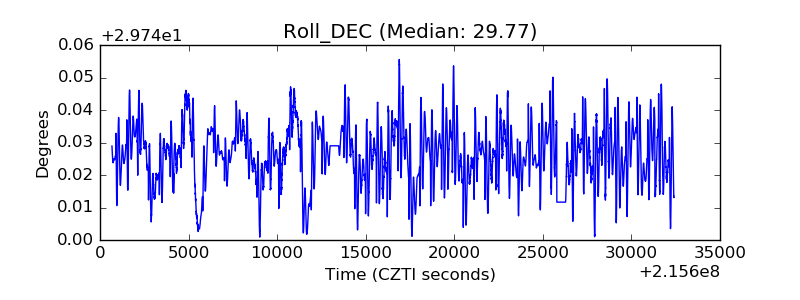 |
| _Roll_RA | 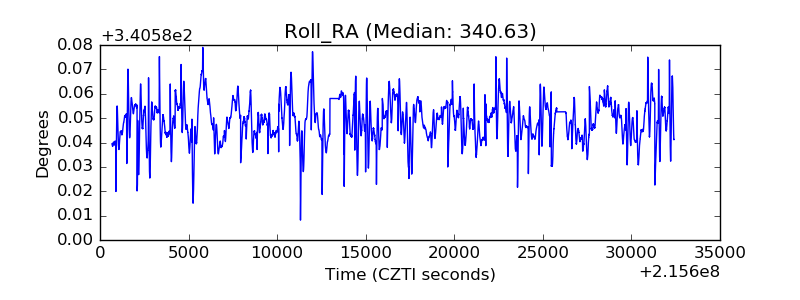 |
| Veto Counter | 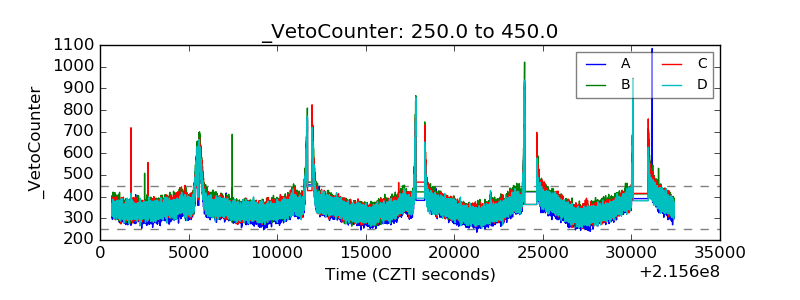 |