| Param | Original file | Final file |
|---|---|---|
| Filename | modeM0/AS1A02_174T01_9000000766_05915cztM0_level2.evt | modeM0/AS1A02_174T01_9000000766_05915cztM0_level2_quad_clean.evt |
| Size (bytes) | 622,589,760 | 73,834,560 |
| Size | 593.7 MB | 70.4 MB |
| Events in quadrant A | 2,953,839 | 459,368 |
| Events in quadrant B | 3,287,273 | 460,339 |
| Events in quadrant C | 3,064,586 | 453,249 |
| Events in quadrant D | 9,108,355 | 407,881 |
| Mode M9 | |||
|---|---|---|---|
| Quadrant | BADHDUFLAG | Total packets | Discarded packets |
| A | 0 | 17 | 0 |
| B | 0 | 17 | 0 |
| C | 0 | 17 | 0 |
| D | 0 | 17 | 0 |
| Mode M0 | |||
|---|---|---|---|
| Quadrant | BADHDUFLAG | Total packets | Discarded packets |
| A | 0 | 13422 | 59 |
| B | 0 | 14334 | 82 |
| C | 0 | 13885 | 34 |
| D | 0 | 31839 | 166 |
| Mode SS | |||
|---|---|---|---|
| Quadrant | BADHDUFLAG | Total packets | Discarded packets |
| A | 0 | 134 | 0 |
| B | 0 | 134 | 0 |
| C | 0 | 134 | 2 |
| D | 0 | 134 | 2 |
| Quadrant | Total seconds | Saturated seconds | Saturation percentage |
|---|---|---|---|
| A | 6516 | 35 | 0.537139% |
| B | 6514 | 75 | 1.151366% |
| C | 6528 | 99 | 1.516544% |
| D | 6506 | 1263 | 19.412850% |
Noise dominated data is calculated using 1-second bins in cleaned event files. If a bin has >2000 counts, and if more than 50% of those come from <1% of pixels, then it is considered to be noise-dominated and hence unusable.
| Quadrant | # 1 sec bins | Bins with >0 counts | Bins with >2000 counts | High rate bins dominated by noise | Noise dominated (total time) | Noise dominated (detector-on time) | Marked lightcurve |
|---|---|---|---|---|---|---|---|
| A | 7559 | 6545 | 7 | 7 | 0.09% | 0.11% |  |
| B | 7559 | 6545 | 12 | 12 | 0.16% | 0.18% |  |
| C | 7559 | 6545 | 71 | 71 | 0.94% | 1.08% | 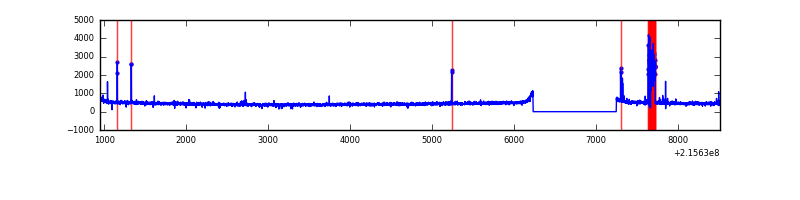 |
| D | 7559 | 6544 | 1147 | 1147 | 15.17% | 17.53% | 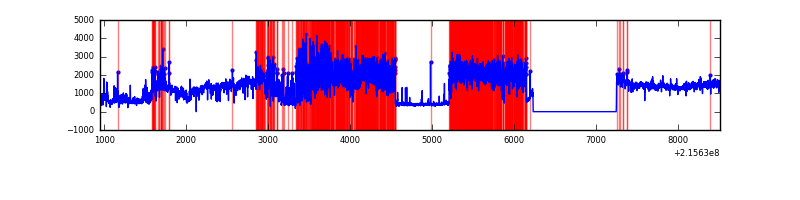 |
Top three noisy pixels from each quadrant. If the there are fewer than three noisy pixels in the level2.evt file, extra rows are filled as -1
| Pixel properties | Quadrant properties | ||||||
|---|---|---|---|---|---|---|---|
| Quadrant | DetID | PixID | Counts | Sigma | Mean | Median | Sigma |
| A | 15 | 236 | 82070 | 527.23 | 745 | 726 | 154.3 |
| A | 12 | 194 | 7363 | 43.01 | 745 | 726 | 154.3 |
| A | 0 | 226 | 7247 | 42.26 | 745 | 726 | 154.3 |
| B | 15 | 204 | 90935 | 624.49 | 749 | 733 | 144.4 |
| B | 0 | 214 | 88823 | 609.87 | 749 | 733 | 144.4 |
| B | 4 | 80 | 68419 | 468.61 | 749 | 733 | 144.4 |
| C | 1 | 16 | 196644 | 1159.19 | 723 | 724 | 169.0 |
| C | 9 | 247 | 36382 | 210.98 | 723 | 724 | 169.0 |
| C | 9 | 68 | 6815 | 36.04 | 723 | 724 | 169.0 |
| D | 1 | 20 | 5546817 | 32232.29 | 694 | 672 | 172.1 |
| D | 2 | 152 | 754454 | 4380.72 | 694 | 672 | 172.1 |
| D | 2 | 63 | 37682 | 215.09 | 694 | 672 | 172.1 |
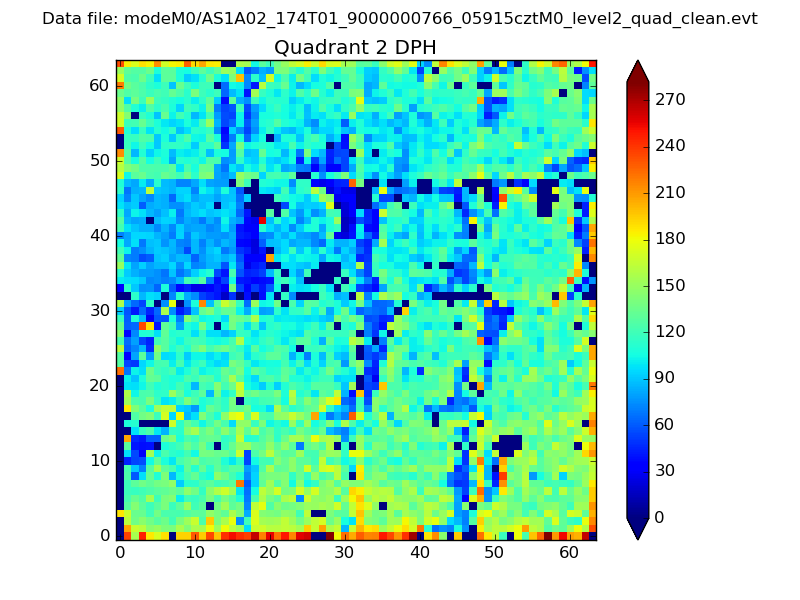
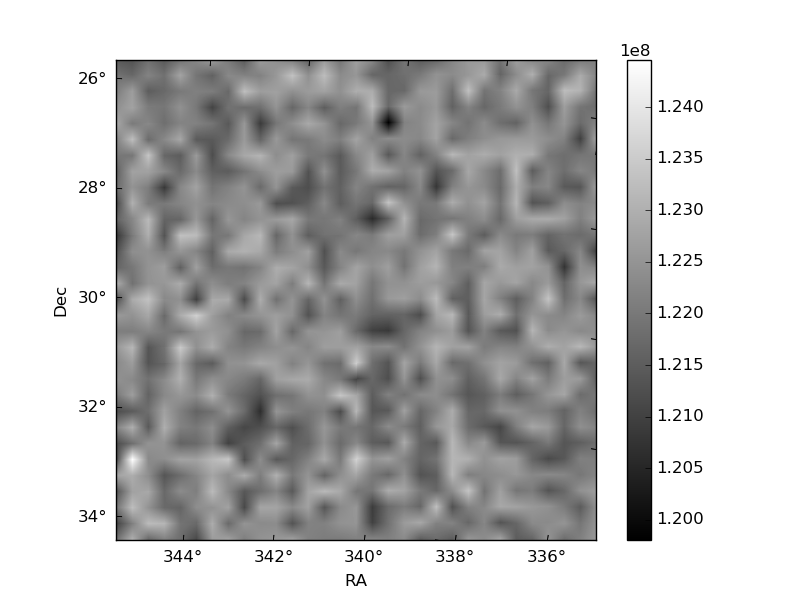
Histogram calculated using DETX and DETY for each event in the final _common_clean file
| Quadrant A | 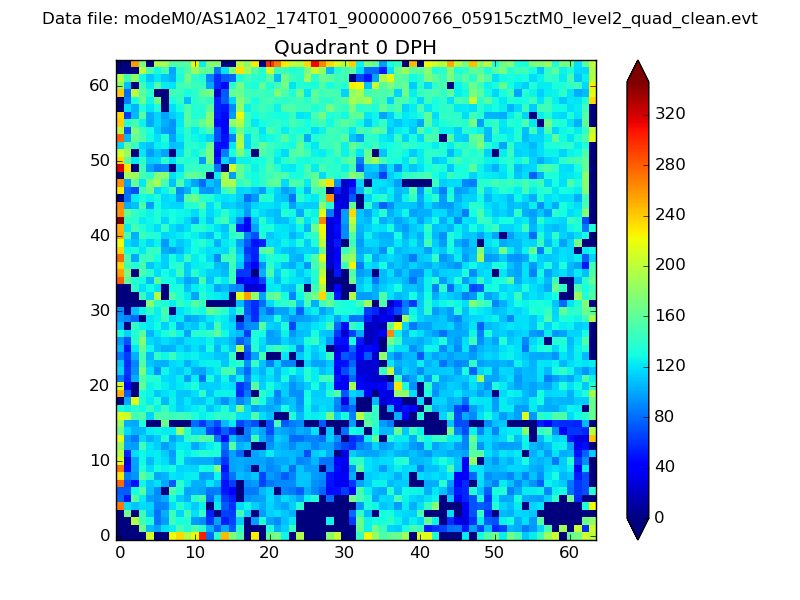 |
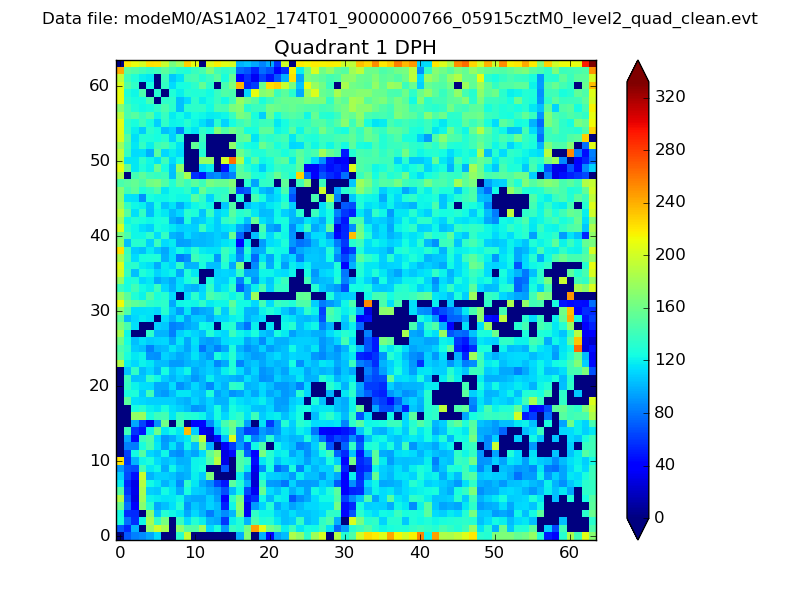 |
Quadrant B |
|---|---|---|---|
| Quadrant D | 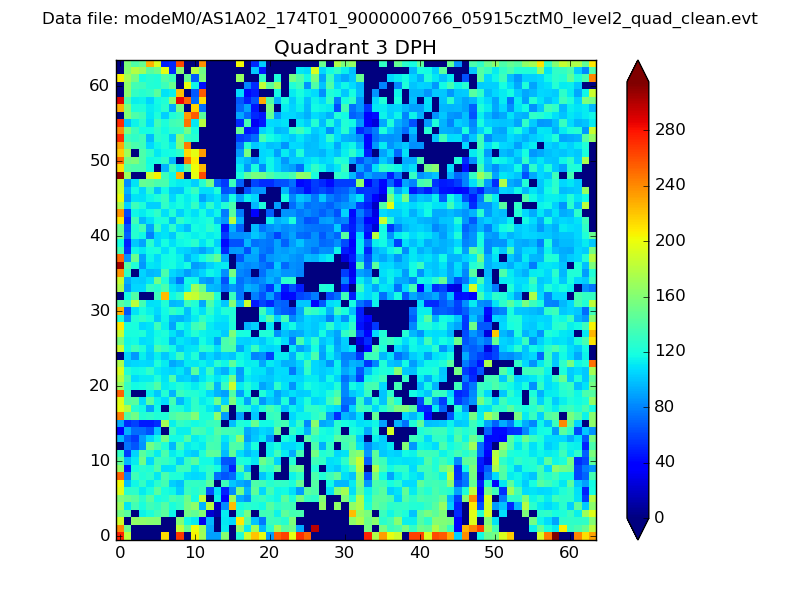 |
 |
Quadrant C |
| Plot type | Count rate plots | Images |
|---|---|---|
| Comparison with Poisson distribution Blue bars denote a histogram of data divided into 1 sec bins. Red curve is a Poisson curve with rate = median count rate of data. |
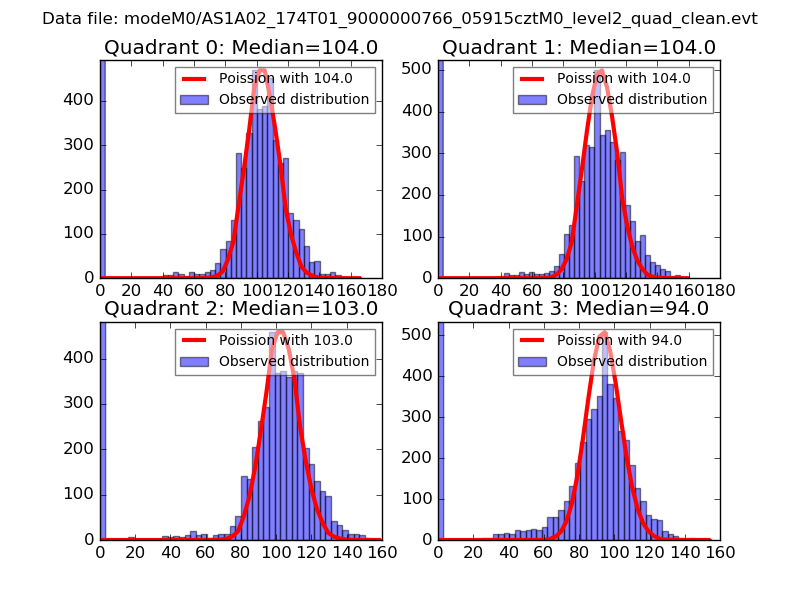 |
 |
| Quadrant-wise count rates Data is divided into 100 sec bins |
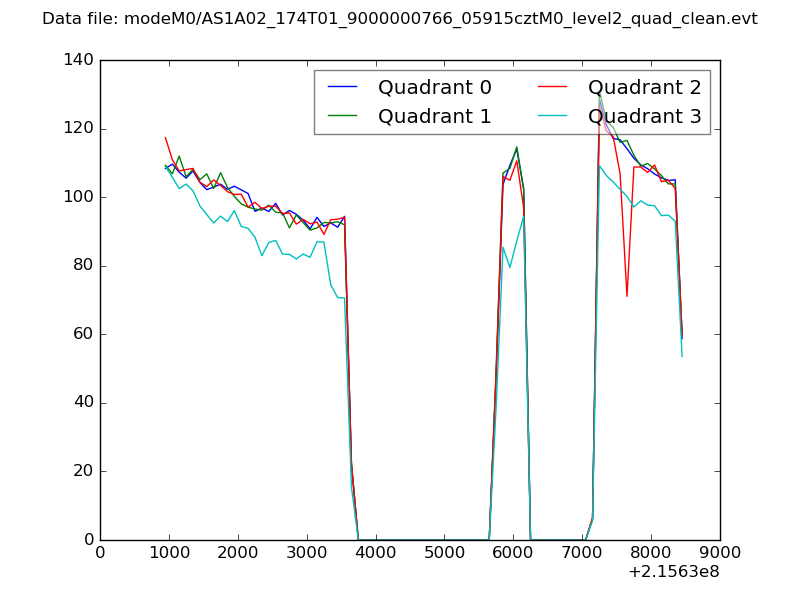 |
|
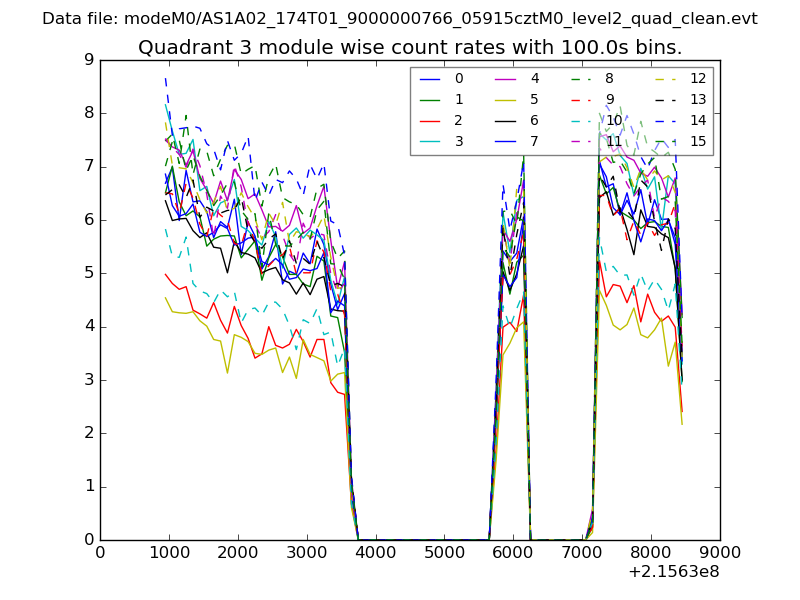
| Module-wise count rates for Quadrant A Data is divided into 100 sec bins |
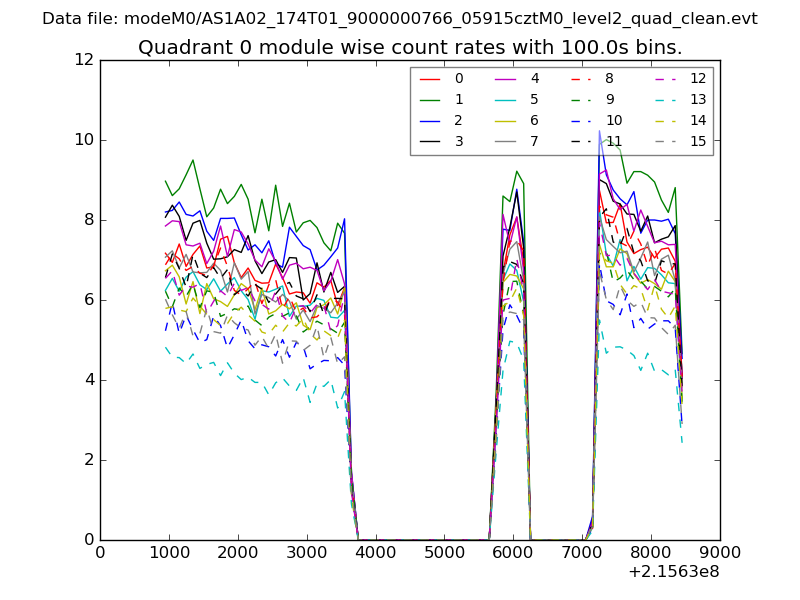 |
 |
| Module-wise count rates for Quadrant B Data is divided into 100 sec bins |
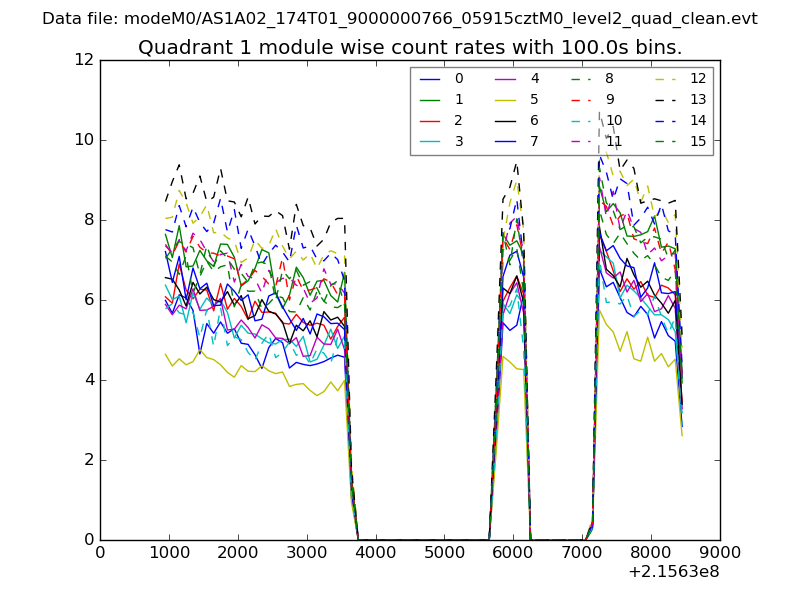 |
 |
| Module-wise count rates for Quadrant C Data is divided into 100 sec bins |
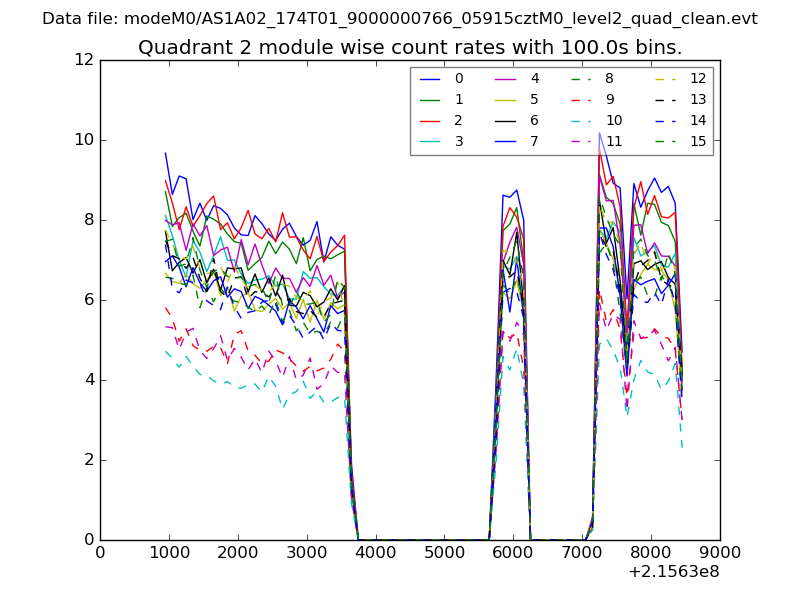 |
 |
| Module-wise count rates for Quadrant D Data is divided into 100 sec bins |
 |
 |
| Parameter | Plot |
|---|---|
| CZT HV Monitor | 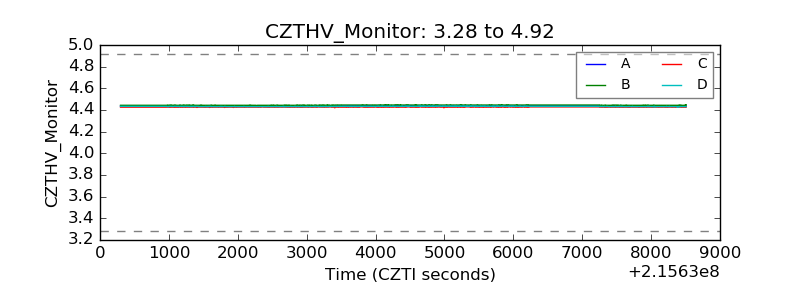 |
| D_VDD | 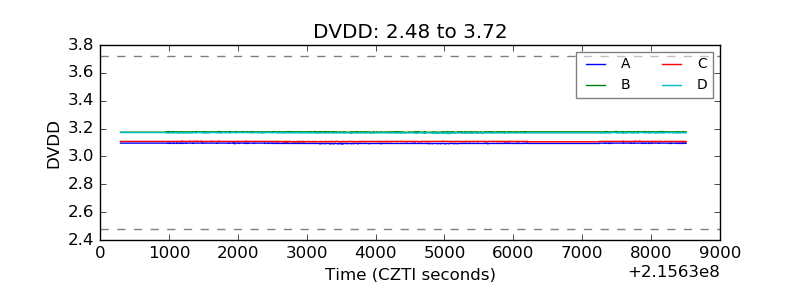 |
| Temperature 1 | 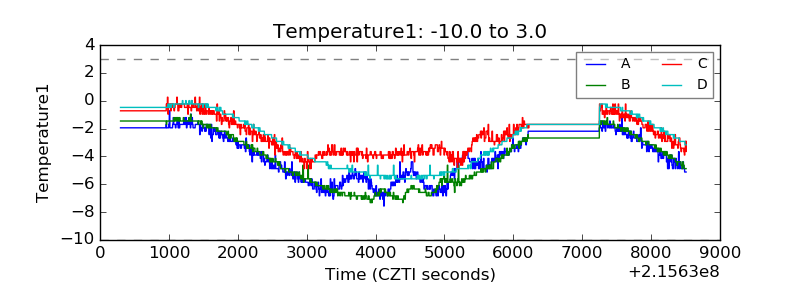 |
| Veto HV Monitor | 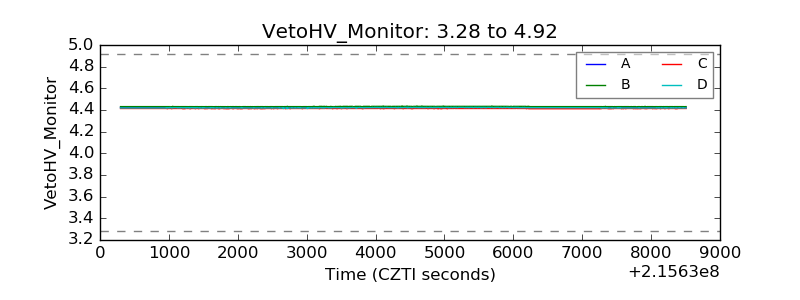 |
| Veto LLD | 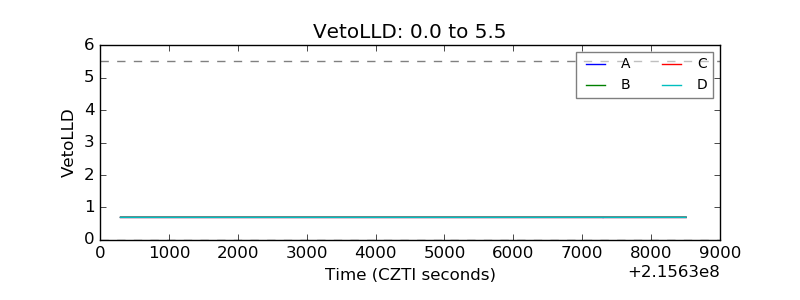 |
| Alpha Counter | 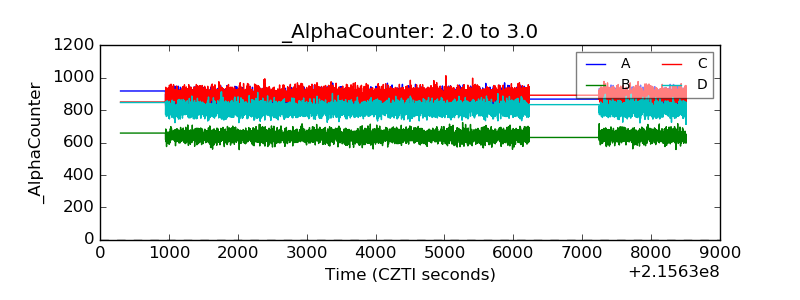 |
| _CPM_Rate | 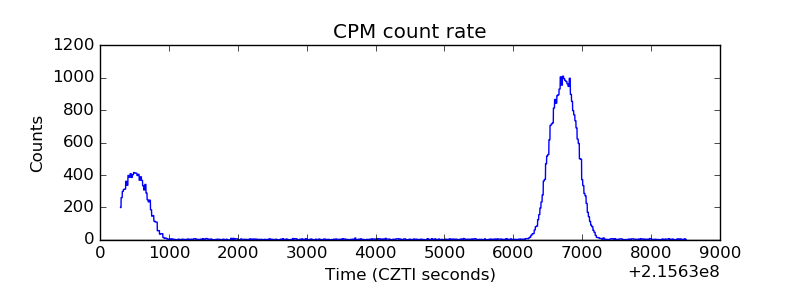 |
| CZT Counter | 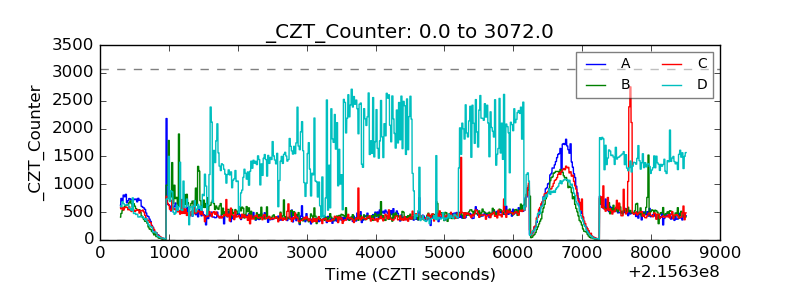 |
| +2.5 Volts monitor |  |
| +5 Volts monitor |  |
| _ROLL_ROT | 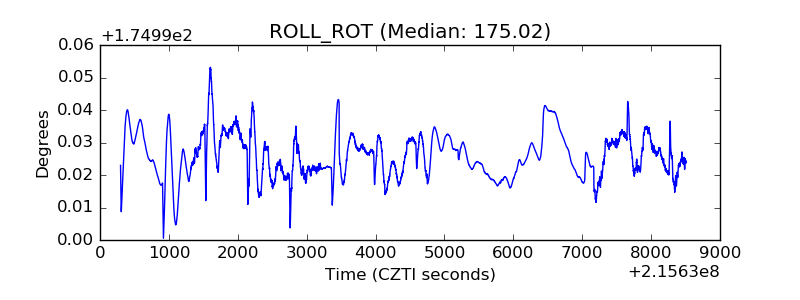 |
| _Roll_DEC | 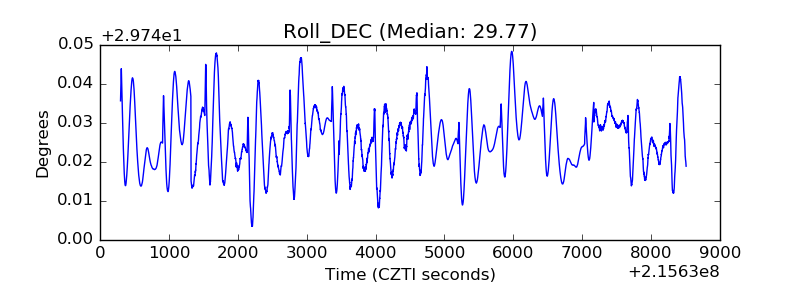 |
| _Roll_RA | 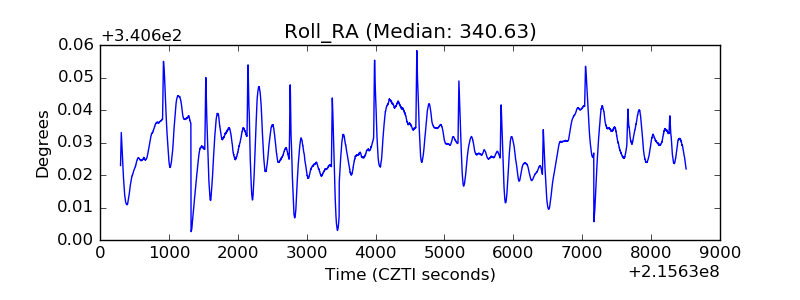 |
| Veto Counter | 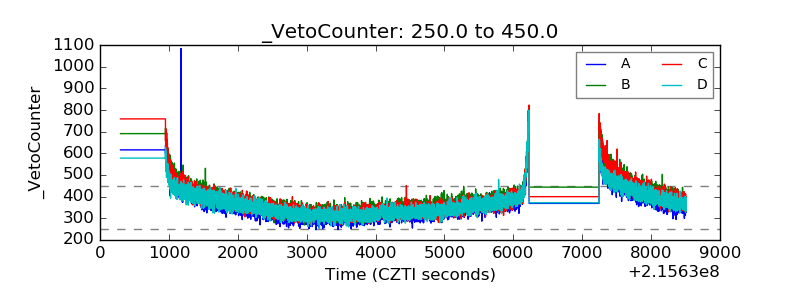 |