| Param | Original file | Final file |
|---|---|---|
| Filename | modeM0/AS1A02_174T01_9000000766_05917cztM0_level2.evt | modeM0/AS1A02_174T01_9000000766_05917cztM0_level2_quad_clean.evt |
| Size (bytes) | 652,734,720 | 76,147,200 |
| Size | 622.5 MB | 72.6 MB |
| Events in quadrant A | 2,955,214 | 479,584 |
| Events in quadrant B | 3,250,364 | 481,742 |
| Events in quadrant C | 3,513,929 | 466,746 |
| Events in quadrant D | 9,609,376 | 423,936 |
| Mode M9 | |||
|---|---|---|---|
| Quadrant | BADHDUFLAG | Total packets | Discarded packets |
| A | 0 | 20 | 0 |
| B | 0 | 20 | 0 |
| C | 0 | 20 | 0 |
| D | 0 | 21 | 0 |
| Mode M0 | |||
|---|---|---|---|
| Quadrant | BADHDUFLAG | Total packets | Discarded packets |
| A | 0 | 13344 | 5 |
| B | 0 | 14020 | 7 |
| C | 0 | 15070 | 2 |
| D | 0 | 33023 | 2 |
| Mode SS | |||
|---|---|---|---|
| Quadrant | BADHDUFLAG | Total packets | Discarded packets |
| A | 0 | 130 | 0 |
| B | 0 | 130 | 0 |
| C | 0 | 130 | 0 |
| D | 0 | 130 | 0 |
| Quadrant | Total seconds | Saturated seconds | Saturation percentage |
|---|---|---|---|
| A | 6507 | 27 | 0.414938% |
| B | 6506 | 38 | 0.584076% |
| C | 6508 | 154 | 2.366318% |
| D | 6508 | 1113 | 17.102028% |
Noise dominated data is calculated using 1-second bins in cleaned event files. If a bin has >2000 counts, and if more than 50% of those come from <1% of pixels, then it is considered to be noise-dominated and hence unusable.
| Quadrant | # 1 sec bins | Bins with >0 counts | Bins with >2000 counts | High rate bins dominated by noise | Noise dominated (total time) | Noise dominated (detector-on time) | Marked lightcurve |
|---|---|---|---|---|---|---|---|
| A | 7643 | 6509 | 2 | 2 | 0.03% | 0.03% | 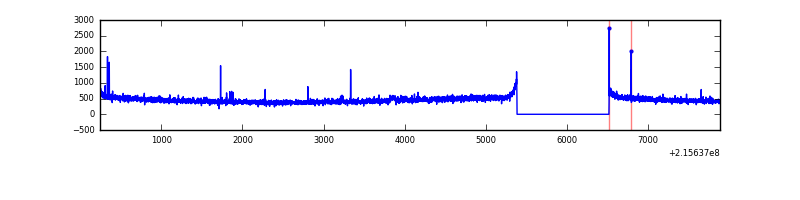 |
| B | 7643 | 6509 | 8 | 8 | 0.10% | 0.12% | 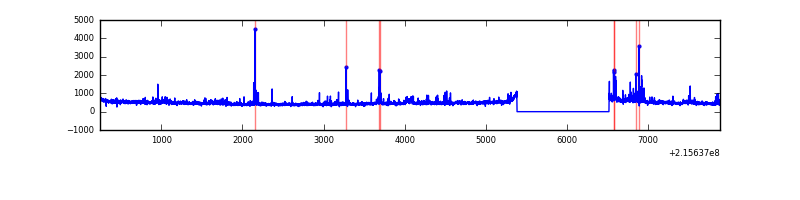 |
| C | 7643 | 6509 | 114 | 114 | 1.49% | 1.75% | 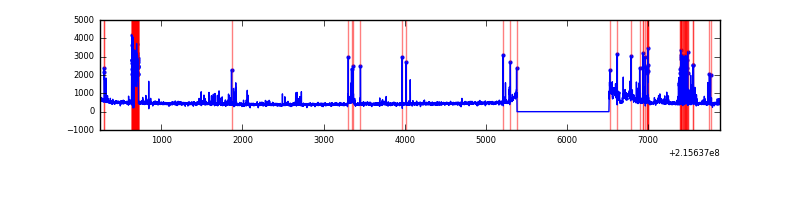 |
| D | 7643 | 6509 | 1266 | 1266 | 16.56% | 19.45% | 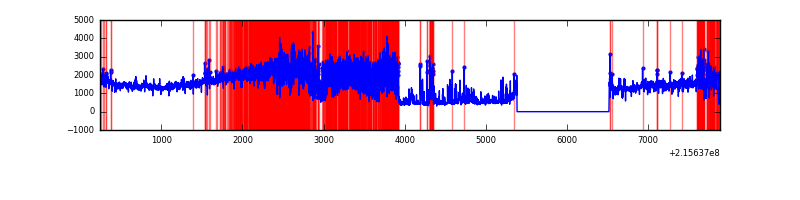 |
Top three noisy pixels from each quadrant. If the there are fewer than three noisy pixels in the level2.evt file, extra rows are filled as -1
| Pixel properties | Quadrant properties | ||||||
|---|---|---|---|---|---|---|---|
| Quadrant | DetID | PixID | Counts | Sigma | Mean | Median | Sigma |
| A | 15 | 234 | 55208 | 354.76 | 748 | 731 | 153.6 |
| A | 15 | 236 | 15867 | 98.57 | 748 | 731 | 153.6 |
| A | 0 | 226 | 7355 | 43.13 | 748 | 731 | 153.6 |
| B | 15 | 85 | 92425 | 630.5 | 757 | 739 | 145.4 |
| B | 0 | 229 | 74271 | 505.66 | 757 | 739 | 145.4 |
| B | 15 | 204 | 47164 | 319.25 | 757 | 739 | 145.4 |
| C | 9 | 247 | 449644 | 2662.32 | 726 | 730 | 168.6 |
| C | 1 | 16 | 216367 | 1278.85 | 726 | 730 | 168.6 |
| C | 9 | 68 | 10390 | 57.29 | 726 | 730 | 168.6 |
| D | 1 | 20 | 5975167 | 34760.11 | 701 | 681 | 171.9 |
| D | 2 | 63 | 557272 | 3238.3 | 701 | 681 | 171.9 |
| D | 2 | 152 | 293061 | 1701.09 | 701 | 681 | 171.9 |
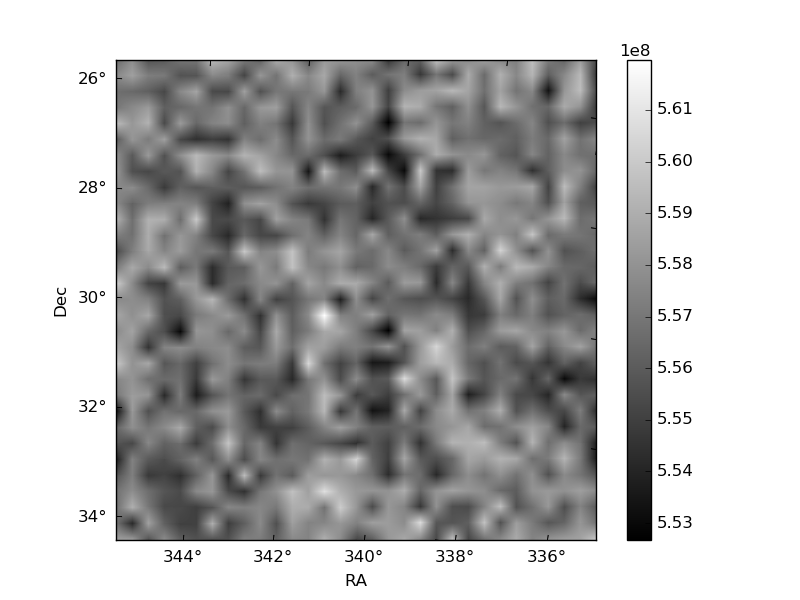
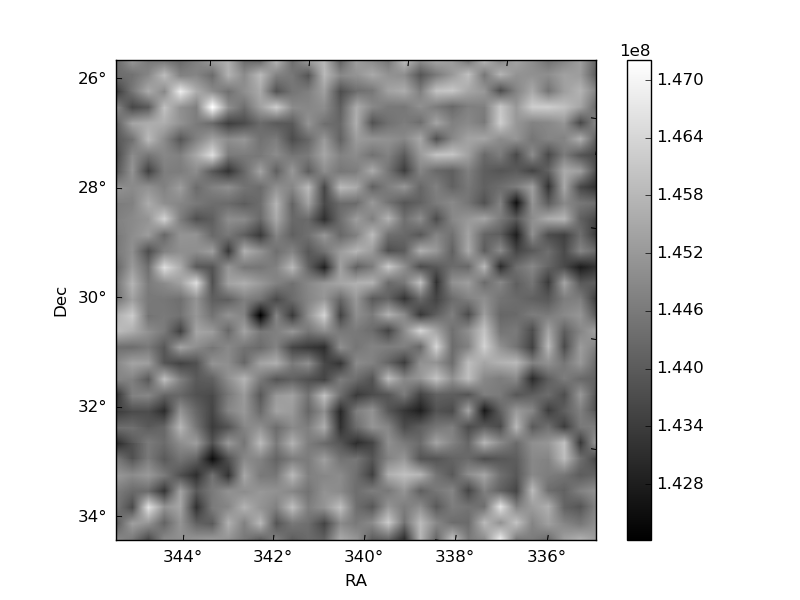
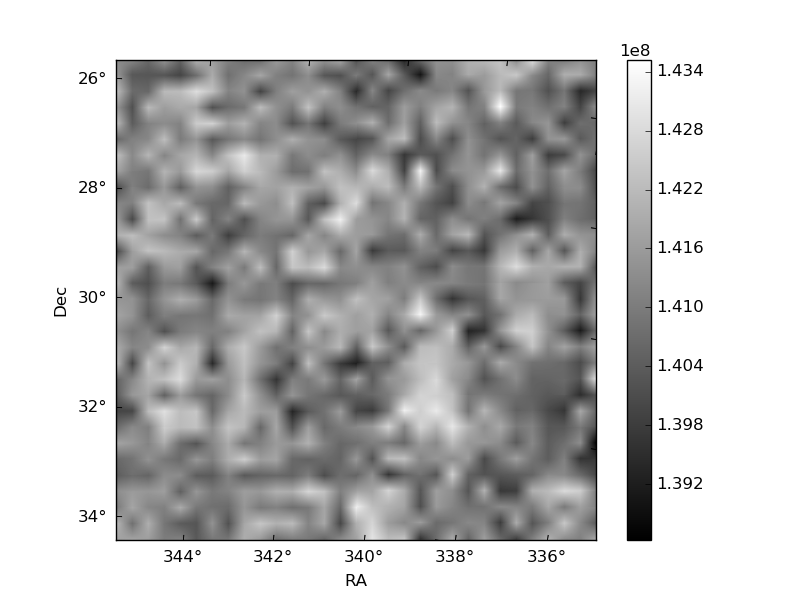
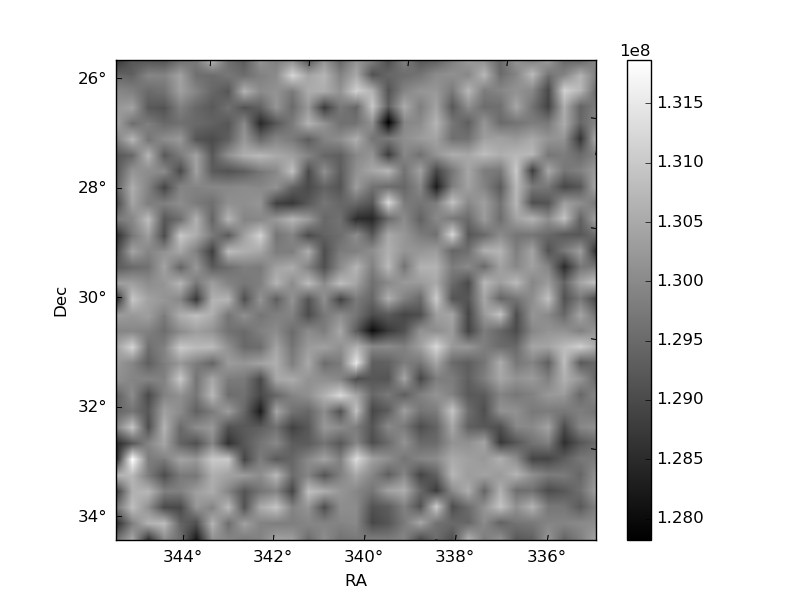
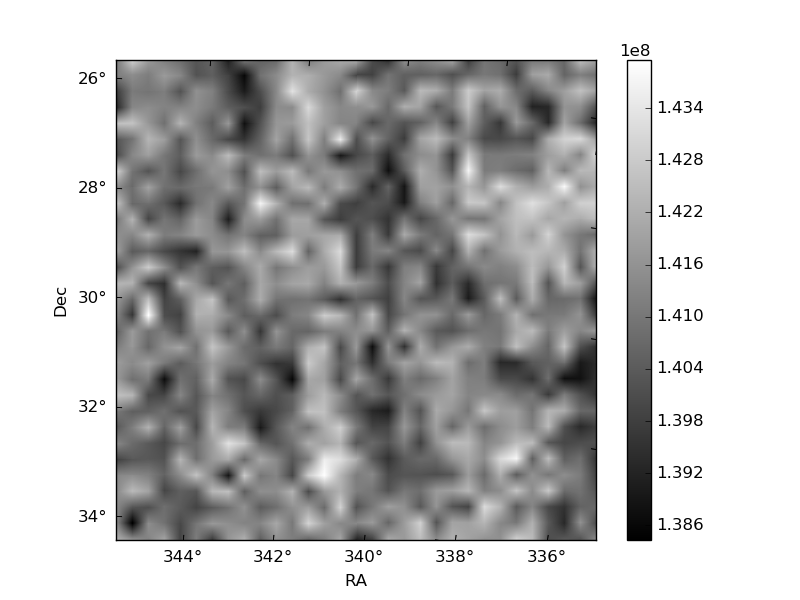
Histogram calculated using DETX and DETY for each event in the final _common_clean file
| Quadrant A | 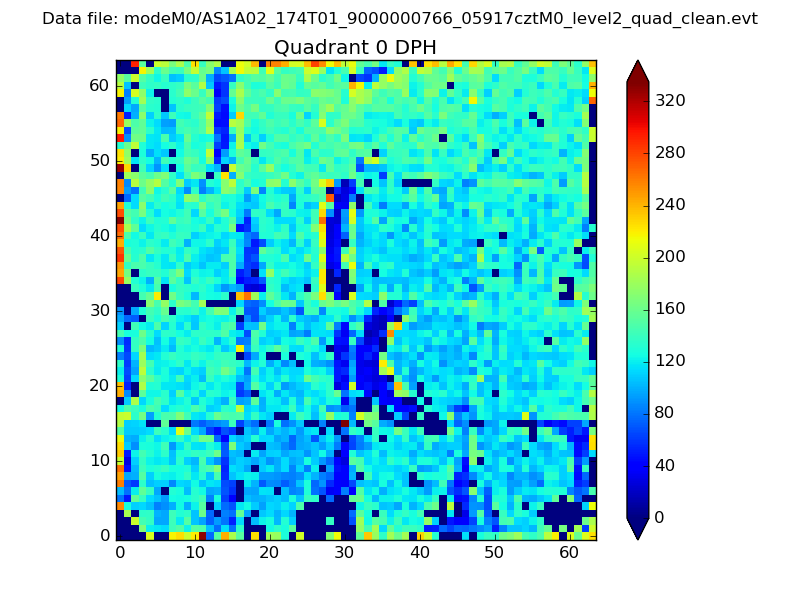 |
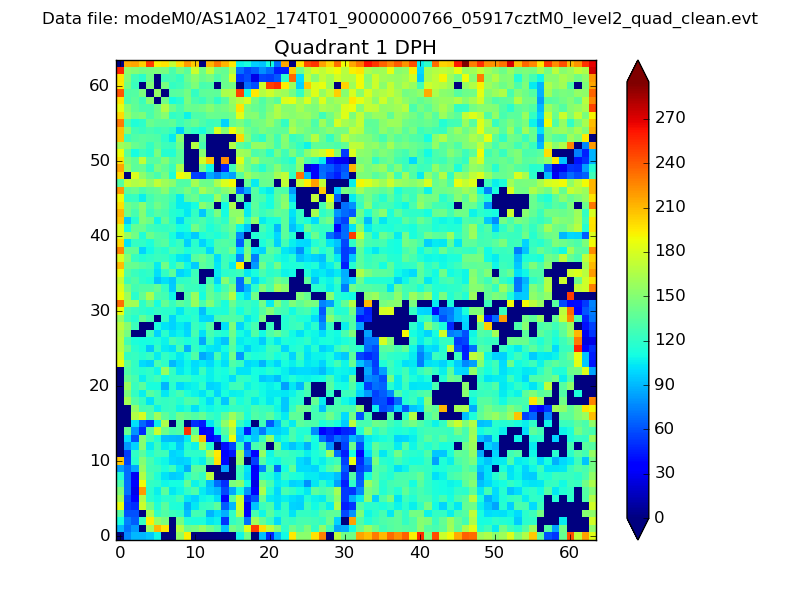 |
Quadrant B |
|---|---|---|---|
| Quadrant D | 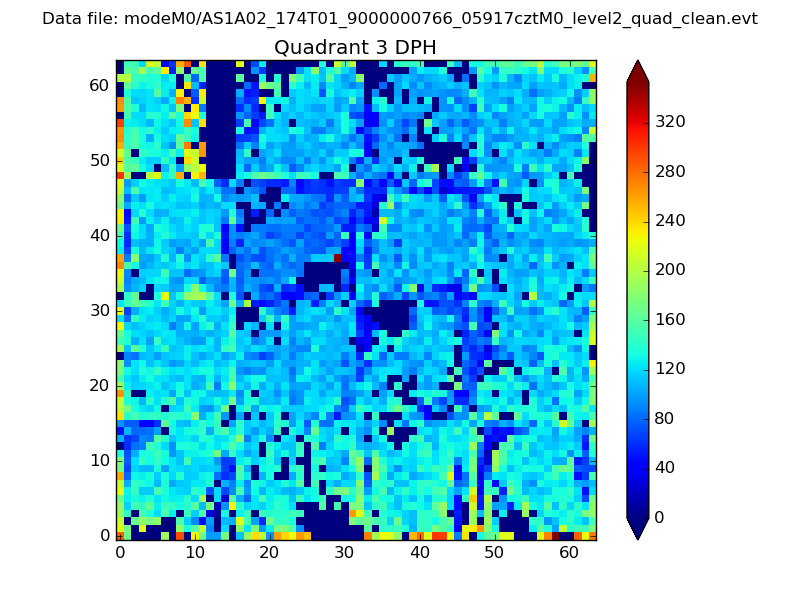 |
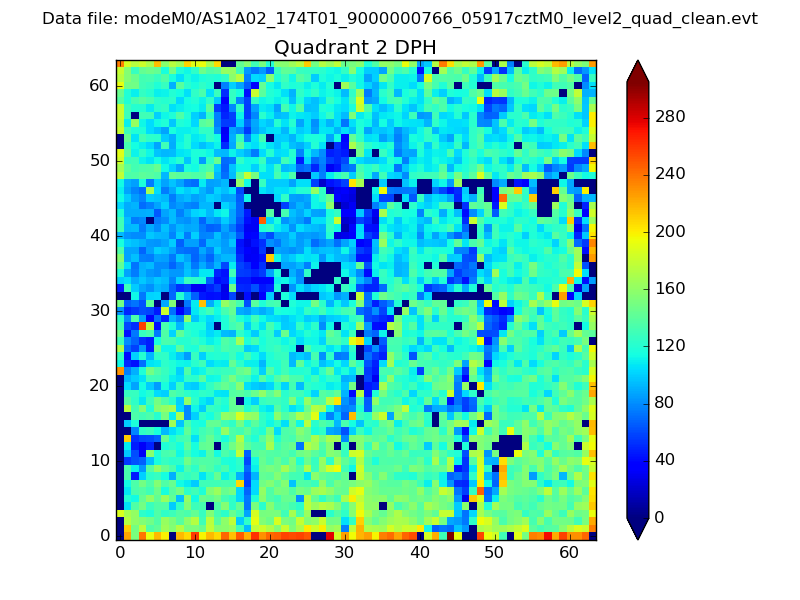 |
Quadrant C |
| Plot type | Count rate plots | Images |
|---|---|---|
| Comparison with Poisson distribution Blue bars denote a histogram of data divided into 1 sec bins. Red curve is a Poisson curve with rate = median count rate of data. |
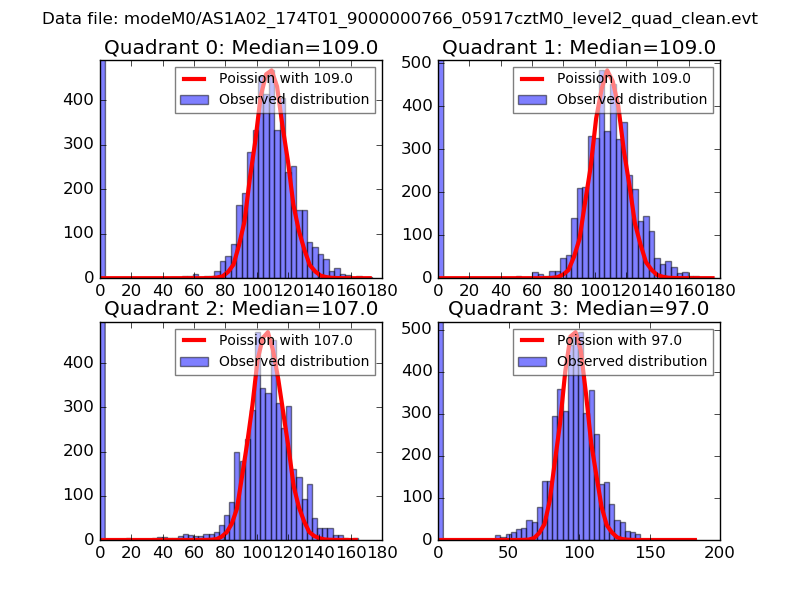 |
 |
| Quadrant-wise count rates Data is divided into 100 sec bins |
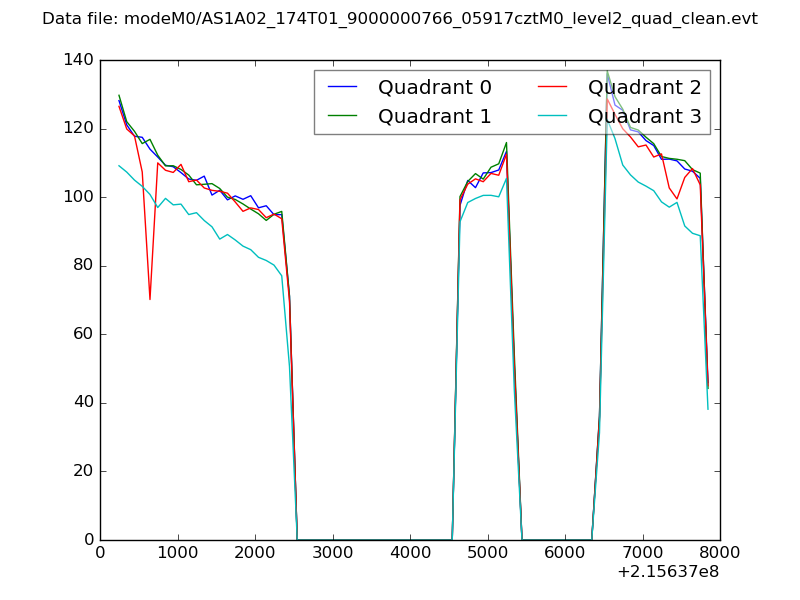 |
|
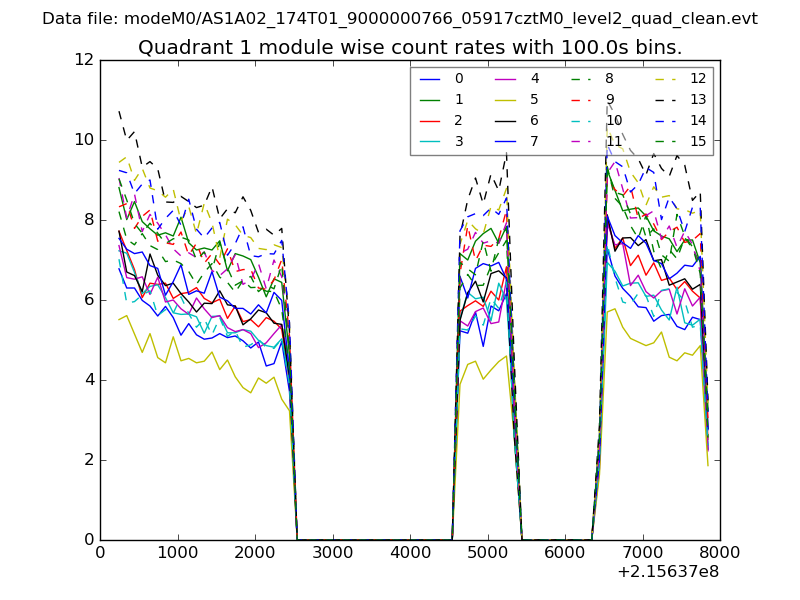
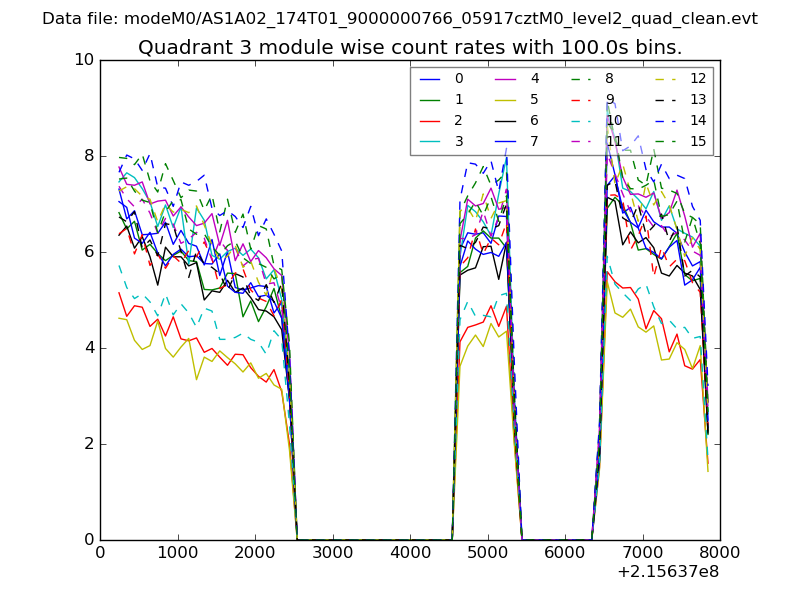
| Module-wise count rates for Quadrant A Data is divided into 100 sec bins |
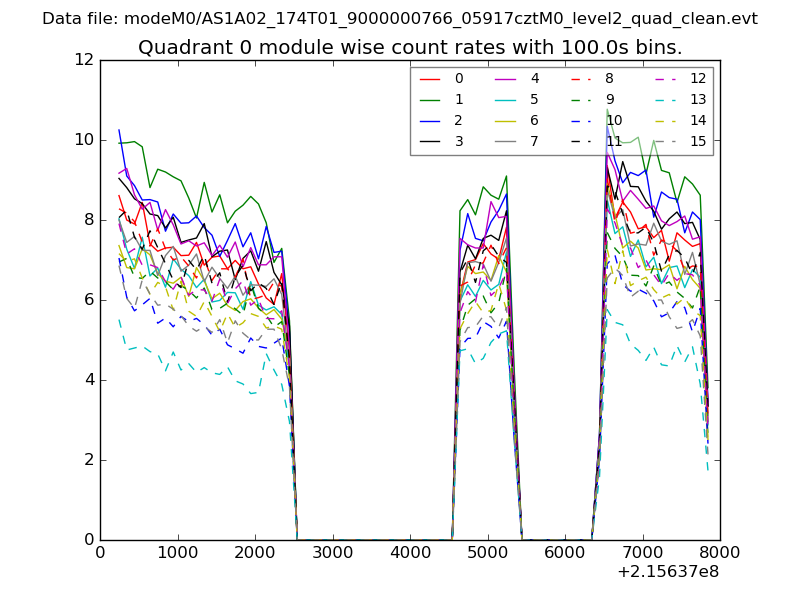 |
 |
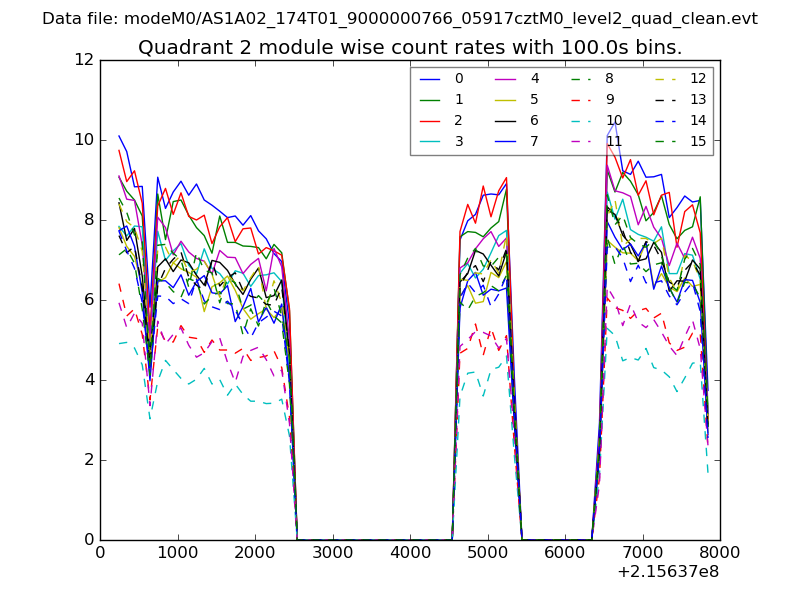
| Module-wise count rates for Quadrant B Data is divided into 100 sec bins |
 |
 |
| Module-wise count rates for Quadrant C Data is divided into 100 sec bins |
 |
 |
| Module-wise count rates for Quadrant D Data is divided into 100 sec bins |
 |
 |
| Parameter | Plot |
|---|---|
| CZT HV Monitor | 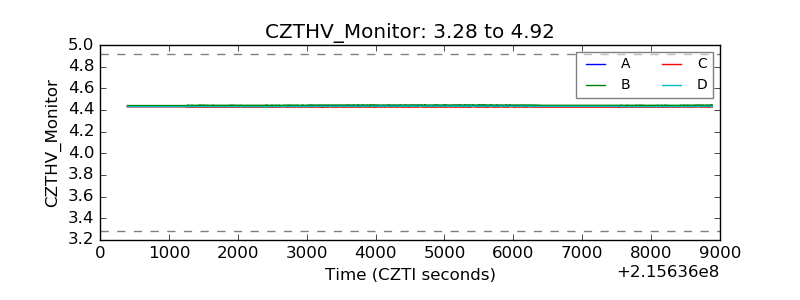 |
| D_VDD | 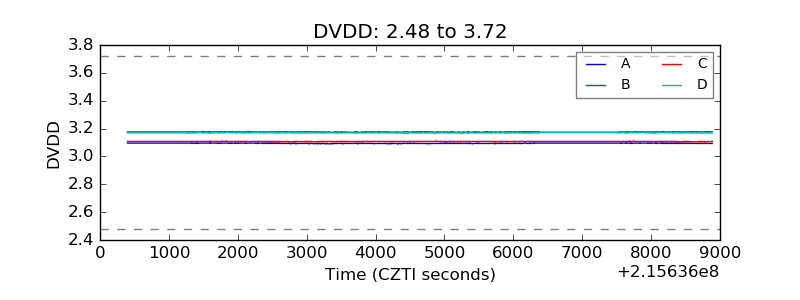 |
| Temperature 1 | 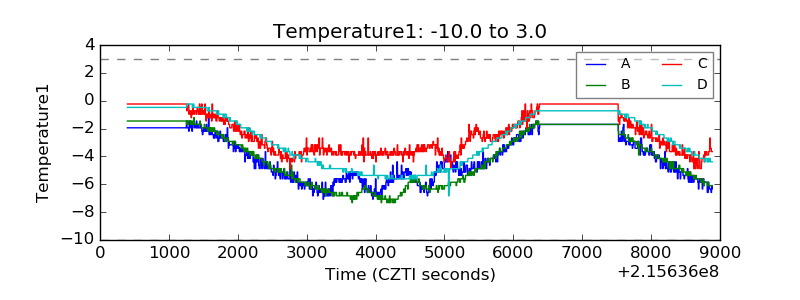 |
| Veto HV Monitor | 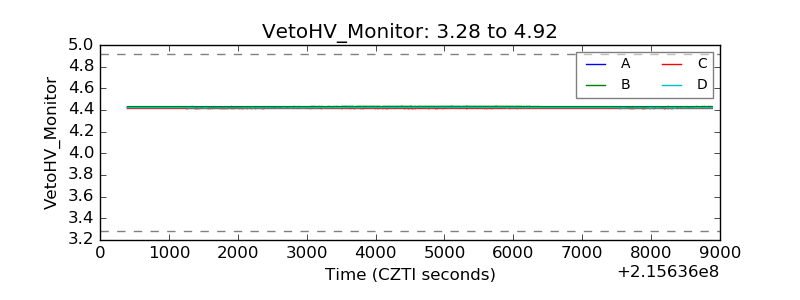 |
| Veto LLD | 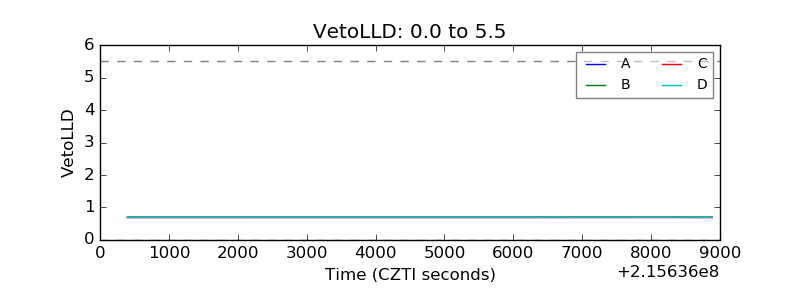 |
| Alpha Counter | 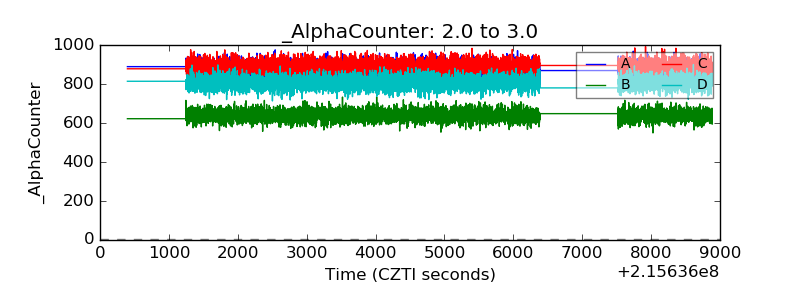 |
| _CPM_Rate | 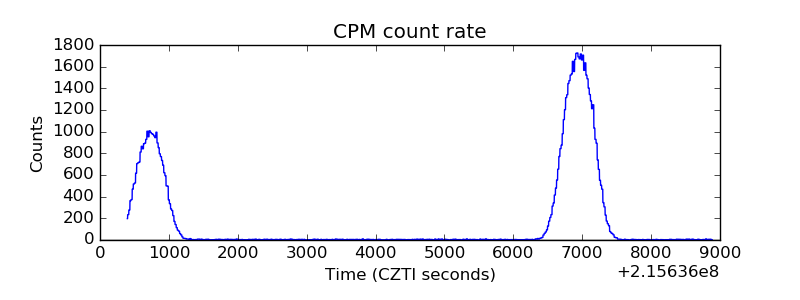 |
| CZT Counter | 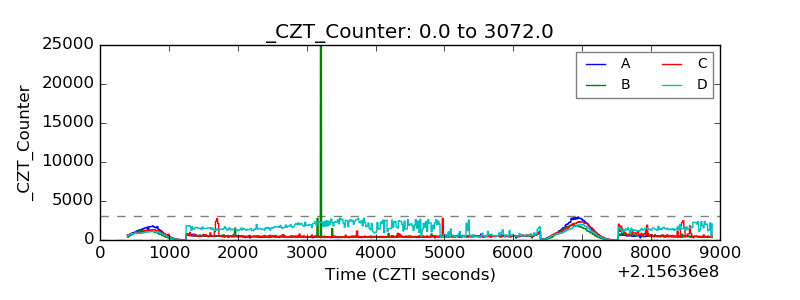 |
| +2.5 Volts monitor | 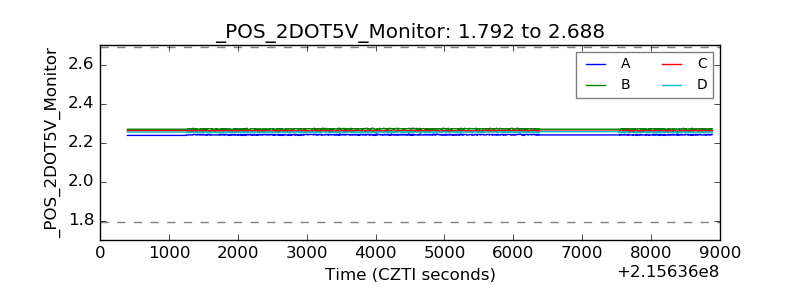 |
| +5 Volts monitor | 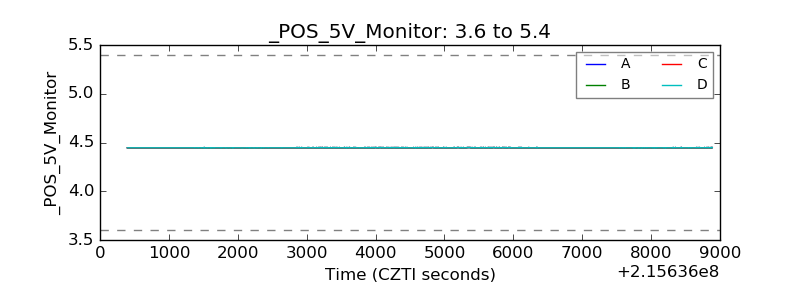 |
| _ROLL_ROT | 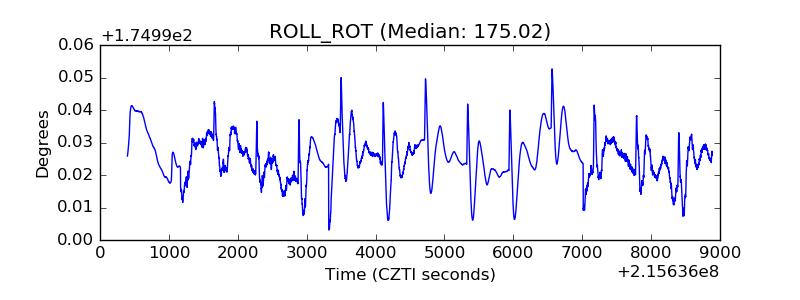 |
| _Roll_DEC | 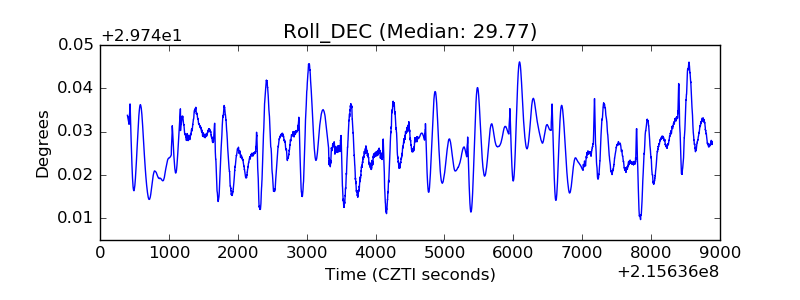 |
| _Roll_RA | 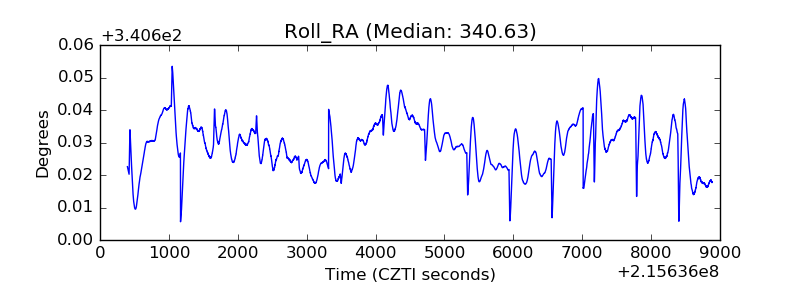 |
| Veto Counter | 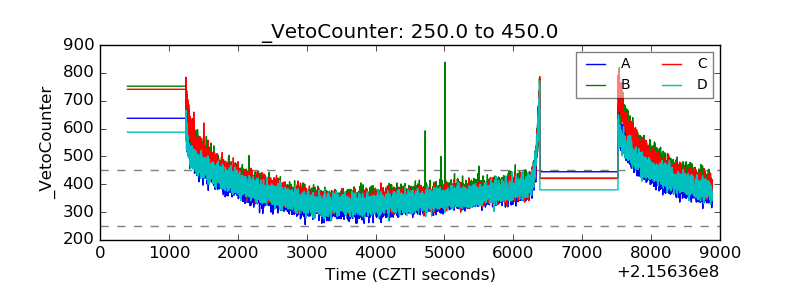 |