| Param | Original file | Final file |
|---|---|---|
| Filename | modeM0/AS1A02_174T01_9000000766_05918cztM0_level2.evt | modeM0/AS1A02_174T01_9000000766_05918cztM0_level2_quad_clean.evt |
| Size (bytes) | 624,913,920 | 75,669,120 |
| Size | 596.0 MB | 72.2 MB |
| Events in quadrant A | 3,045,619 | 475,522 |
| Events in quadrant B | 3,229,469 | 486,090 |
| Events in quadrant C | 3,664,635 | 467,500 |
| Events in quadrant D | 8,556,842 | 418,979 |
| Mode M9 | |||
|---|---|---|---|
| Quadrant | BADHDUFLAG | Total packets | Discarded packets |
| A | 0 | 22 | 0 |
| B | 0 | 22 | 0 |
| C | 0 | 22 | 0 |
| D | 0 | 23 | 0 |
| Mode M0 | |||
|---|---|---|---|
| Quadrant | BADHDUFLAG | Total packets | Discarded packets |
| A | 0 | 13479 | 7 |
| B | 0 | 13865 | 2 |
| C | 0 | 15267 | 19 |
| D | 0 | 29835 | 15 |
| Mode SS | |||
|---|---|---|---|
| Quadrant | BADHDUFLAG | Total packets | Discarded packets |
| A | 0 | 130 | 0 |
| B | 0 | 130 | 0 |
| C | 0 | 130 | 0 |
| D | 0 | 130 | 0 |
| Quadrant | Total seconds | Saturated seconds | Saturation percentage |
|---|---|---|---|
| A | 6344 | 45 | 0.709332% |
| B | 6346 | 37 | 0.583044% |
| C | 6341 | 161 | 2.539032% |
| D | 6343 | 816 | 12.864575% |
Noise dominated data is calculated using 1-second bins in cleaned event files. If a bin has >2000 counts, and if more than 50% of those come from <1% of pixels, then it is considered to be noise-dominated and hence unusable.
| Quadrant | # 1 sec bins | Bins with >0 counts | Bins with >2000 counts | High rate bins dominated by noise | Noise dominated (total time) | Noise dominated (detector-on time) | Marked lightcurve |
|---|---|---|---|---|---|---|---|
| A | 7591 | 6347 | 28 | 28 | 0.37% | 0.44% | 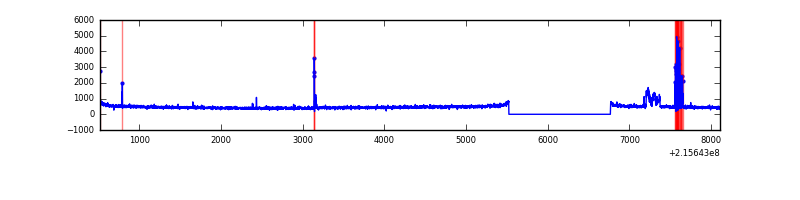 |
| B | 7591 | 6347 | 11 | 11 | 0.14% | 0.17% | 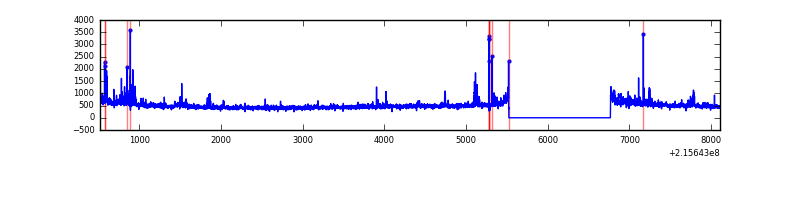 |
| C | 7591 | 6347 | 105 | 105 | 1.38% | 1.65% | 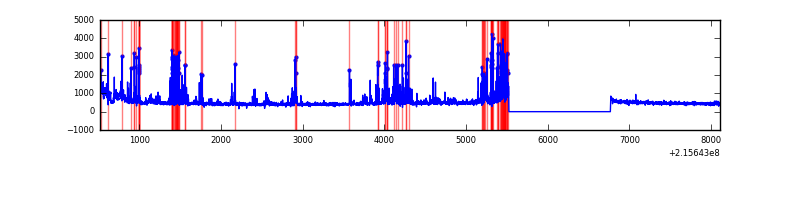 |
| D | 7591 | 6347 | 1201 | 1201 | 15.82% | 18.92% | 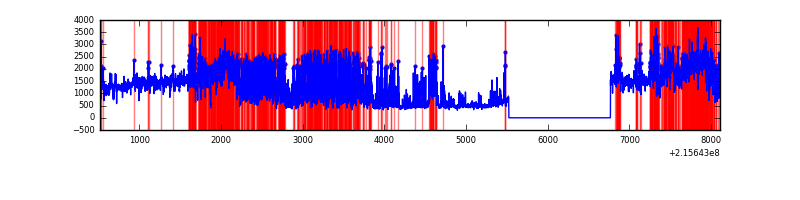 |
Top three noisy pixels from each quadrant. If the there are fewer than three noisy pixels in the level2.evt file, extra rows are filled as -1
| Pixel properties | Quadrant properties | ||||||
|---|---|---|---|---|---|---|---|
| Quadrant | DetID | PixID | Counts | Sigma | Mean | Median | Sigma |
| A | 15 | 236 | 179067 | 1192.21 | 735 | 716 | 149.6 |
| A | 15 | 234 | 25872 | 168.16 | 735 | 716 | 149.6 |
| A | 0 | 226 | 7204 | 43.37 | 735 | 716 | 149.6 |
| B | 0 | 229 | 74008 | 512.87 | 751 | 735 | 142.9 |
| B | 15 | 204 | 59083 | 408.4 | 751 | 735 | 142.9 |
| B | 4 | 80 | 58442 | 403.91 | 751 | 735 | 142.9 |
| C | 9 | 247 | 851395 | 5082.24 | 717 | 722 | 167.4 |
| C | 9 | 68 | 8098 | 44.07 | 717 | 722 | 167.4 |
| C | 13 | 61 | 5784 | 30.24 | 717 | 722 | 167.4 |
| D | 1 | 20 | 5114194 | 29753.69 | 697 | 676 | 171.9 |
| D | 2 | 152 | 399019 | 2317.81 | 697 | 676 | 171.9 |
| D | 2 | 63 | 172034 | 997.07 | 697 | 676 | 171.9 |
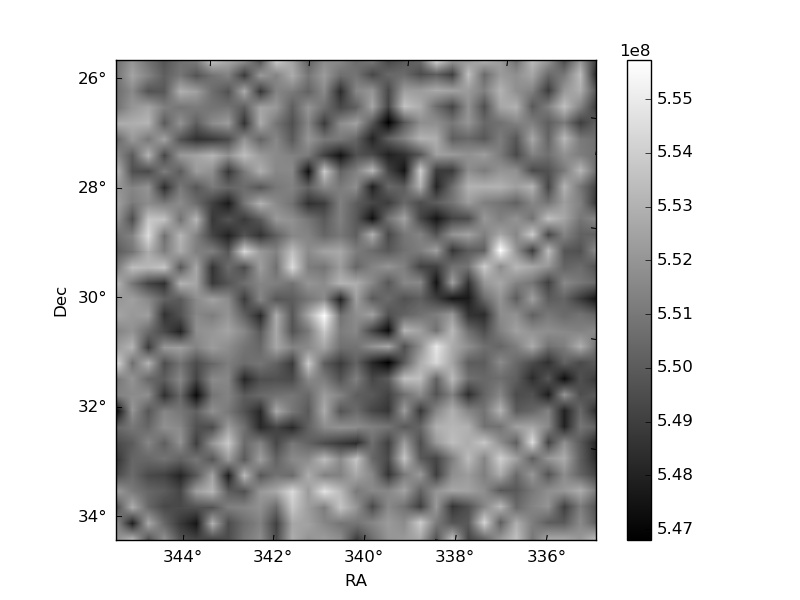
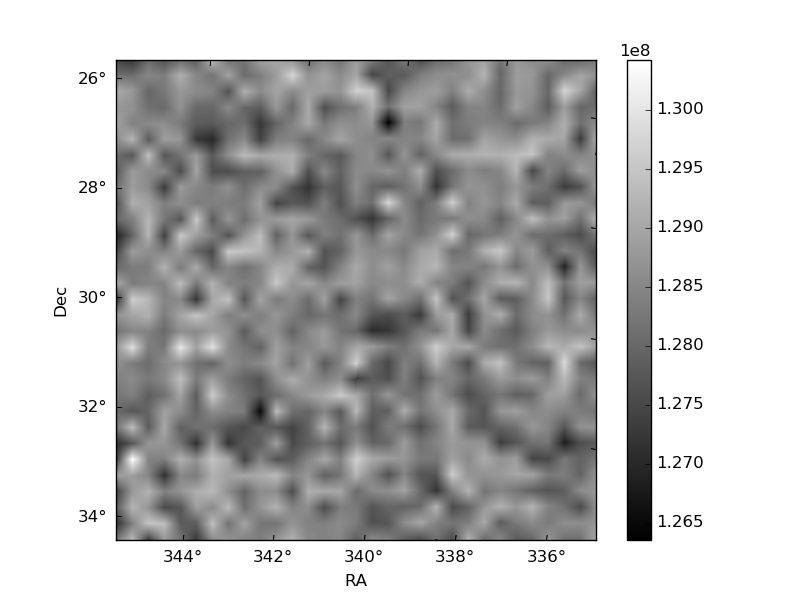
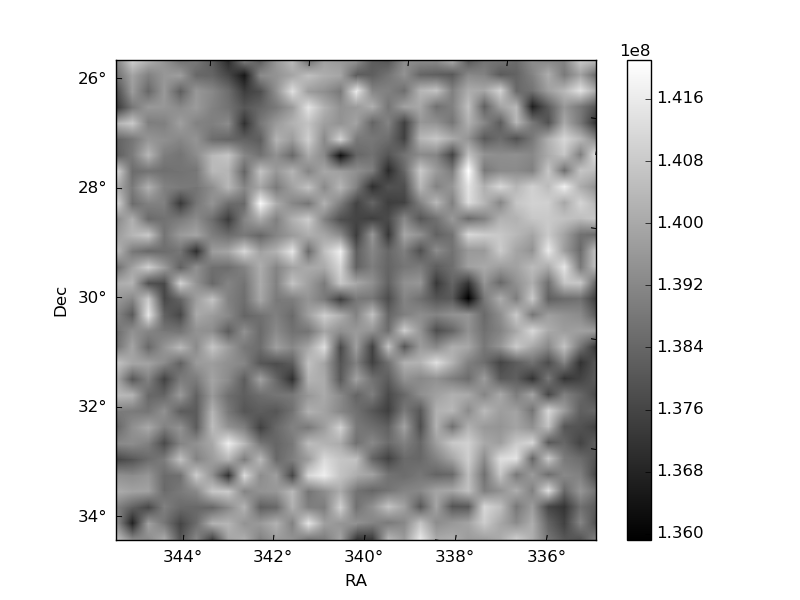
Histogram calculated using DETX and DETY for each event in the final _common_clean file
| Quadrant A | 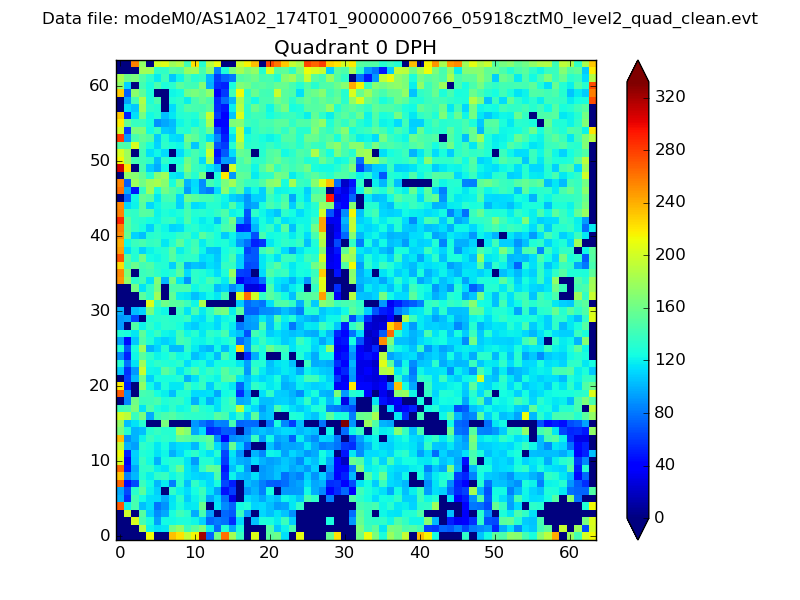 |
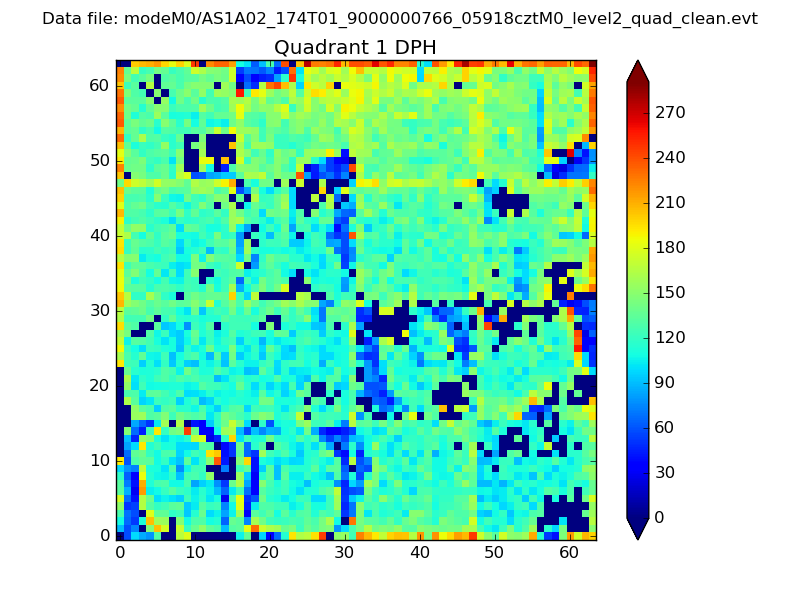 |
Quadrant B |
|---|---|---|---|
| Quadrant D | 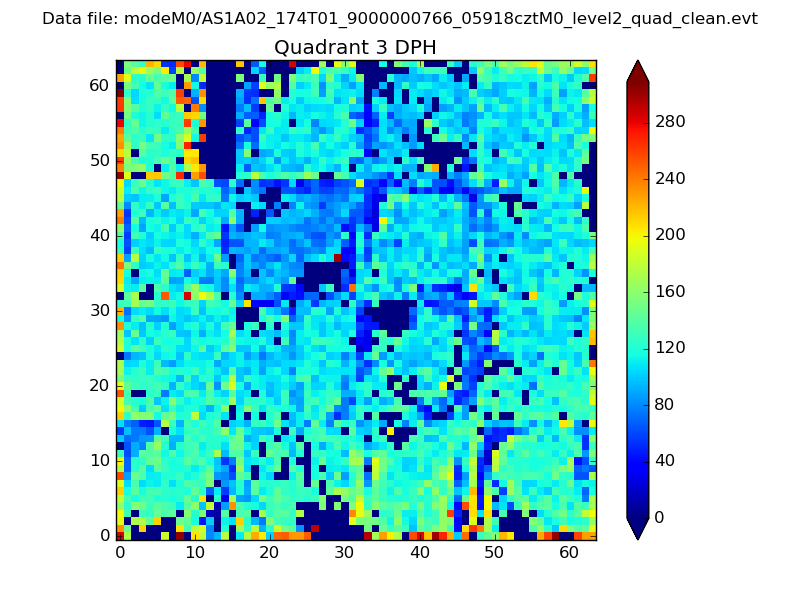 |
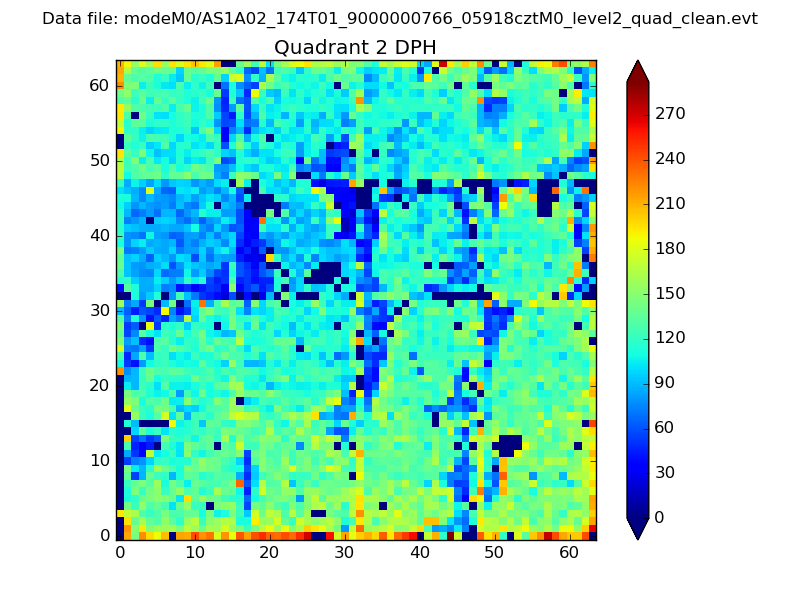 |
Quadrant C |
| Plot type | Count rate plots | Images |
|---|---|---|
| Comparison with Poisson distribution Blue bars denote a histogram of data divided into 1 sec bins. Red curve is a Poisson curve with rate = median count rate of data. |
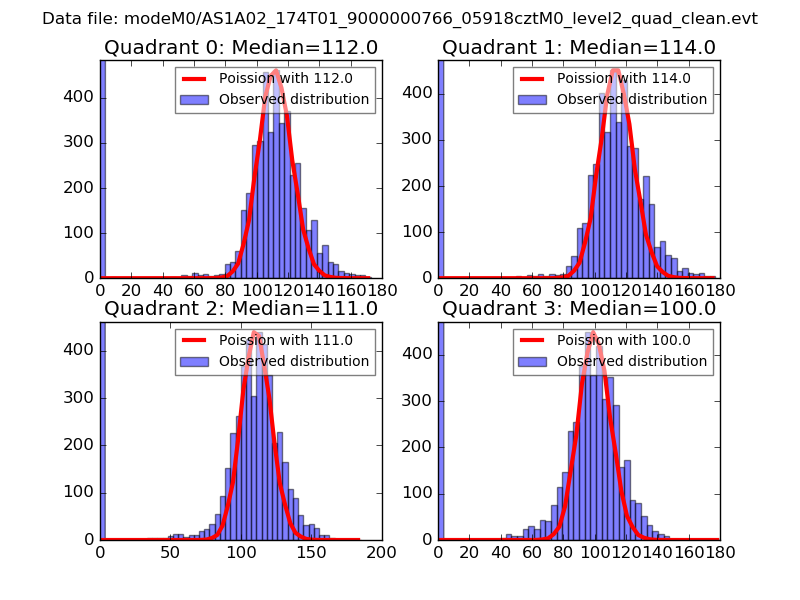 |
 |
| Quadrant-wise count rates Data is divided into 100 sec bins |
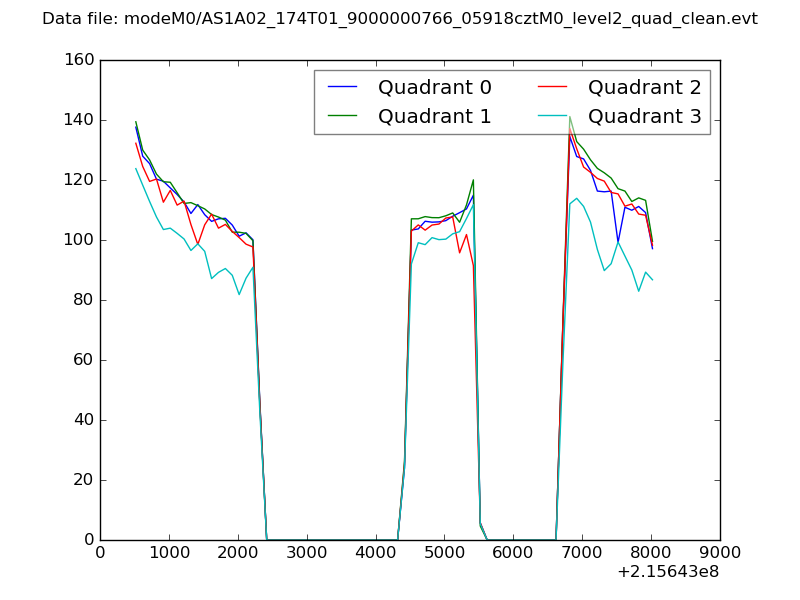 |
|
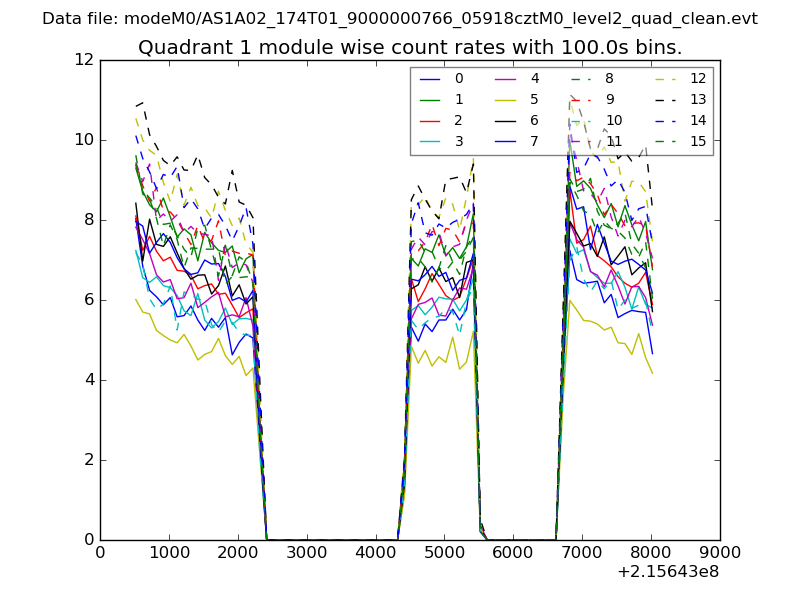
| Module-wise count rates for Quadrant A Data is divided into 100 sec bins |
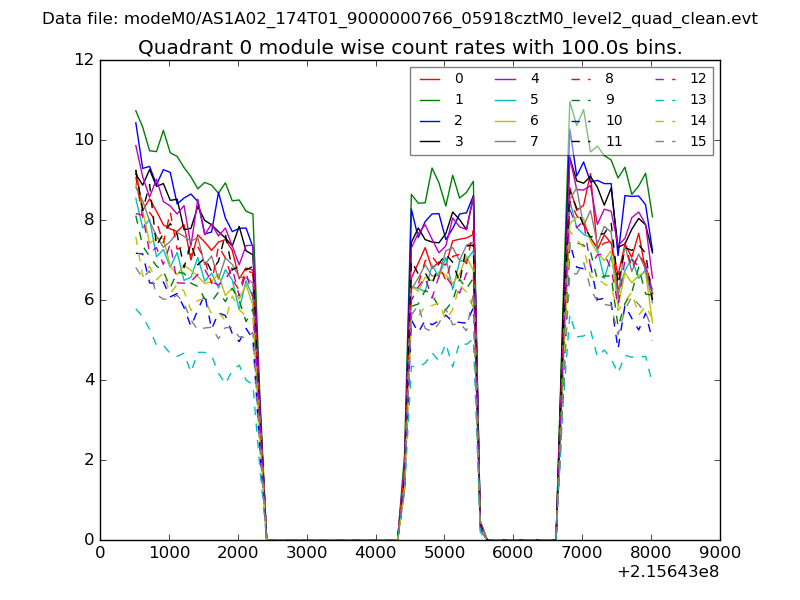 |
 |
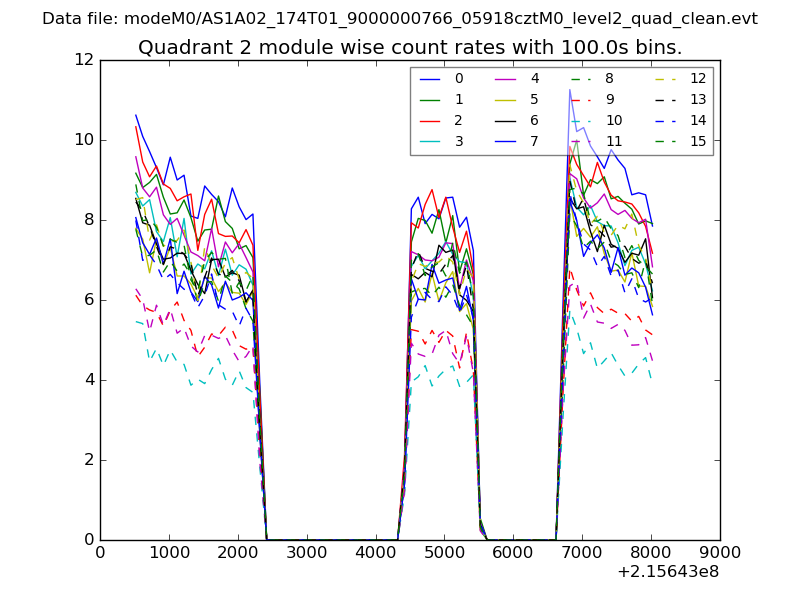
| Module-wise count rates for Quadrant B Data is divided into 100 sec bins |
 |
 |
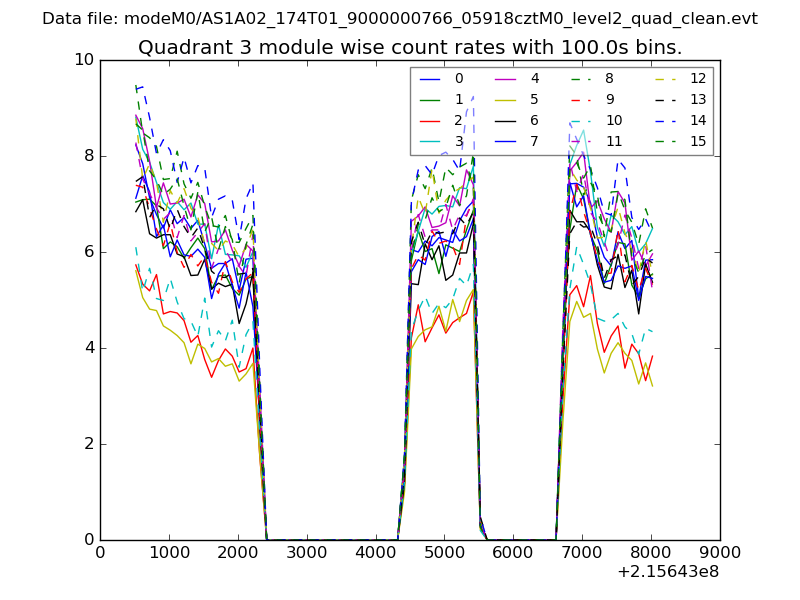
| Module-wise count rates for Quadrant C Data is divided into 100 sec bins |
 |
 |
| Module-wise count rates for Quadrant D Data is divided into 100 sec bins |
 |
 |
| Parameter | Plot |
|---|---|
| CZT HV Monitor | 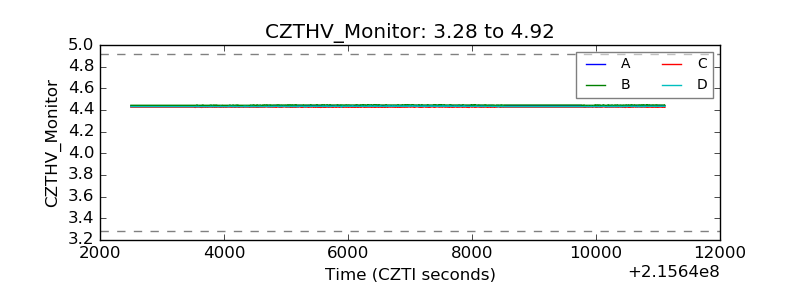 |
| D_VDD | 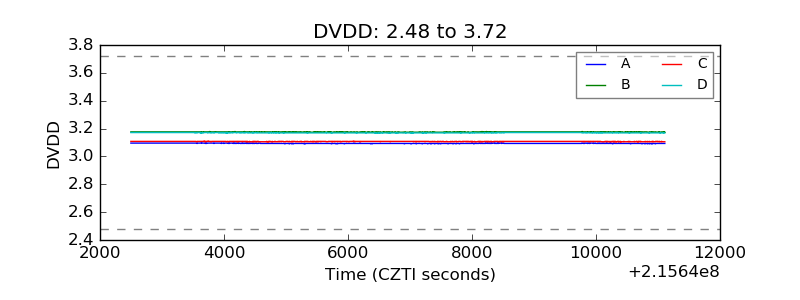 |
| Temperature 1 | 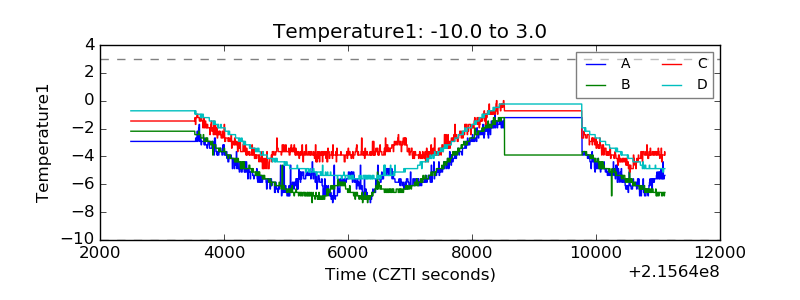 |
| Veto HV Monitor | 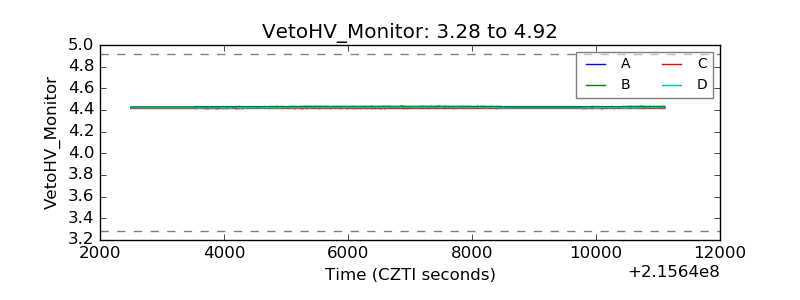 |
| Veto LLD | 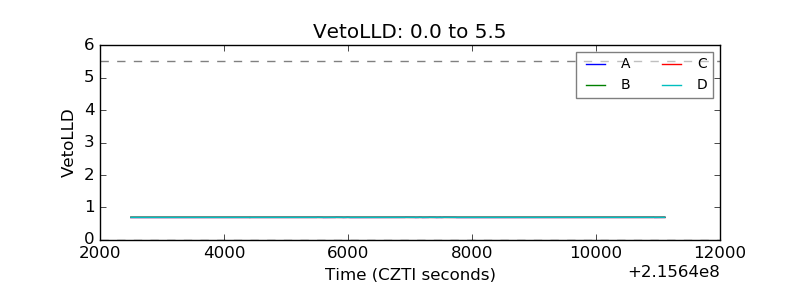 |
| Alpha Counter | 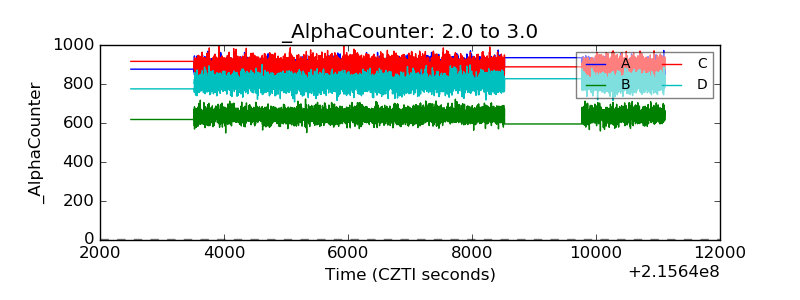 |
| _CPM_Rate | 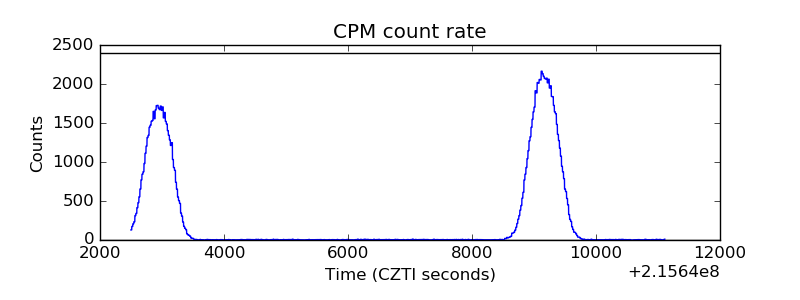 |
| CZT Counter | 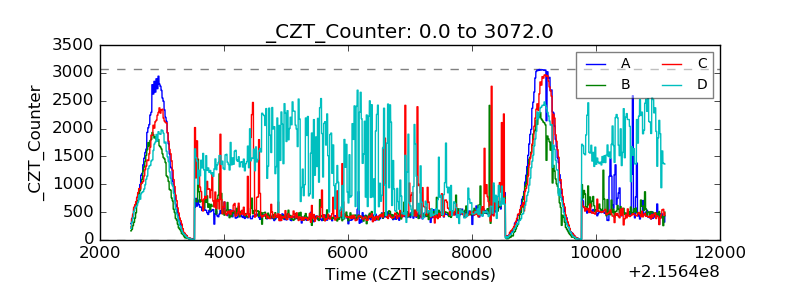 |
| +2.5 Volts monitor |  |
| +5 Volts monitor |  |
| _ROLL_ROT | 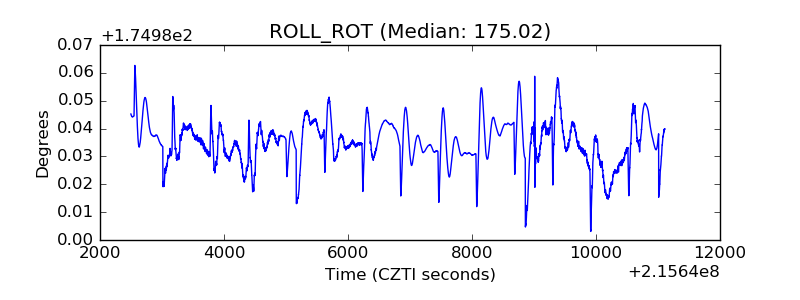 |
| _Roll_DEC | 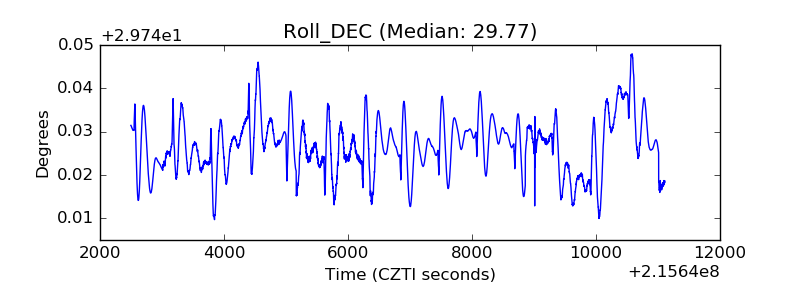 |
| _Roll_RA | 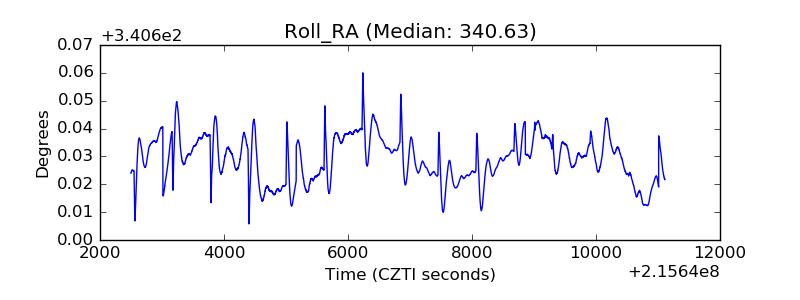 |
| Veto Counter |  |