| Param | Original file | Final file |
|---|---|---|
| Filename | modeM0/AS1A02_174T01_9000000766_05919cztM0_level2.evt | modeM0/AS1A02_174T01_9000000766_05919cztM0_level2_quad_clean.evt |
| Size (bytes) | 703,287,360 | 71,268,480 |
| Size | 670.7 MB | 68.0 MB |
| Events in quadrant A | 3,047,571 | 449,672 |
| Events in quadrant B | 3,316,566 | 461,198 |
| Events in quadrant C | 3,582,004 | 443,261 |
| Events in quadrant D | 10,930,867 | 366,759 |
| Mode M9 | |||
|---|---|---|---|
| Quadrant | BADHDUFLAG | Total packets | Discarded packets |
| A | 0 | 25 | 0 |
| B | 0 | 25 | 0 |
| C | 0 | 25 | 0 |
| D | 0 | 25 | 0 |
| Mode M0 | |||
|---|---|---|---|
| Quadrant | BADHDUFLAG | Total packets | Discarded packets |
| A | 0 | 13310 | 5 |
| B | 0 | 13989 | 2 |
| C | 0 | 14908 | 6 |
| D | 0 | 36766 | 2 |
| Mode SS | |||
|---|---|---|---|
| Quadrant | BADHDUFLAG | Total packets | Discarded packets |
| A | 0 | 128 | 0 |
| B | 0 | 128 | 0 |
| C | 0 | 128 | 0 |
| D | 0 | 128 | 0 |
| Quadrant | Total seconds | Saturated seconds | Saturation percentage |
|---|---|---|---|
| A | 6254 | 43 | 0.687560% |
| B | 6255 | 53 | 0.847322% |
| C | 6253 | 185 | 2.958580% |
| D | 6255 | 2116 | 33.828937% |
Noise dominated data is calculated using 1-second bins in cleaned event files. If a bin has >2000 counts, and if more than 50% of those come from <1% of pixels, then it is considered to be noise-dominated and hence unusable.
| Quadrant | # 1 sec bins | Bins with >0 counts | Bins with >2000 counts | High rate bins dominated by noise | Noise dominated (total time) | Noise dominated (detector-on time) | Marked lightcurve |
|---|---|---|---|---|---|---|---|
| A | 8770 | 6257 | 23 | 23 | 0.26% | 0.37% | 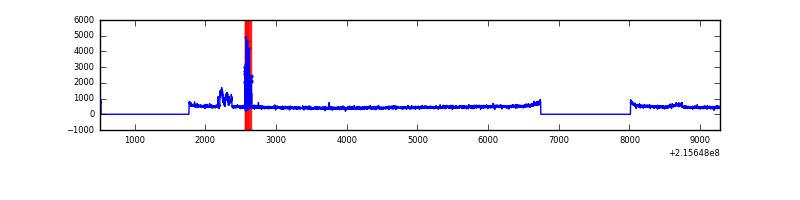 |
| B | 8770 | 6257 | 12 | 12 | 0.14% | 0.19% | 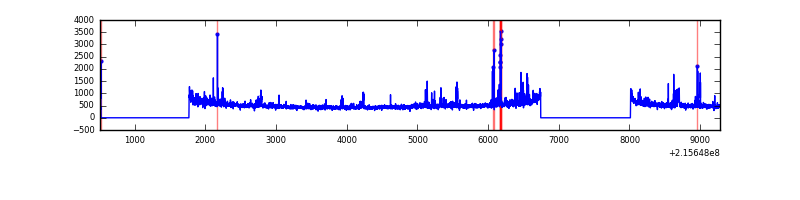 |
| C | 8770 | 6257 | 79 | 79 | 0.90% | 1.26% | 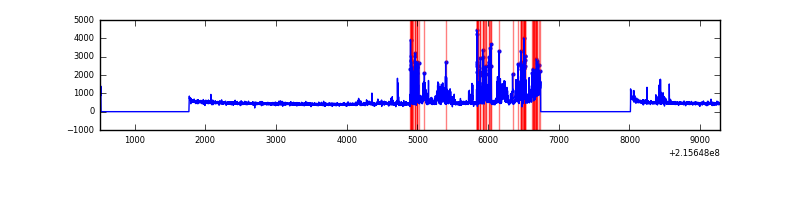 |
| D | 8770 | 6257 | 2138 | 2138 | 24.38% | 34.17% | 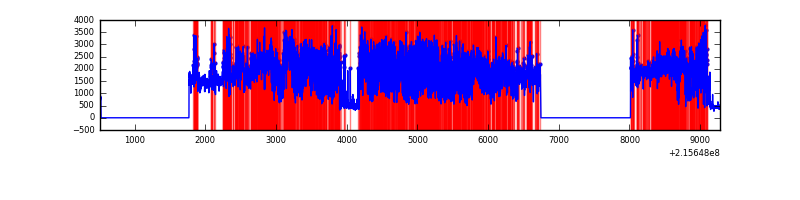 |
Top three noisy pixels from each quadrant. If the there are fewer than three noisy pixels in the level2.evt file, extra rows are filled as -1
| Pixel properties | Quadrant properties | ||||||
|---|---|---|---|---|---|---|---|
| Quadrant | DetID | PixID | Counts | Sigma | Mean | Median | Sigma |
| A | 15 | 236 | 176545 | 1175.33 | 739 | 723 | 149.6 |
| A | 0 | 47 | 24722 | 160.43 | 739 | 723 | 149.6 |
| A | 0 | 226 | 7254 | 43.66 | 739 | 723 | 149.6 |
| B | 4 | 80 | 118196 | 815.13 | 757 | 741 | 144.1 |
| B | 15 | 255 | 84851 | 583.72 | 757 | 741 | 144.1 |
| B | 15 | 204 | 82462 | 567.14 | 757 | 741 | 144.1 |
| C | 9 | 247 | 750681 | 4464.27 | 722 | 728 | 168.0 |
| C | 9 | 68 | 5645 | 29.27 | 722 | 728 | 168.0 |
| C | 13 | 61 | 5638 | 29.23 | 722 | 728 | 168.0 |
| D | 1 | 20 | 7430966 | 45654.41 | 662 | 640 | 162.8 |
| D | 2 | 152 | 515194 | 3161.59 | 662 | 640 | 162.8 |
| D | 2 | 63 | 269298 | 1650.72 | 662 | 640 | 162.8 |
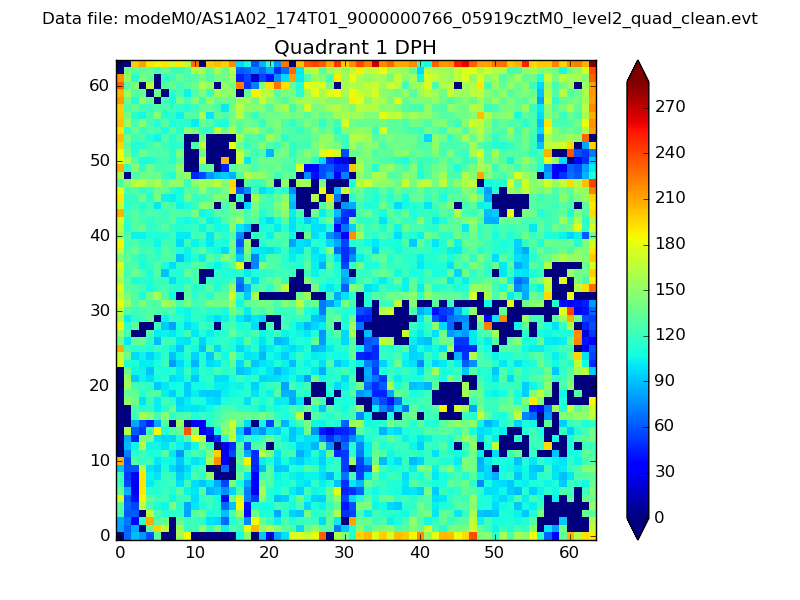
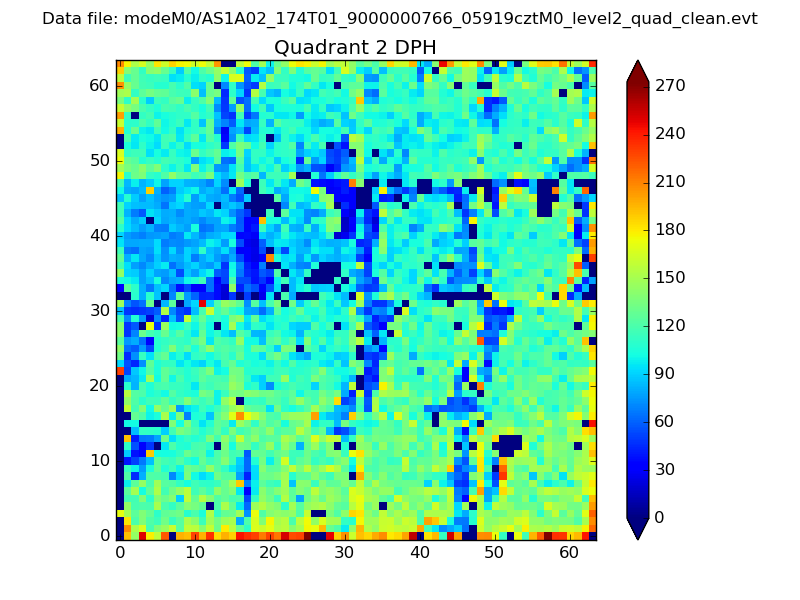
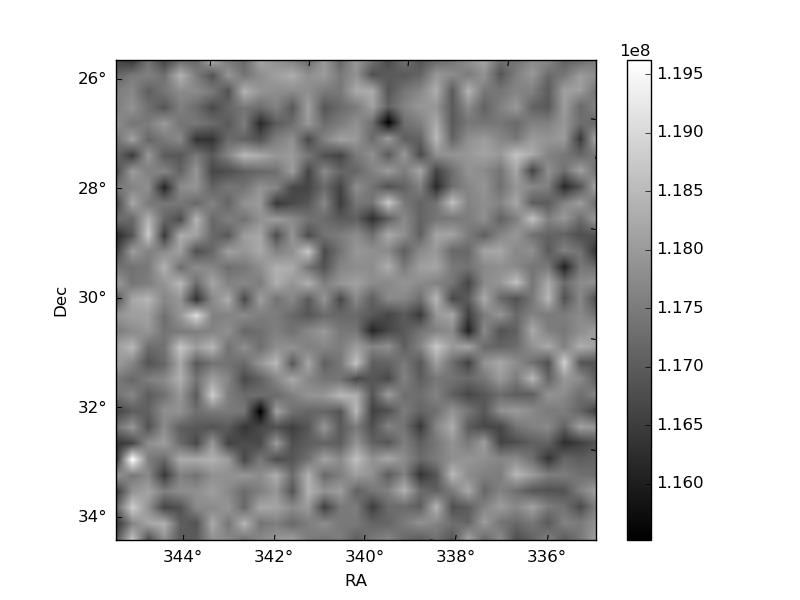
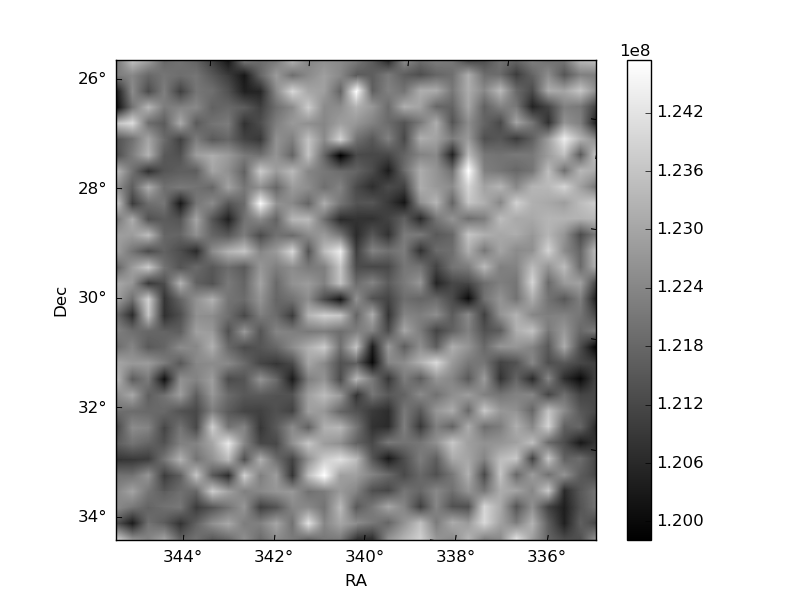
Histogram calculated using DETX and DETY for each event in the final _common_clean file
| Quadrant A | 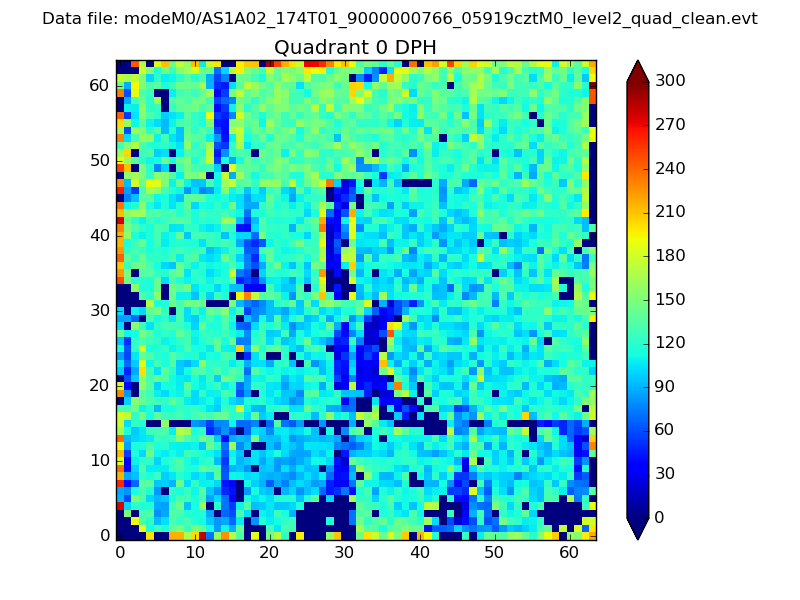 |
 |
Quadrant B |
|---|---|---|---|
| Quadrant D | 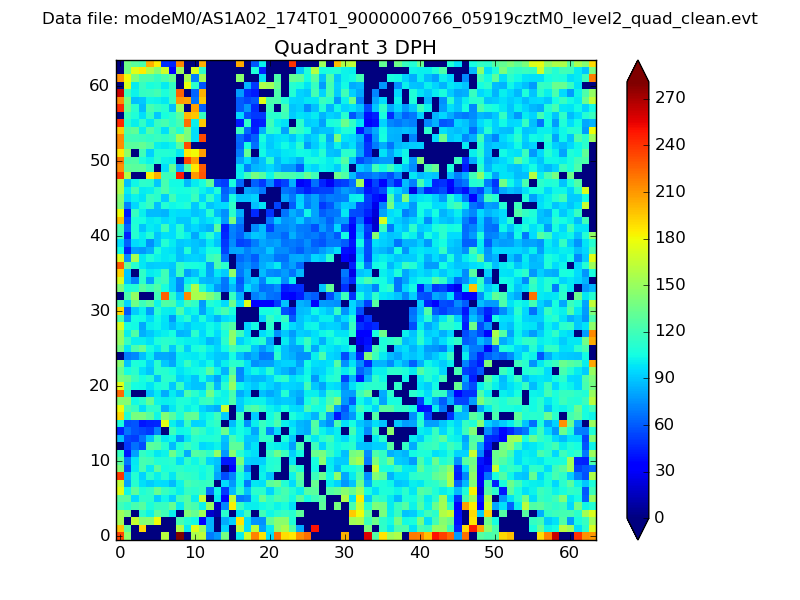 |
 |
Quadrant C |
| Plot type | Count rate plots | Images |
|---|---|---|
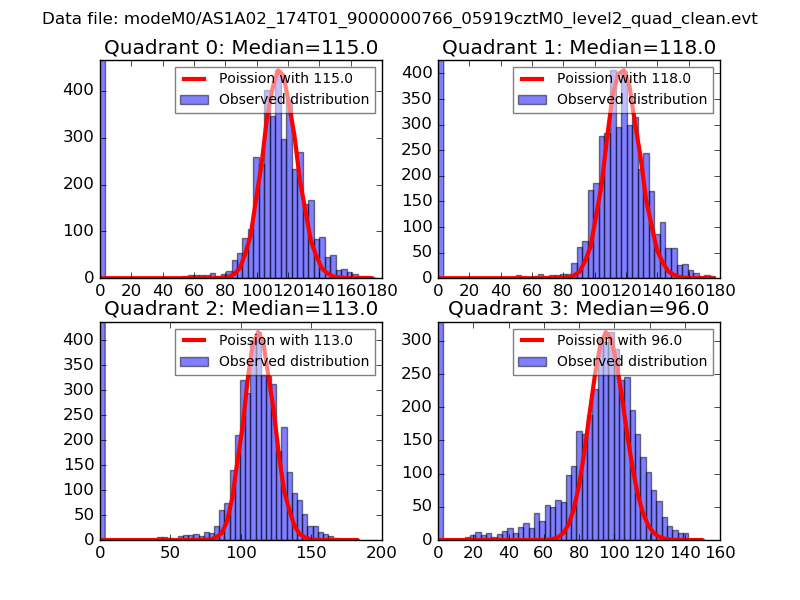
| Comparison with Poisson distribution Blue bars denote a histogram of data divided into 1 sec bins. Red curve is a Poisson curve with rate = median count rate of data. |
 |
 |
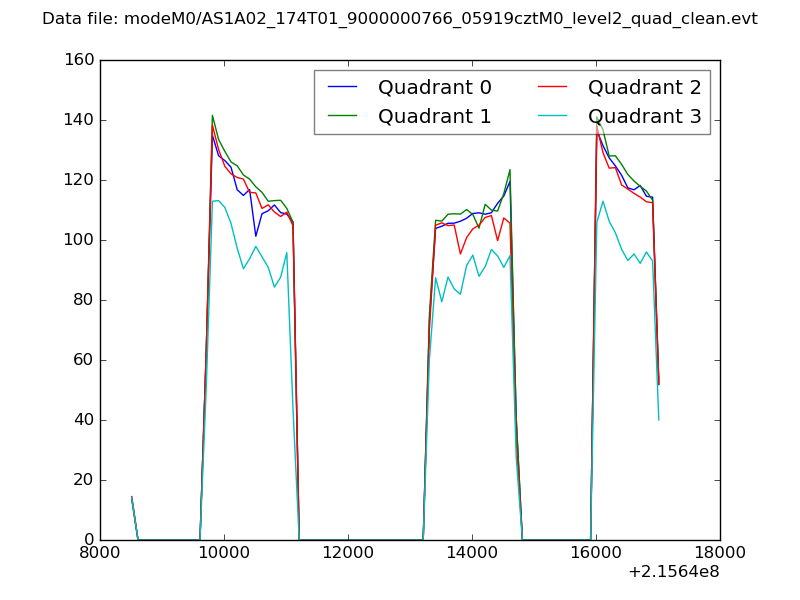
| Quadrant-wise count rates Data is divided into 100 sec bins |
 |
|
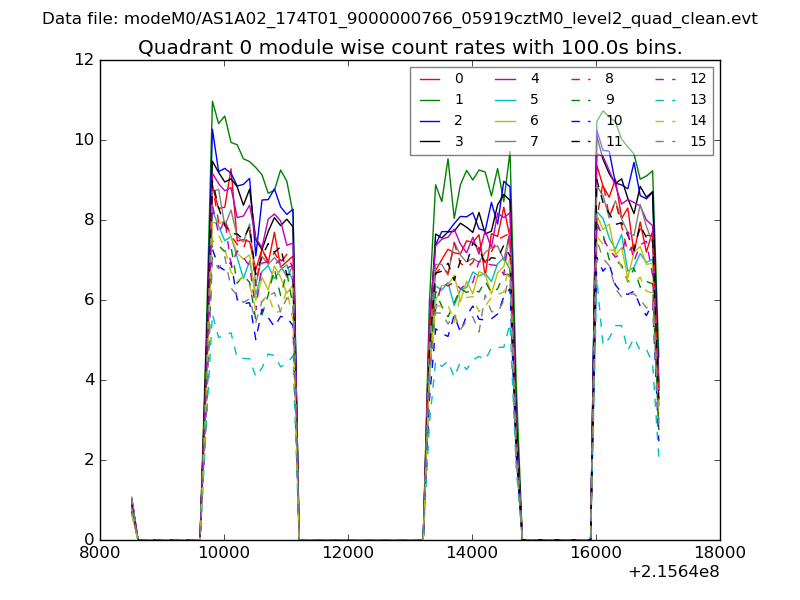
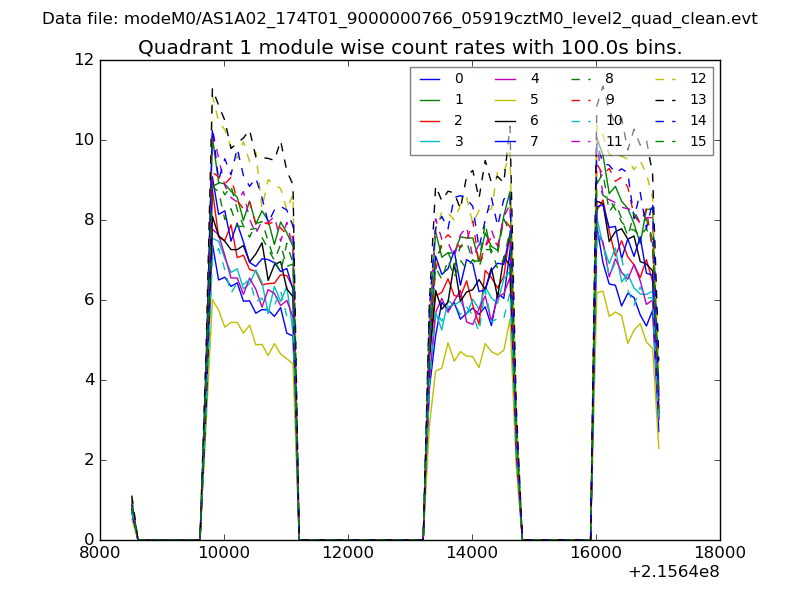
| Module-wise count rates for Quadrant A Data is divided into 100 sec bins |
 |
 |
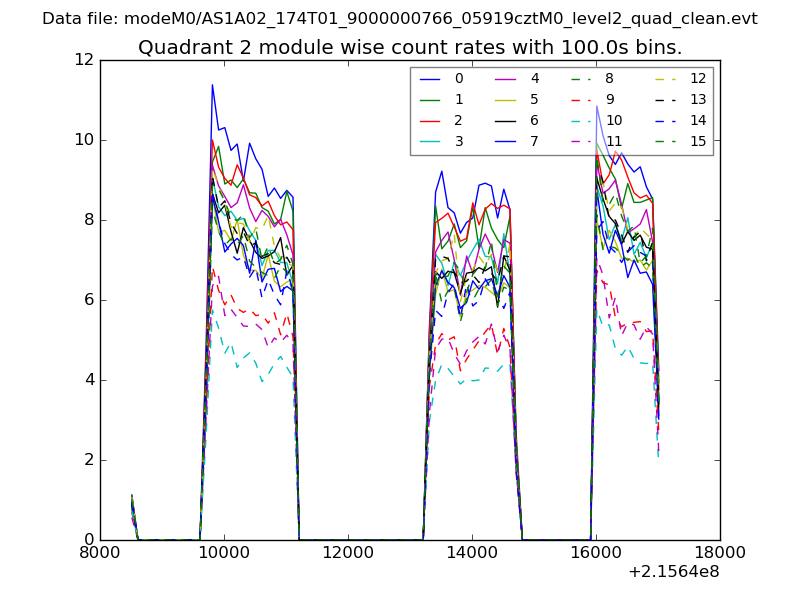
| Module-wise count rates for Quadrant B Data is divided into 100 sec bins |
 |
 |
| Module-wise count rates for Quadrant C Data is divided into 100 sec bins |
 |
 |
| Module-wise count rates for Quadrant D Data is divided into 100 sec bins |
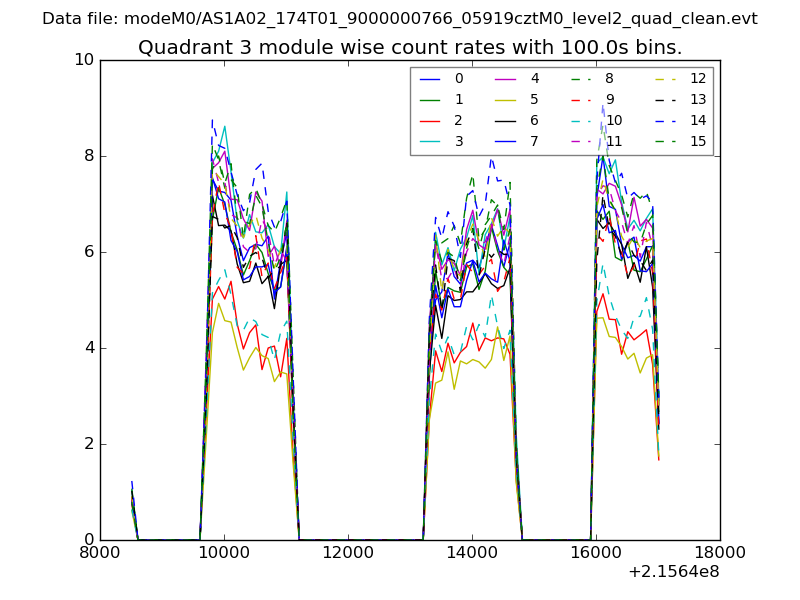 |
 |
| Parameter | Plot |
|---|---|
| CZT HV Monitor | 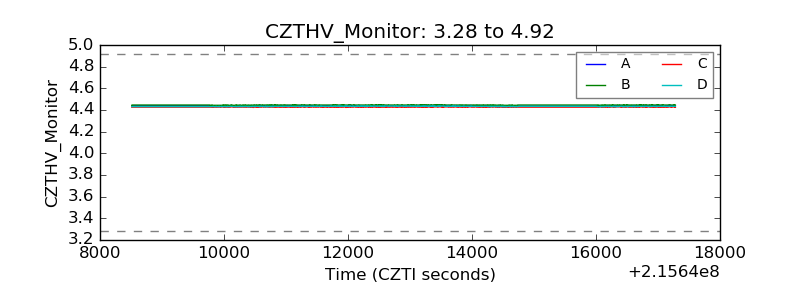 |
| D_VDD | 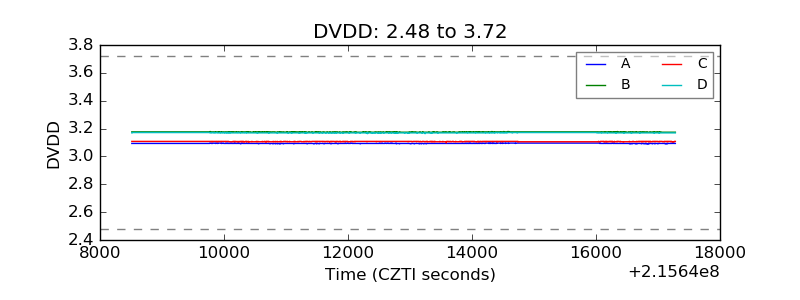 |
| Temperature 1 | 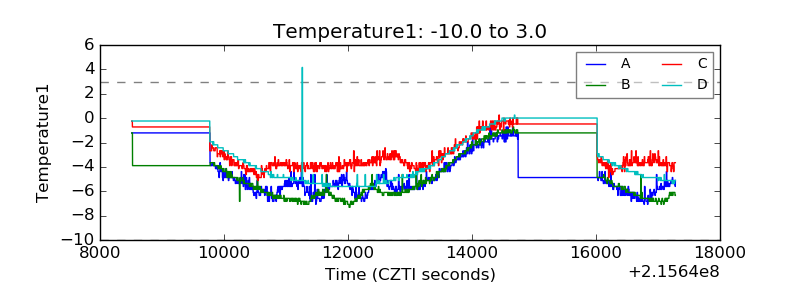 |
| Veto HV Monitor | 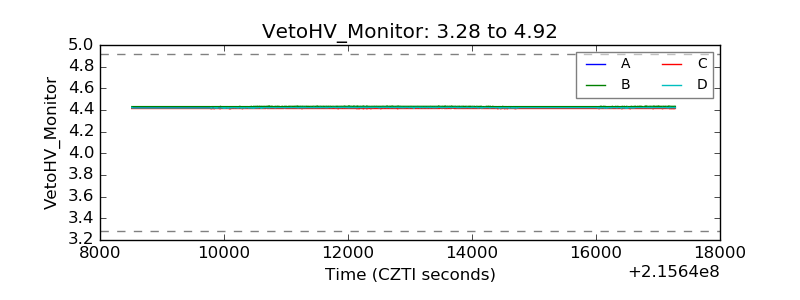 |
| Veto LLD | 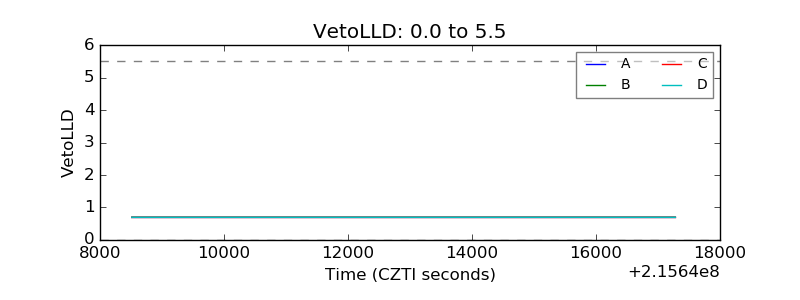 |
| Alpha Counter | 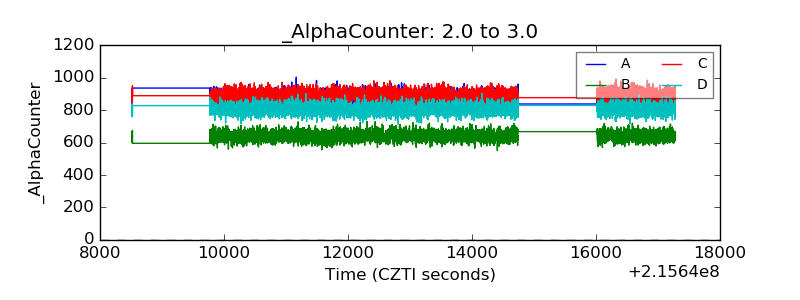 |
| _CPM_Rate | 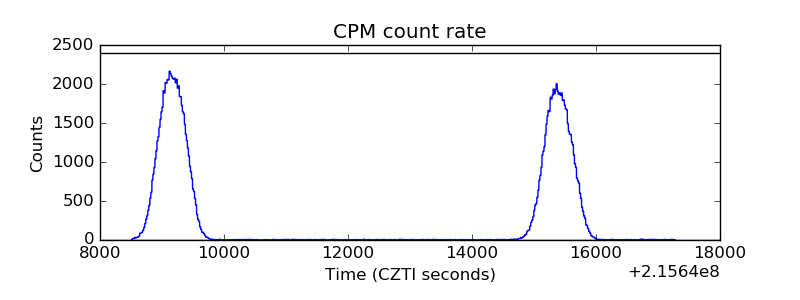 |
| CZT Counter | 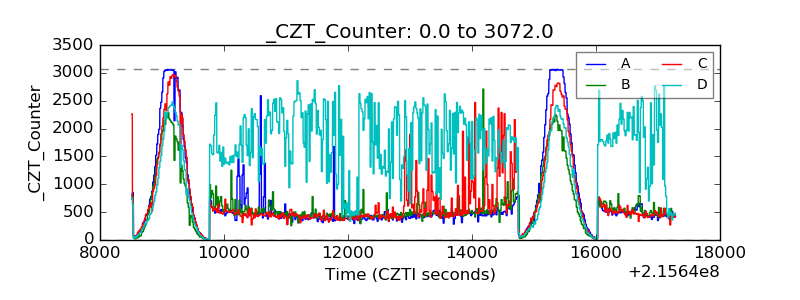 |
| +2.5 Volts monitor | 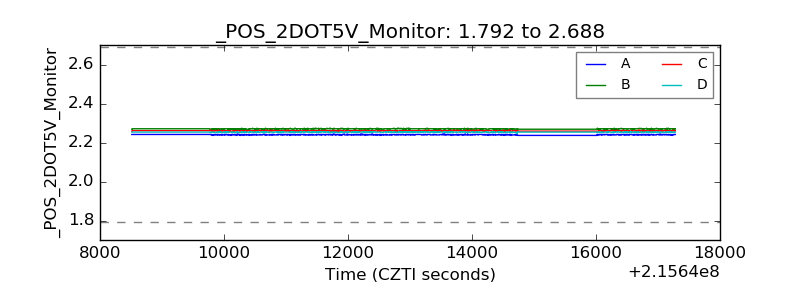 |
| +5 Volts monitor |  |
| _ROLL_ROT | 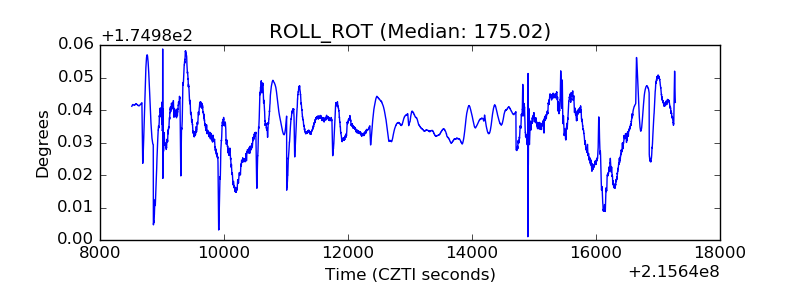 |
| _Roll_DEC | 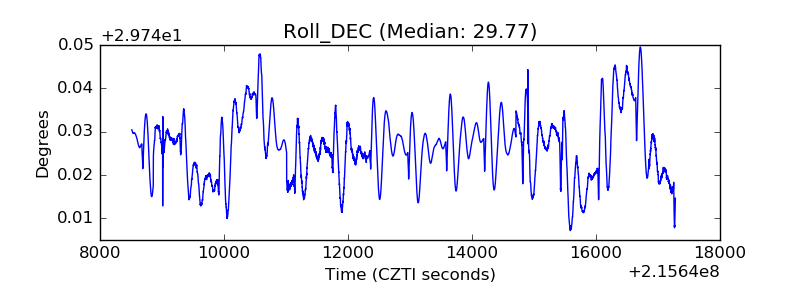 |
| _Roll_RA | 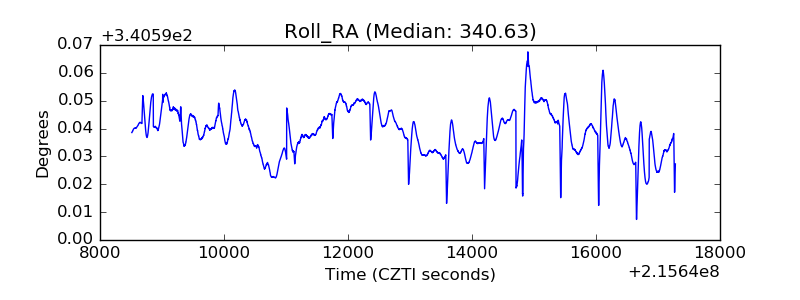 |
| Veto Counter | 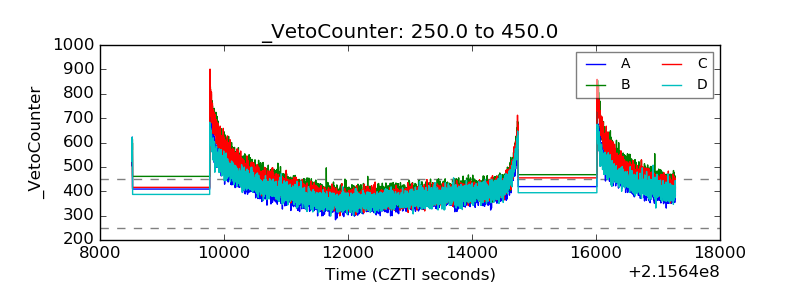 |