| Param | Original file | Final file |
|---|---|---|
| Filename | modeM0/AS1A02_174T01_9000000766_05920cztM0_level2.evt | modeM0/AS1A02_174T01_9000000766_05920cztM0_level2_quad_clean.evt |
| Size (bytes) | 585,112,320 | 64,920,960 |
| Size | 558.0 MB | 61.9 MB |
| Events in quadrant A | 2,908,955 | 398,361 |
| Events in quadrant B | 3,316,144 | 403,856 |
| Events in quadrant C | 2,860,913 | 396,469 |
| Events in quadrant D | 8,212,298 | 331,898 |
| Mode M9 | |||
|---|---|---|---|
| Quadrant | BADHDUFLAG | Total packets | Discarded packets |
| A | 0 | 17 | 0 |
| B | 0 | 17 | 0 |
| C | 0 | 17 | 0 |
| D | 0 | 18 | 0 |
| Mode M0 | |||
|---|---|---|---|
| Quadrant | BADHDUFLAG | Total packets | Discarded packets |
| A | 0 | 12890 | 3 |
| B | 0 | 13964 | 2 |
| C | 0 | 12792 | 2 |
| D | 0 | 28779 | 2 |
| Mode SS | |||
|---|---|---|---|
| Quadrant | BADHDUFLAG | Total packets | Discarded packets |
| A | 0 | 126 | 0 |
| B | 0 | 126 | 0 |
| C | 0 | 126 | 0 |
| D | 0 | 126 | 0 |
| Quadrant | Total seconds | Saturated seconds | Saturation percentage |
|---|---|---|---|
| A | 6227 | 27 | 0.433596% |
| B | 6227 | 100 | 1.605910% |
| C | 6227 | 13 | 0.208768% |
| D | 6227 | 1568 | 25.180665% |
Noise dominated data is calculated using 1-second bins in cleaned event files. If a bin has >2000 counts, and if more than 50% of those come from <1% of pixels, then it is considered to be noise-dominated and hence unusable.
| Quadrant | # 1 sec bins | Bins with >0 counts | Bins with >2000 counts | High rate bins dominated by noise | Noise dominated (total time) | Noise dominated (detector-on time) | Marked lightcurve |
|---|---|---|---|---|---|---|---|
| A | 7512 | 6228 | 1 | 1 | 0.01% | 0.02% | 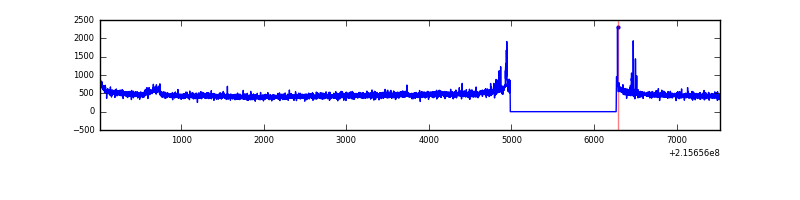 |
| B | 7512 | 6228 | 38 | 38 | 0.51% | 0.61% | 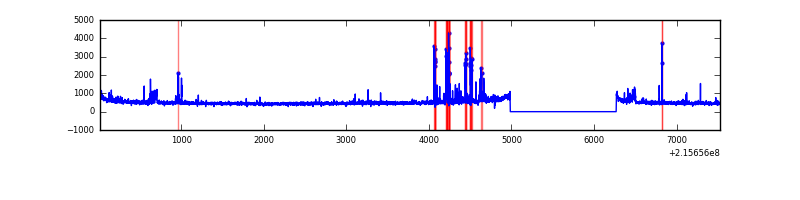 |
| C | 7512 | 6228 | 0 | 0 | 0.00% | 0.00% | 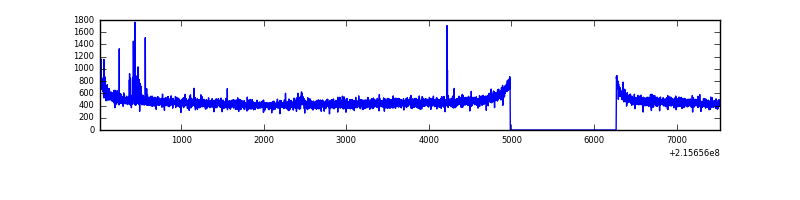 |
| D | 7512 | 6228 | 1459 | 1459 | 19.42% | 23.43% | 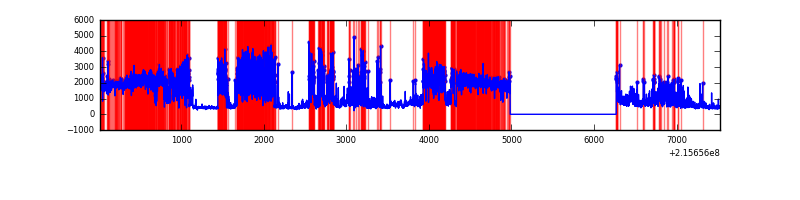 |
Top three noisy pixels from each quadrant. If the there are fewer than three noisy pixels in the level2.evt file, extra rows are filled as -1
| Pixel properties | Quadrant properties | ||||||
|---|---|---|---|---|---|---|---|
| Quadrant | DetID | PixID | Counts | Sigma | Mean | Median | Sigma |
| A | 0 | 47 | 25099 | 162.59 | 738 | 722 | 149.9 |
| A | 15 | 236 | 20880 | 134.45 | 738 | 722 | 149.9 |
| A | 0 | 50 | 18161 | 116.31 | 738 | 722 | 149.9 |
| B | 15 | 255 | 178283 | 1246.84 | 751 | 736 | 142.4 |
| B | 4 | 80 | 84806 | 590.39 | 751 | 736 | 142.4 |
| B | 15 | 204 | 43524 | 300.48 | 751 | 736 | 142.4 |
| C | 9 | 247 | 22164 | 128.24 | 723 | 730 | 167.1 |
| C | 13 | 61 | 5807 | 30.38 | 723 | 730 | 167.1 |
| C | 7 | 235 | 4250 | 21.06 | 723 | 730 | 167.1 |
| D | 1 | 20 | 4968606 | 30359.46 | 664 | 644 | 163.6 |
| D | 2 | 63 | 417254 | 2545.92 | 664 | 644 | 163.6 |
| D | 2 | 152 | 110235 | 669.72 | 664 | 644 | 163.6 |
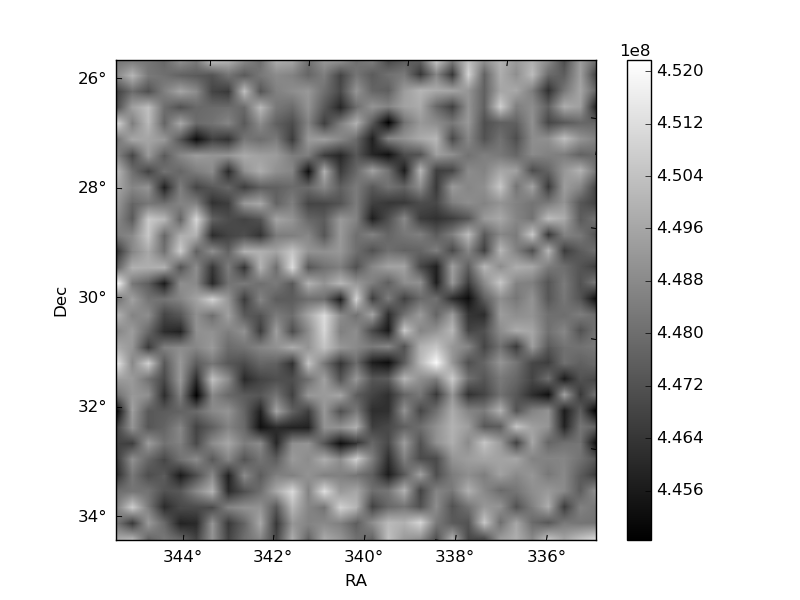
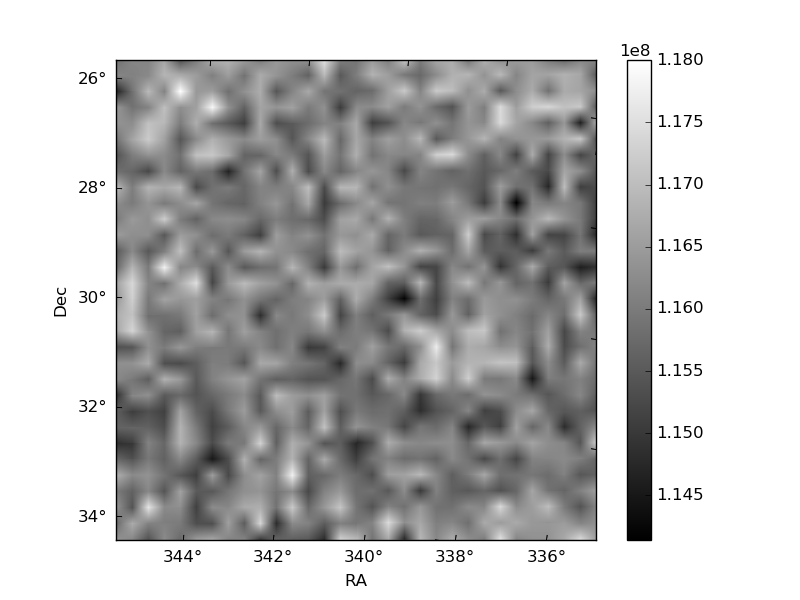
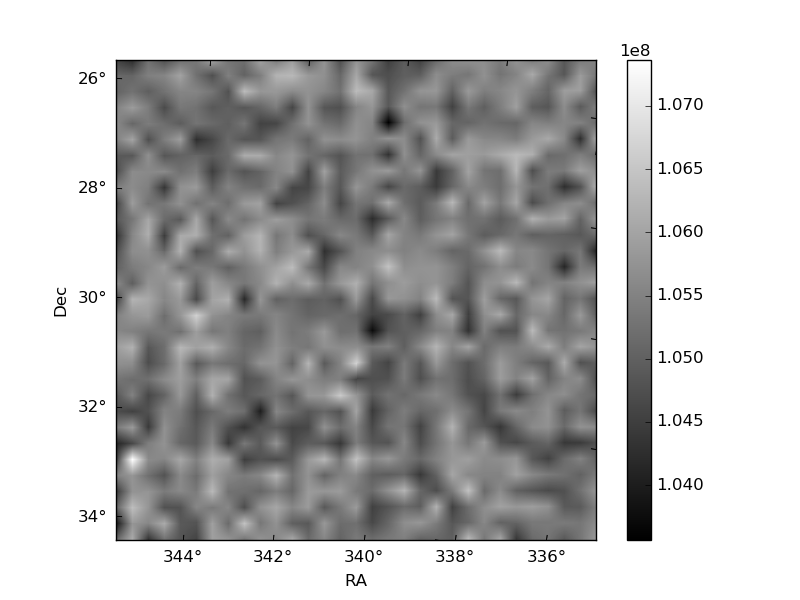
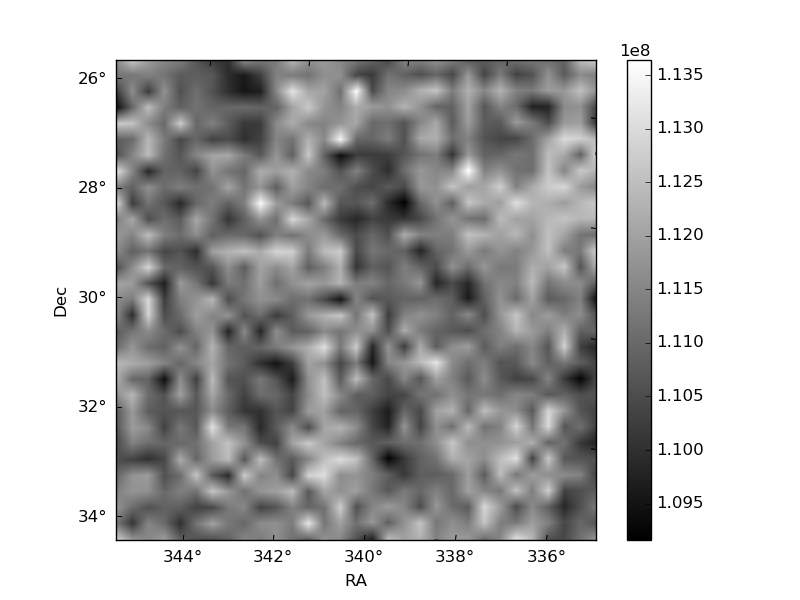
Histogram calculated using DETX and DETY for each event in the final _common_clean file
| Quadrant A | 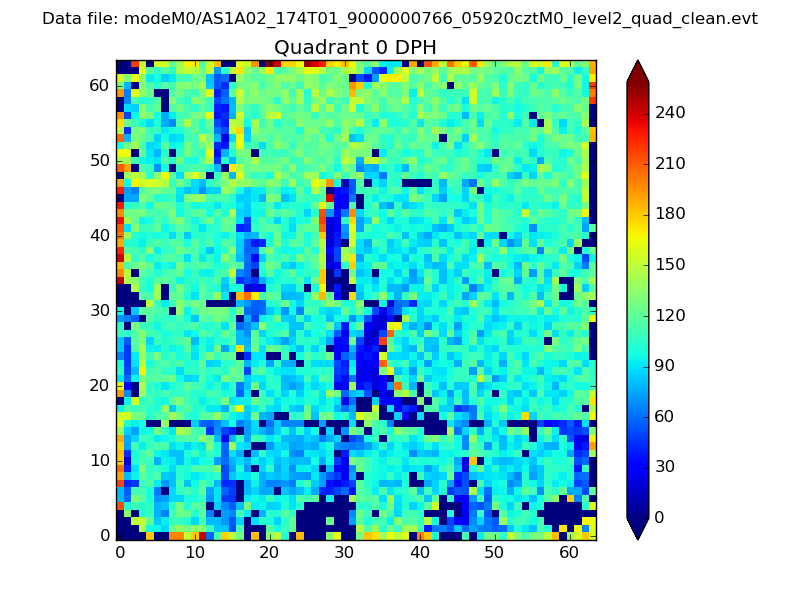 |
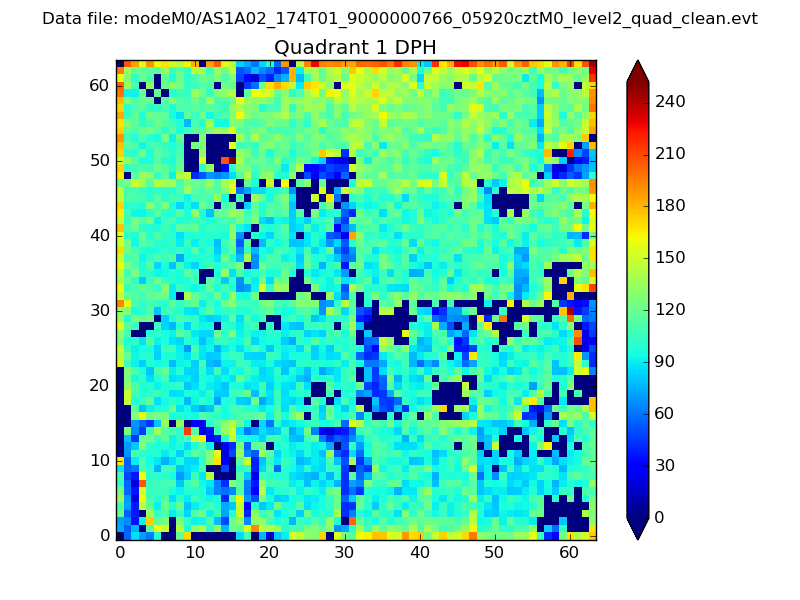 |
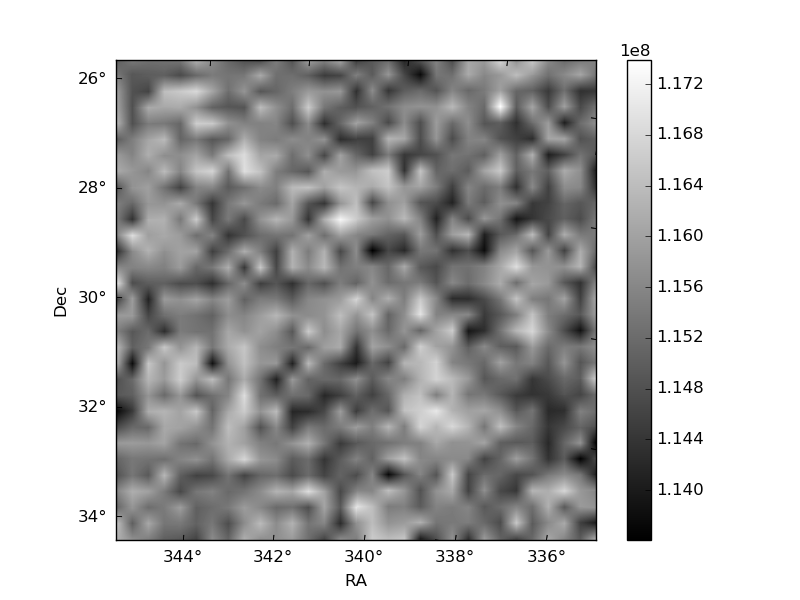
Quadrant B |
|---|---|---|---|
| Quadrant D | 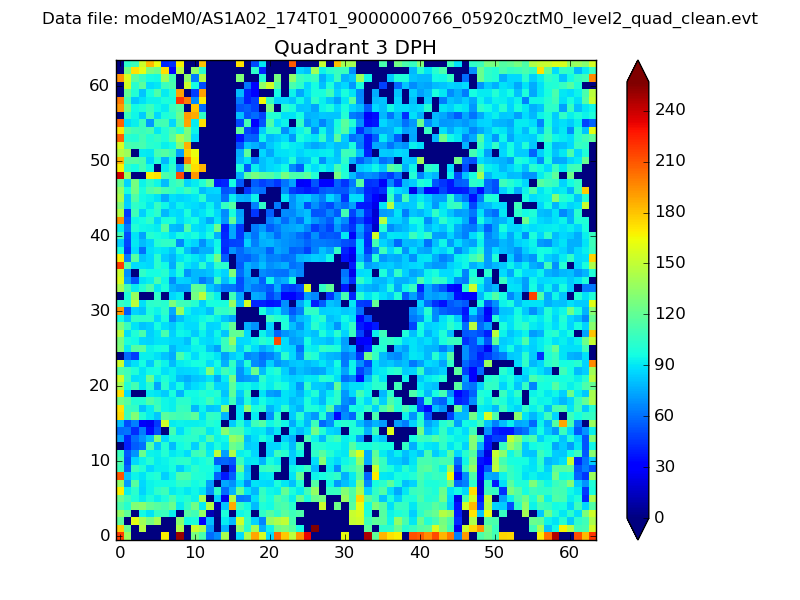 |
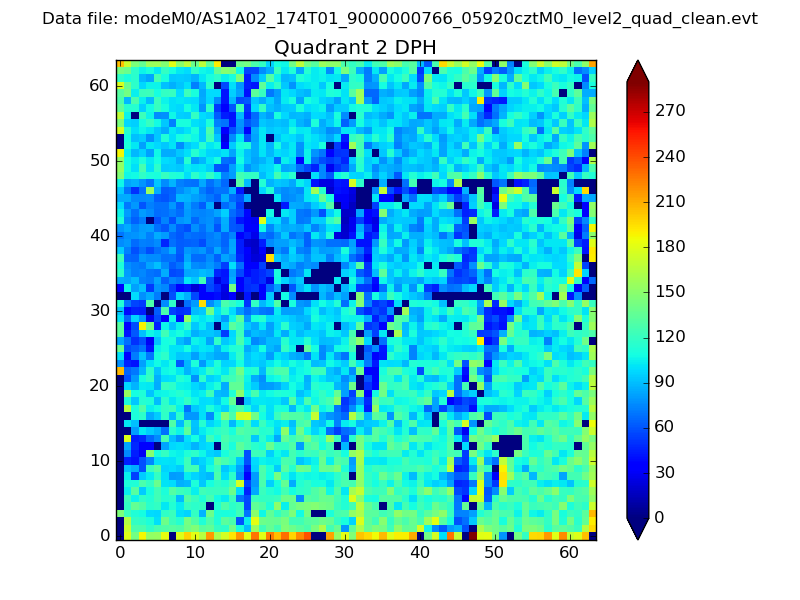 |
Quadrant C |
| Plot type | Count rate plots | Images |
|---|---|---|
| Comparison with Poisson distribution Blue bars denote a histogram of data divided into 1 sec bins. Red curve is a Poisson curve with rate = median count rate of data. |
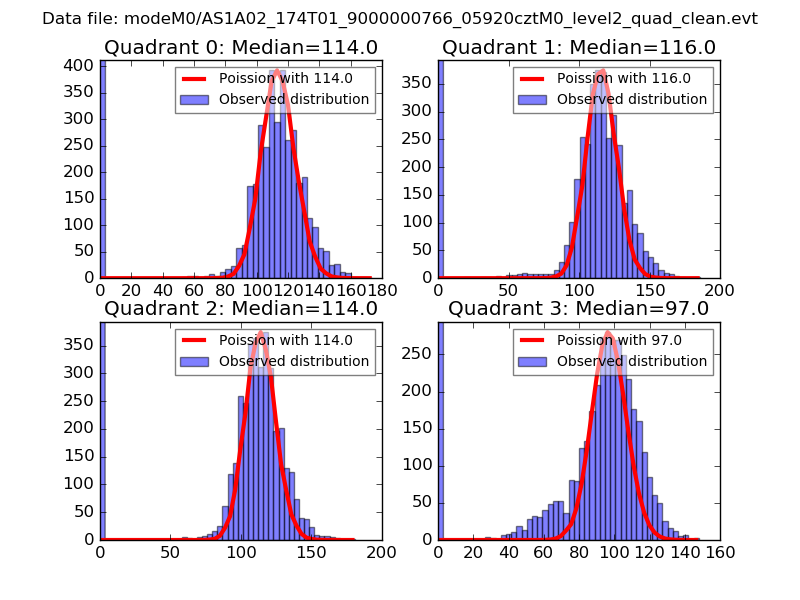 |
 |
| Quadrant-wise count rates Data is divided into 100 sec bins |
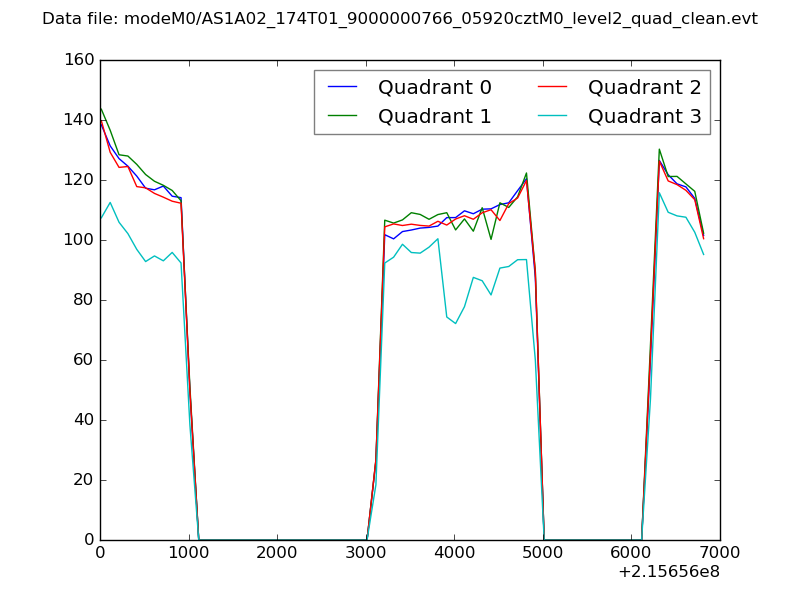 |
|
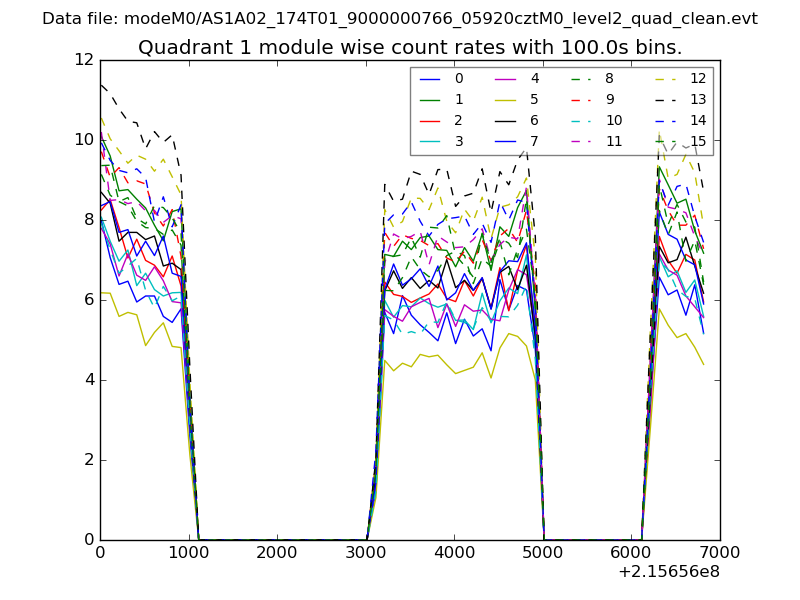
| Module-wise count rates for Quadrant A Data is divided into 100 sec bins |
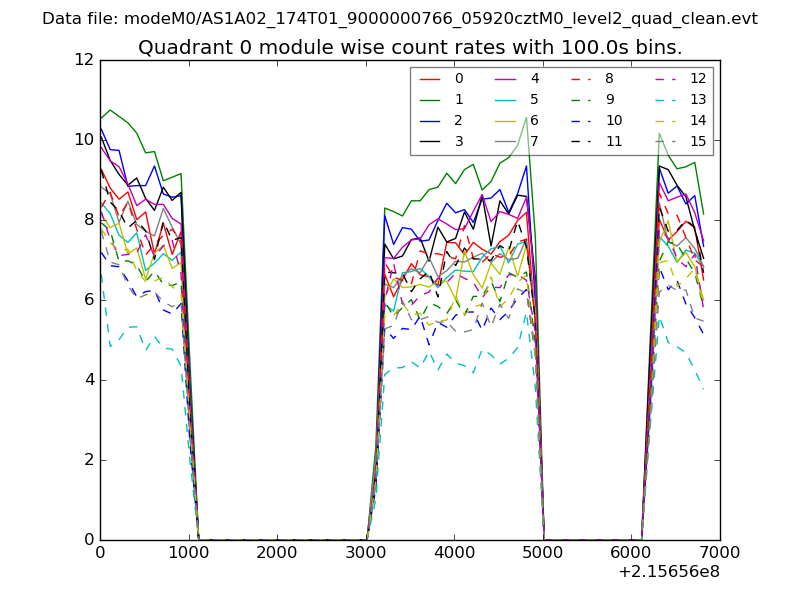 |
 |
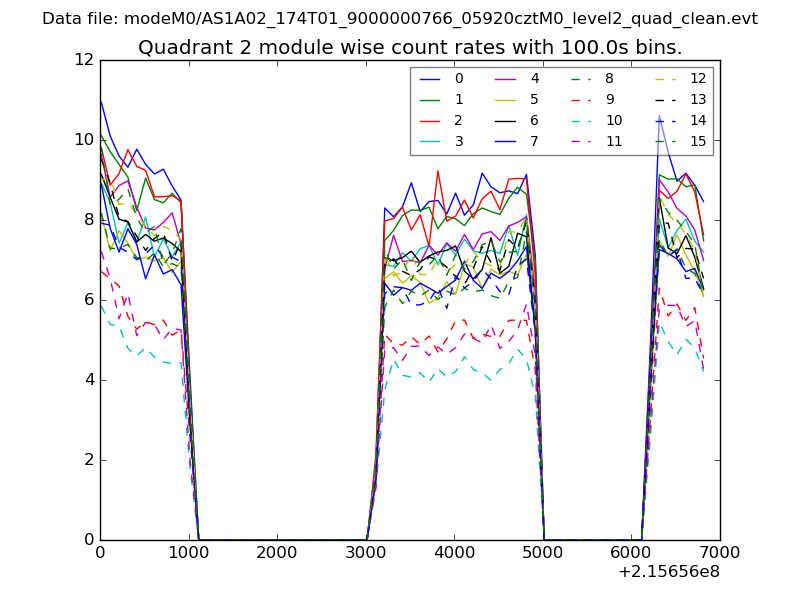
| Module-wise count rates for Quadrant B Data is divided into 100 sec bins |
 |
 |
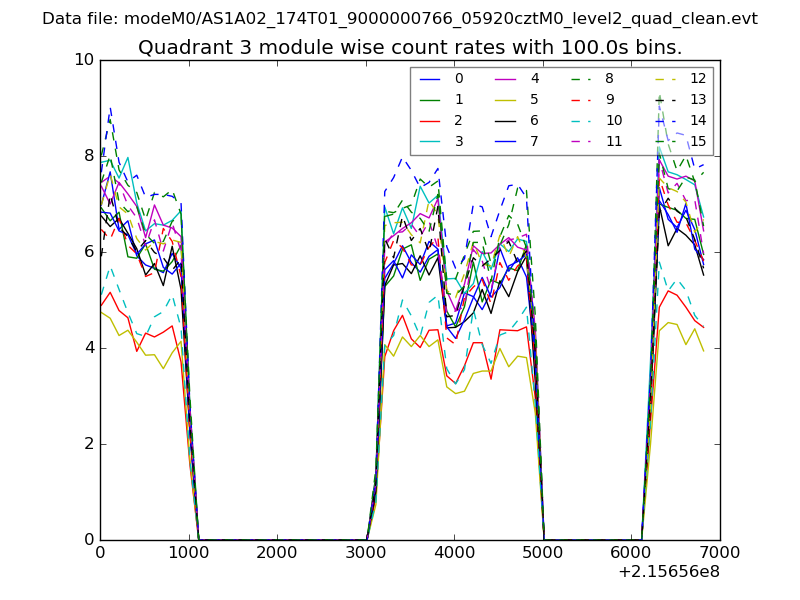
| Module-wise count rates for Quadrant C Data is divided into 100 sec bins |
 |
 |
| Module-wise count rates for Quadrant D Data is divided into 100 sec bins |
 |
 |
| Parameter | Plot |
|---|---|
| CZT HV Monitor | 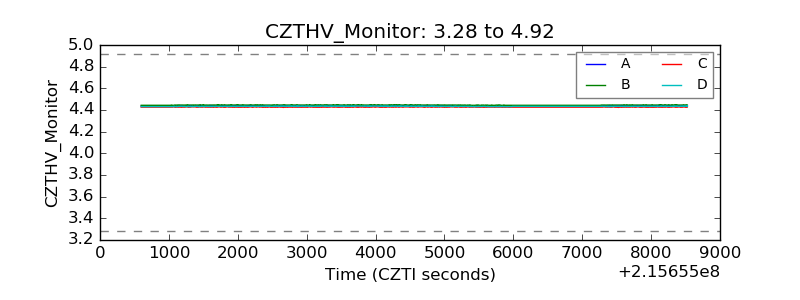 |
| D_VDD | 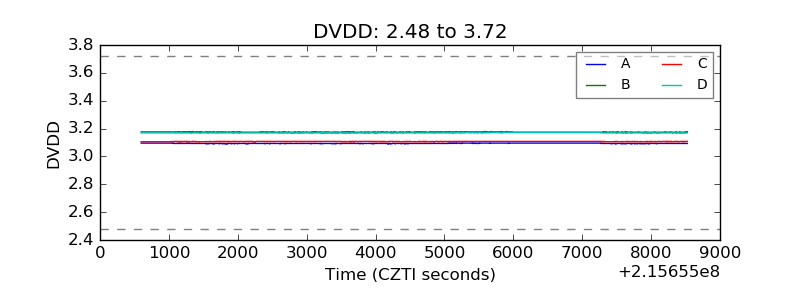 |
| Temperature 1 | 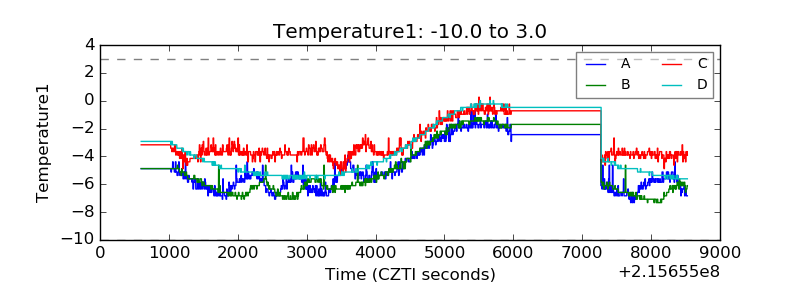 |
| Veto HV Monitor | 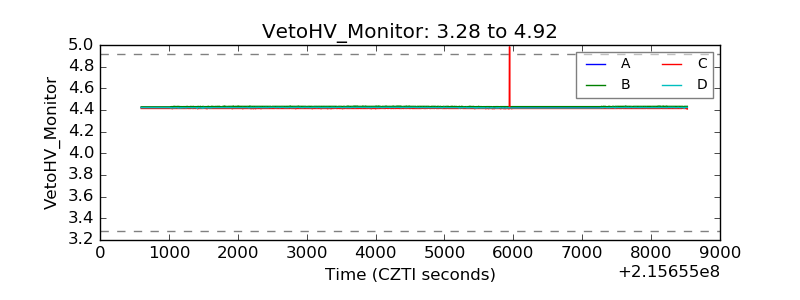 |
| Veto LLD | 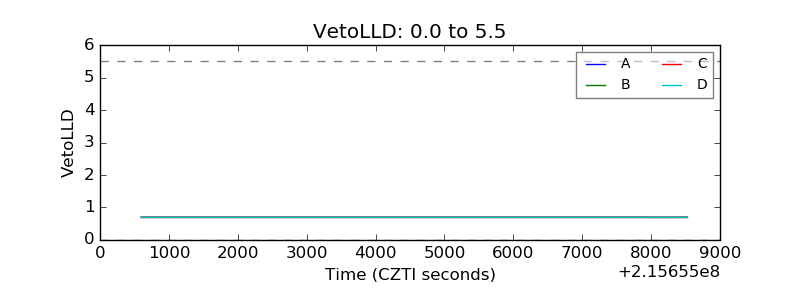 |
| Alpha Counter | 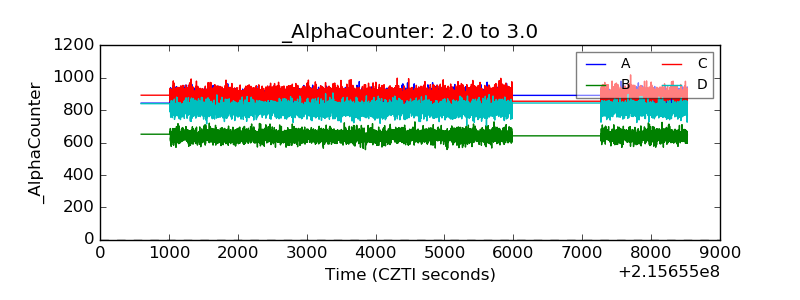 |
| _CPM_Rate | 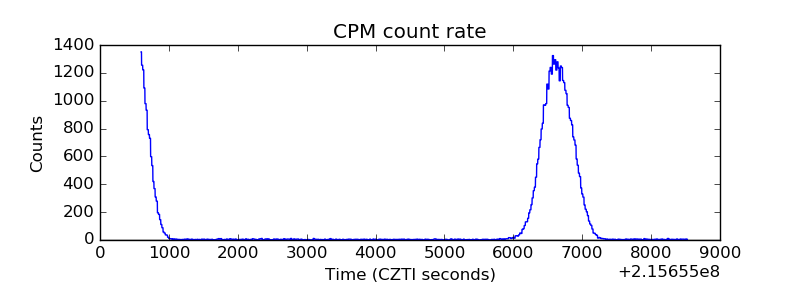 |
| CZT Counter | 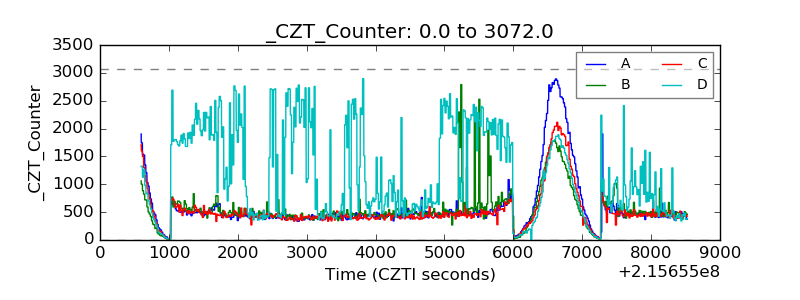 |
| +2.5 Volts monitor | 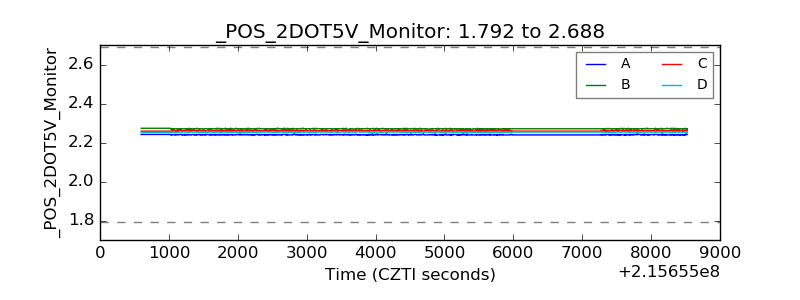 |
| +5 Volts monitor | 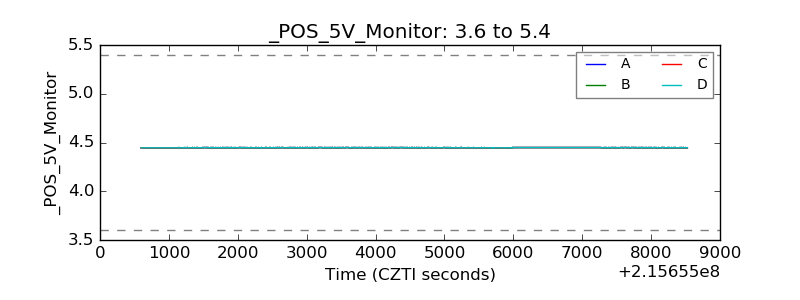 |
| _ROLL_ROT | 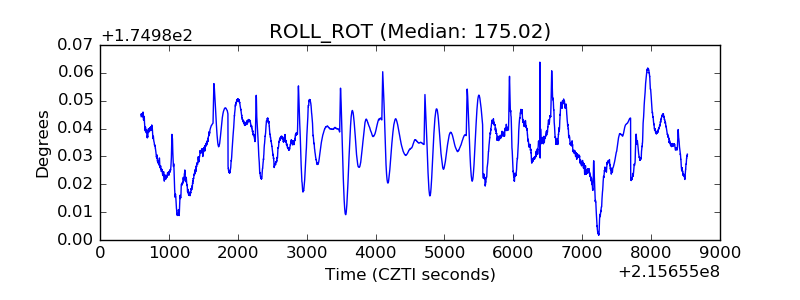 |
| _Roll_DEC | 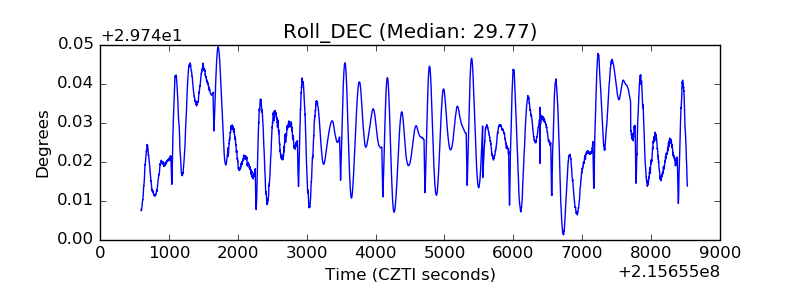 |
| _Roll_RA | 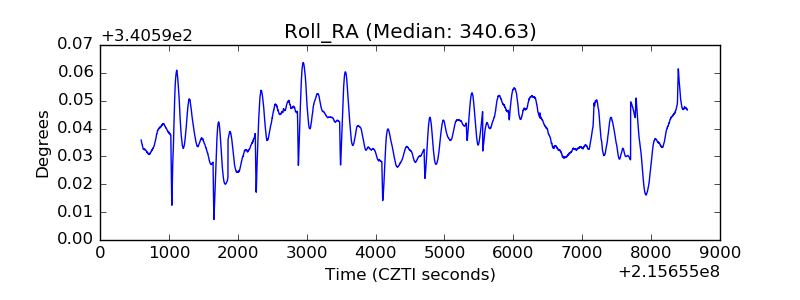 |
| Veto Counter | 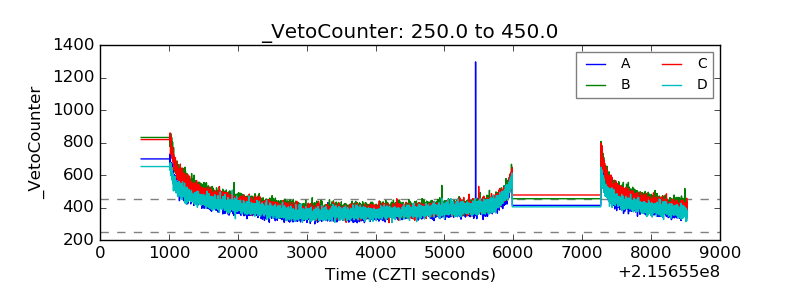 |