| Param | Original file | Final file |
|---|---|---|
| Filename | modeM0/AS1A02_174T01_9000000766_05922cztM0_level2.evt | modeM0/AS1A02_174T01_9000000766_05922cztM0_level2_quad_clean.evt |
| Size (bytes) | 555,716,160 | 69,482,880 |
| Size | 530.0 MB | 66.3 MB |
| Events in quadrant A | 3,595,036 | 405,694 |
| Events in quadrant B | 4,089,564 | 400,198 |
| Events in quadrant C | 3,384,831 | 405,173 |
| Events in quadrant D | 5,257,544 | 376,636 |
| Mode M9 | |||
|---|---|---|---|
| Quadrant | BADHDUFLAG | Total packets | Discarded packets |
| A | 0 | 20 | 0 |
| B | 0 | 20 | 0 |
| C | 0 | 20 | 0 |
| D | 0 | 20 | 0 |
| Mode M0 | |||
|---|---|---|---|
| Quadrant | BADHDUFLAG | Total packets | Discarded packets |
| A | 0 | 15828 | 3 |
| B | 0 | 17042 | 2 |
| C | 0 | 15357 | 2 |
| D | 0 | 20903 | 2 |
| Mode SS | |||
|---|---|---|---|
| Quadrant | BADHDUFLAG | Total packets | Discarded packets |
| A | 0 | 154 | 0 |
| B | 0 | 154 | 0 |
| C | 0 | 154 | 0 |
| D | 0 | 154 | 0 |
| Quadrant | Total seconds | Saturated seconds | Saturation percentage |
|---|---|---|---|
| A | 7405 | 196 | 2.646860% |
| B | 7405 | 316 | 4.267387% |
| C | 7405 | 79 | 1.066847% |
| D | 7405 | 331 | 4.469953% |
Noise dominated data is calculated using 1-second bins in cleaned event files. If a bin has >2000 counts, and if more than 50% of those come from <1% of pixels, then it is considered to be noise-dominated and hence unusable.
| Quadrant | # 1 sec bins | Bins with >0 counts | Bins with >2000 counts | High rate bins dominated by noise | Noise dominated (total time) | Noise dominated (detector-on time) | Marked lightcurve |
|---|---|---|---|---|---|---|---|
| A | 9435 | 7407 | 48 | 48 | 0.51% | 0.65% |  |
| B | 9435 | 7407 | 106 | 106 | 1.12% | 1.43% | 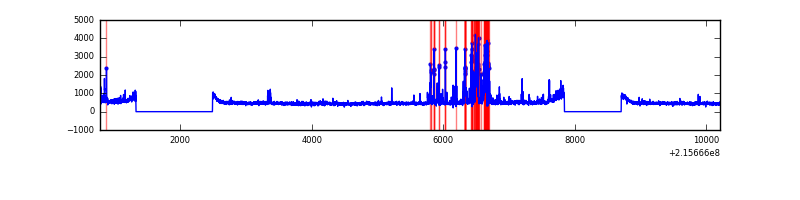 |
| C | 9435 | 7407 | 0 | 0 | 0.00% | 0.00% | 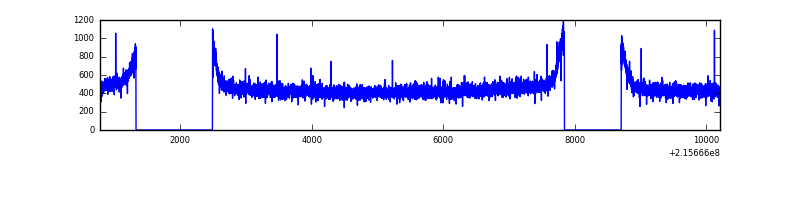 |
| D | 9435 | 7407 | 156 | 156 | 1.65% | 2.11% | 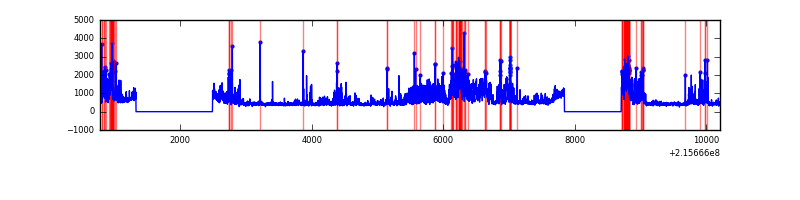 |
Top three noisy pixels from each quadrant. If the there are fewer than three noisy pixels in the level2.evt file, extra rows are filled as -1
| Pixel properties | Quadrant properties | ||||||
|---|---|---|---|---|---|---|---|
| Quadrant | DetID | PixID | Counts | Sigma | Mean | Median | Sigma |
| A | 15 | 236 | 155659 | 849.94 | 883 | 860 | 182.1 |
| A | 15 | 234 | 26926 | 143.12 | 883 | 860 | 182.1 |
| A | 13 | 251 | 11005 | 55.7 | 883 | 860 | 182.1 |
| B | 15 | 255 | 458207 | 2653.99 | 888 | 865 | 172.3 |
| B | 0 | 214 | 64657 | 370.19 | 888 | 865 | 172.3 |
| B | 0 | 219 | 31263 | 176.4 | 888 | 865 | 172.3 |
| C | 13 | 61 | 6995 | 30.24 | 865 | 870 | 202.5 |
| C | 9 | 68 | 4674 | 18.78 | 865 | 870 | 202.5 |
| C | 8 | 79 | 2375 | 7.43 | 865 | 870 | 202.5 |
| D | 1 | 20 | 665108 | 3176.12 | 845 | 819 | 209.2 |
| D | 2 | 152 | 471107 | 2248.55 | 845 | 819 | 209.2 |
| D | 2 | 63 | 464918 | 2218.96 | 845 | 819 | 209.2 |
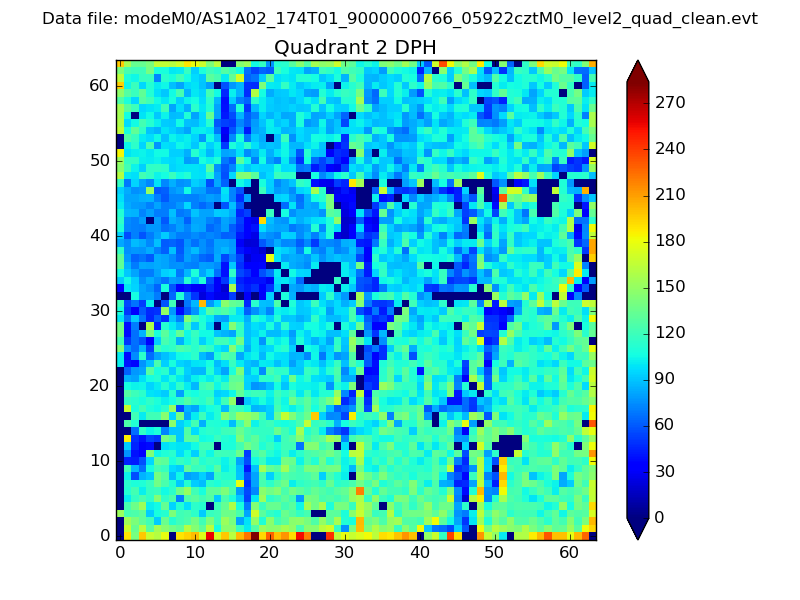
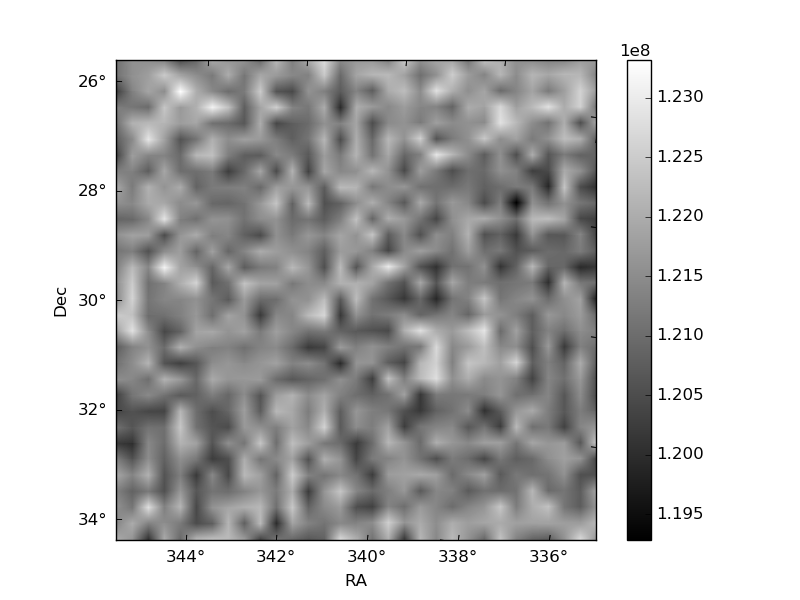
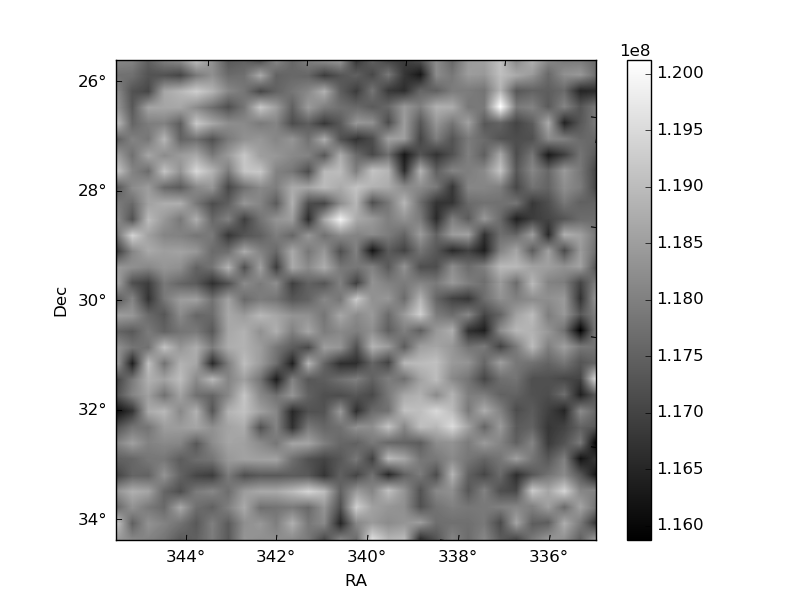
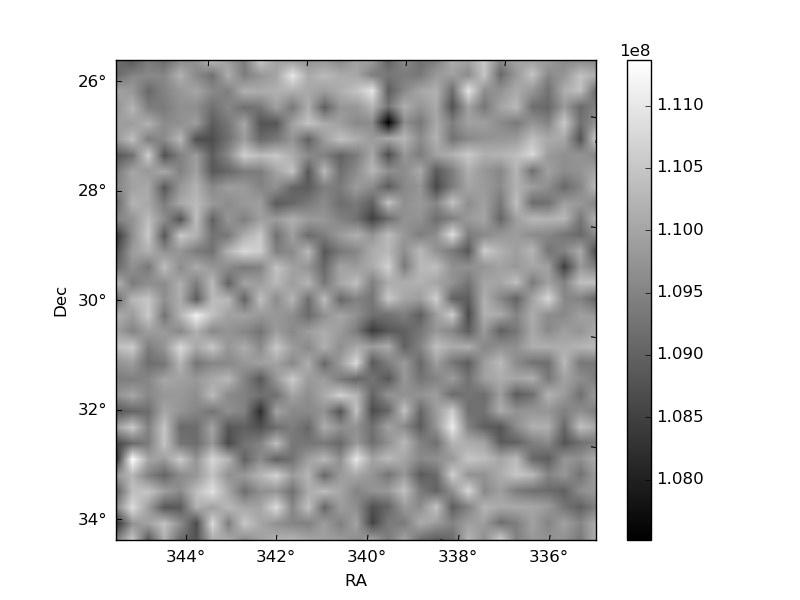
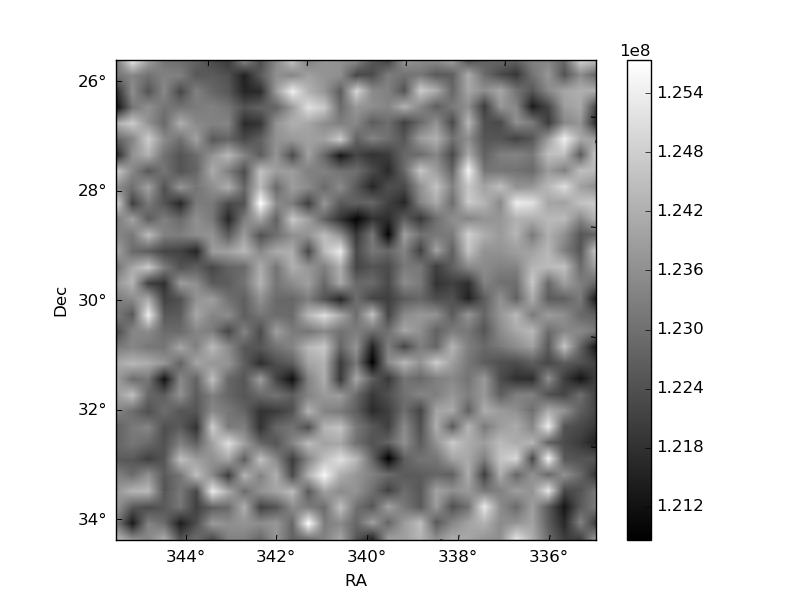
Histogram calculated using DETX and DETY for each event in the final _common_clean file
| Quadrant A | 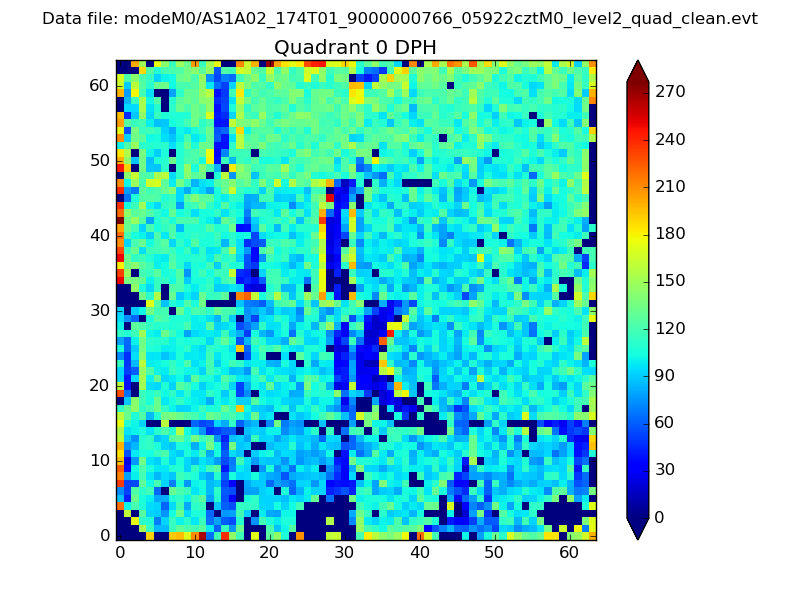 |
 |
Quadrant B |
|---|---|---|---|
| Quadrant D | 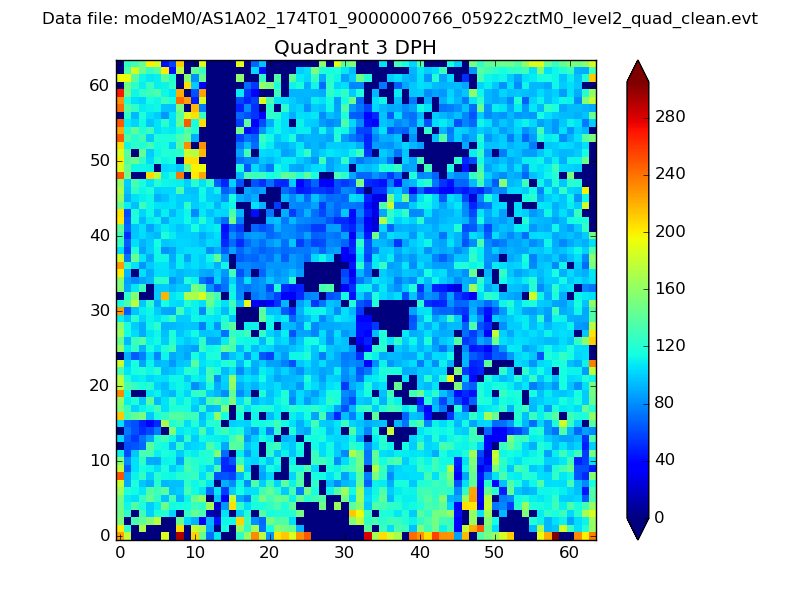 |
 |
Quadrant C |
| Plot type | Count rate plots | Images |
|---|---|---|
| Comparison with Poisson distribution Blue bars denote a histogram of data divided into 1 sec bins. Red curve is a Poisson curve with rate = median count rate of data. |
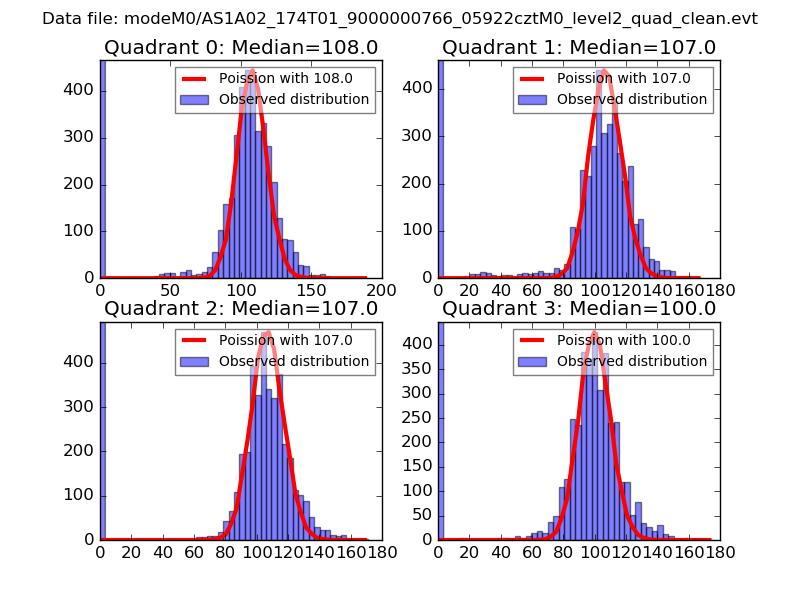 |
 |
| Quadrant-wise count rates Data is divided into 100 sec bins |
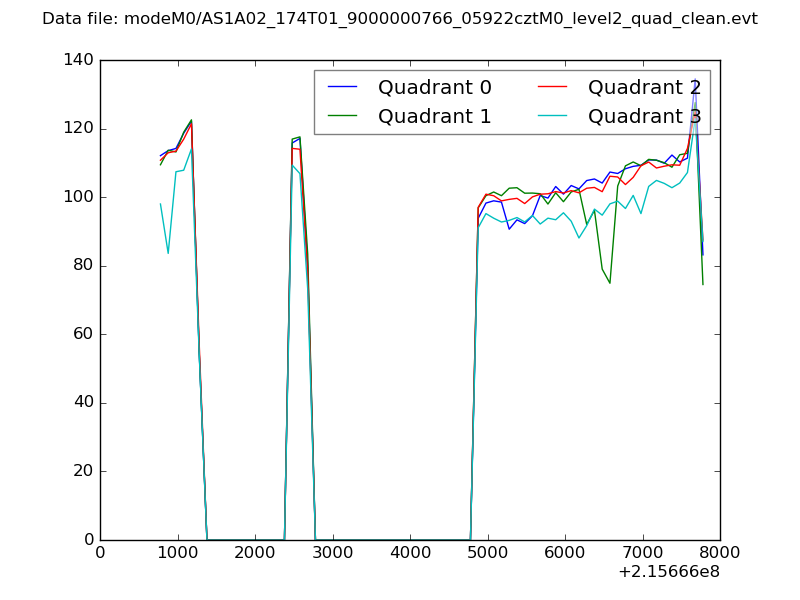 |
|
| Module-wise count rates for Quadrant A Data is divided into 100 sec bins |
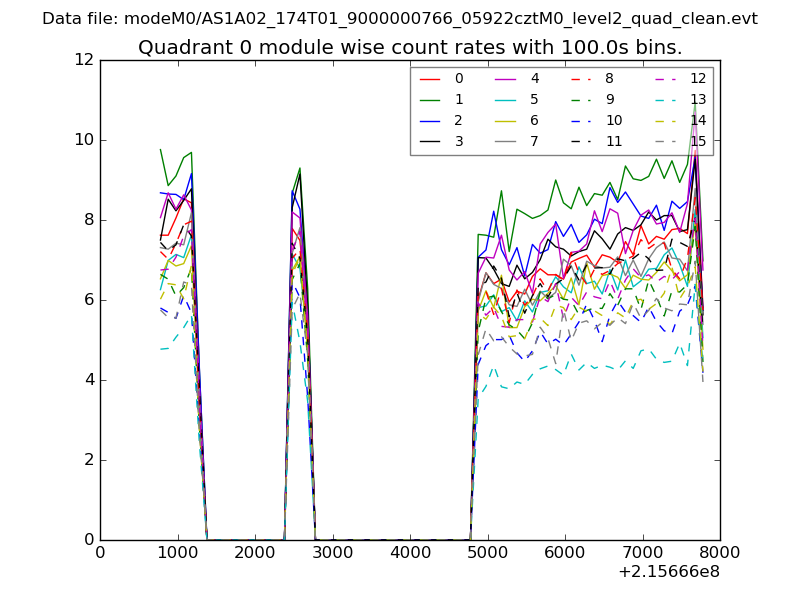 |
 |
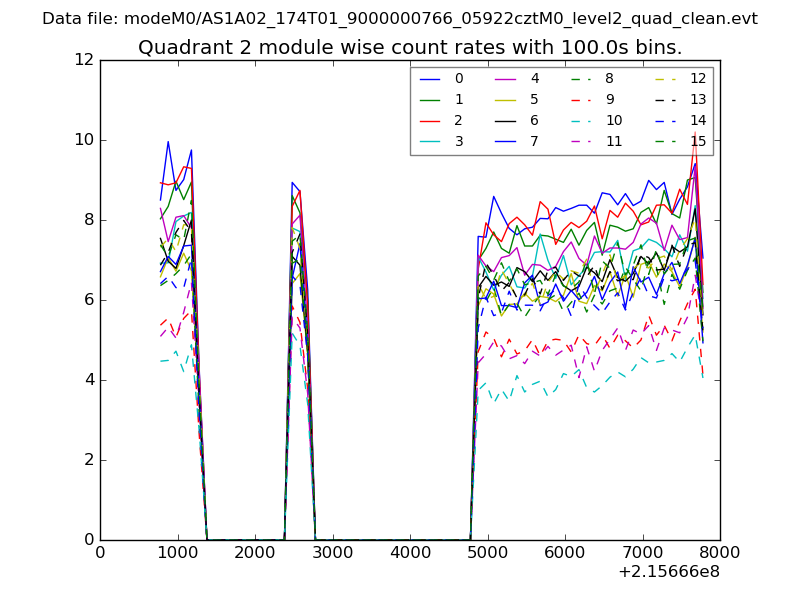
| Module-wise count rates for Quadrant B Data is divided into 100 sec bins |
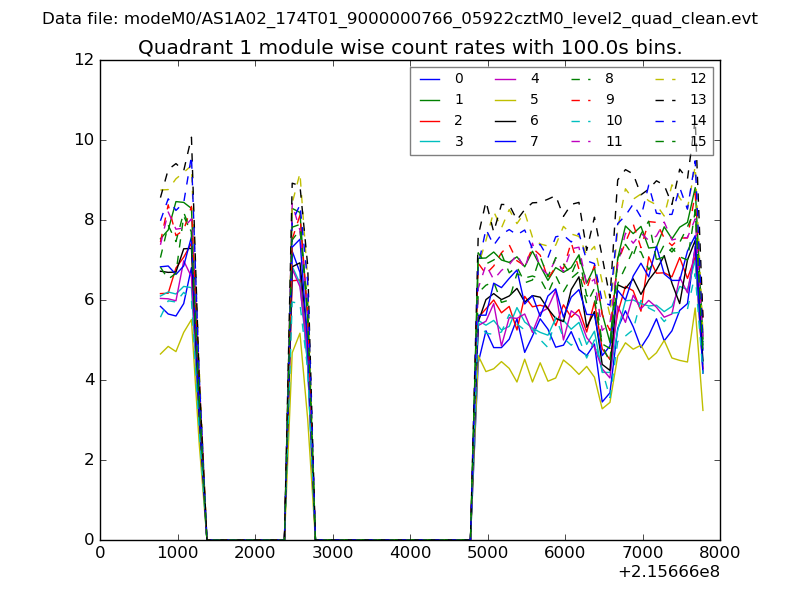 |
 |
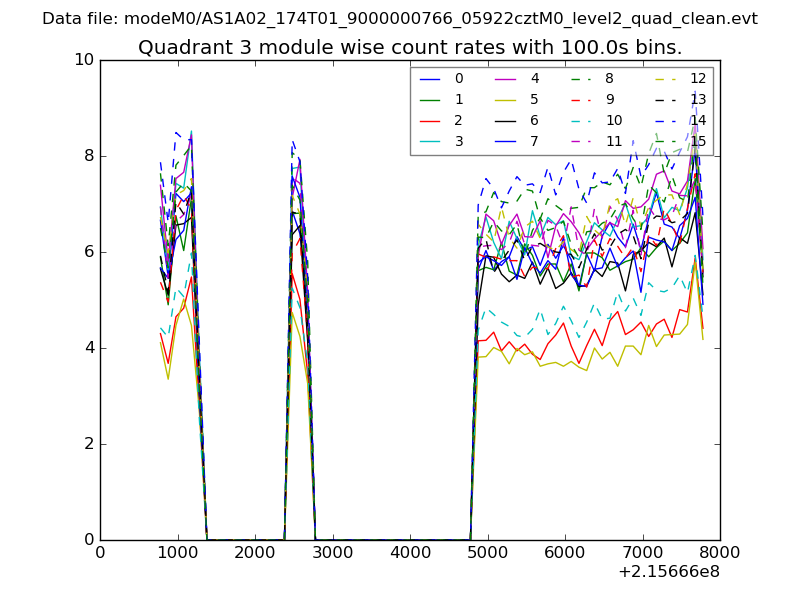
| Module-wise count rates for Quadrant C Data is divided into 100 sec bins |
 |
 |
| Module-wise count rates for Quadrant D Data is divided into 100 sec bins |
 |
 |
| Parameter | Plot |
|---|---|
| CZT HV Monitor | 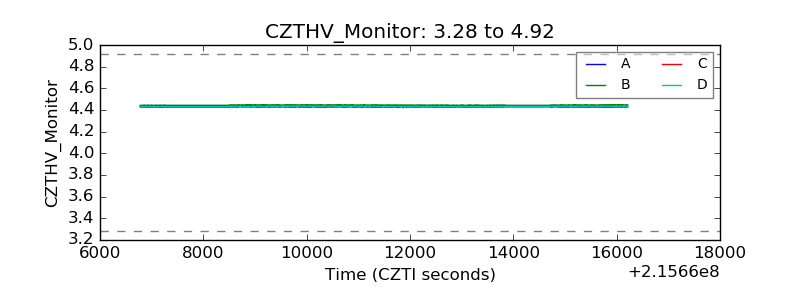 |
| D_VDD | 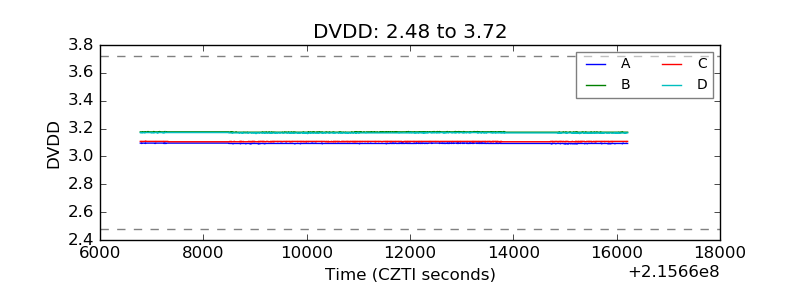 |
| Temperature 1 | 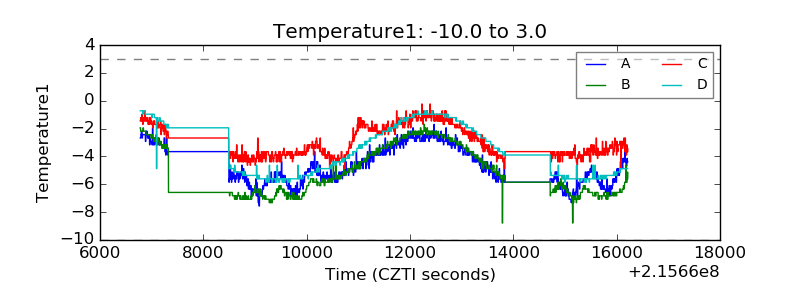 |
| Veto HV Monitor | 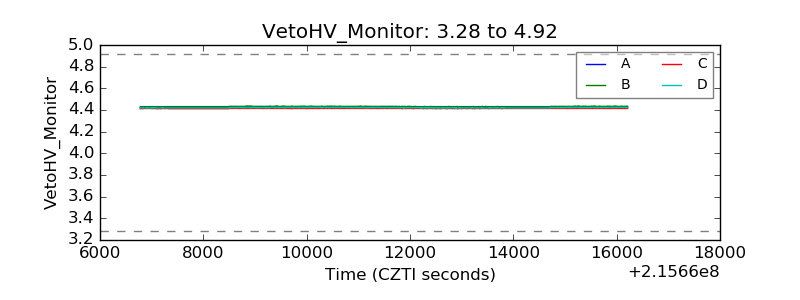 |
| Veto LLD | 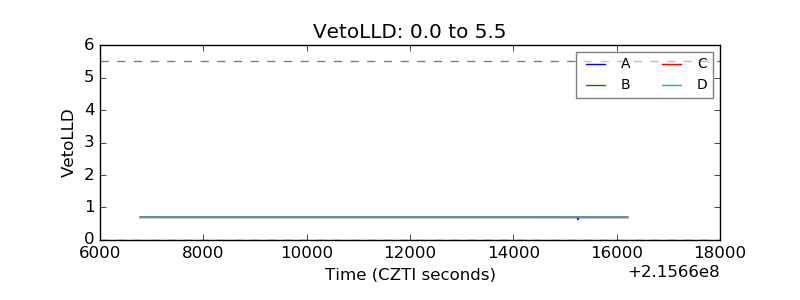 |
| Alpha Counter | 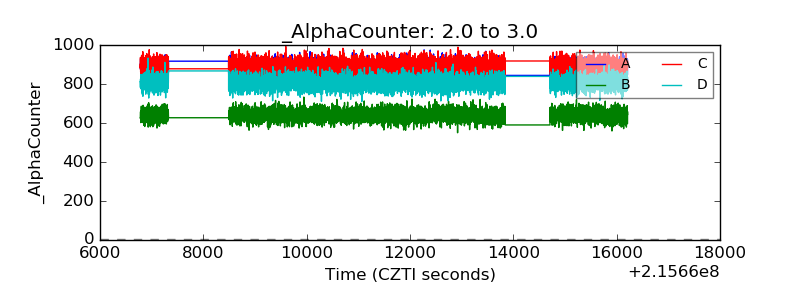 |
| _CPM_Rate | 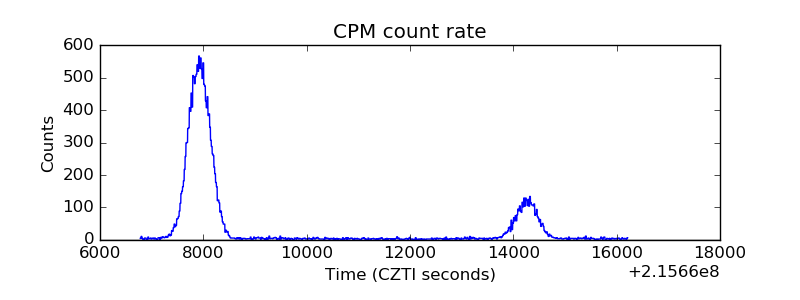 |
| CZT Counter | 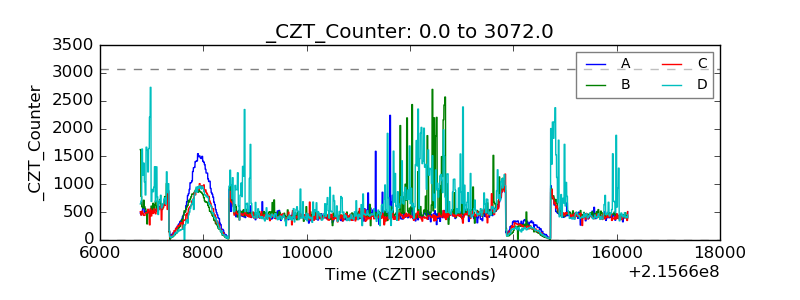 |
| +2.5 Volts monitor |  |
| +5 Volts monitor | 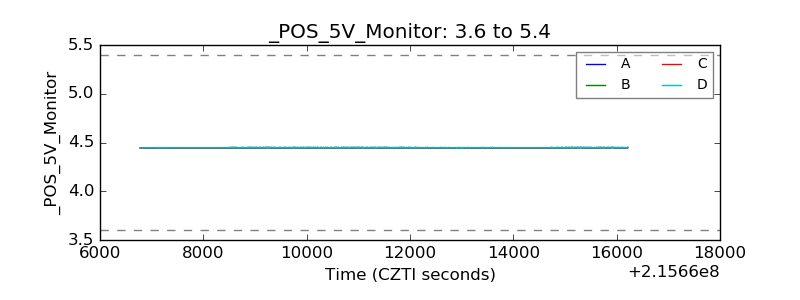 |
| _ROLL_ROT | 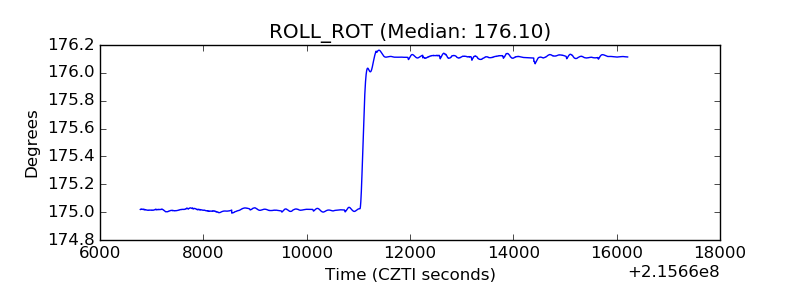 |
| _Roll_DEC | 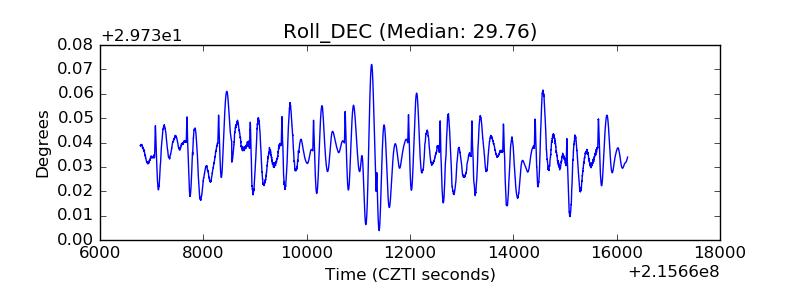 |
| _Roll_RA | 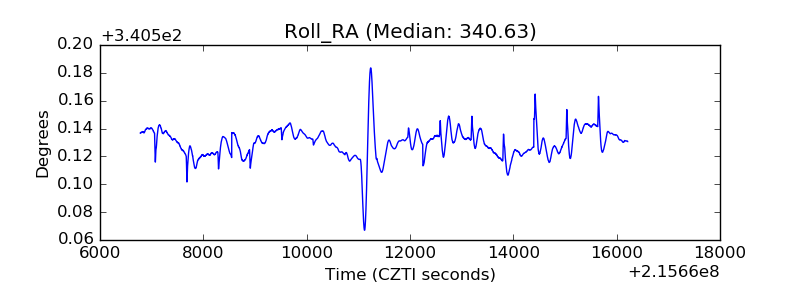 |
| Veto Counter | 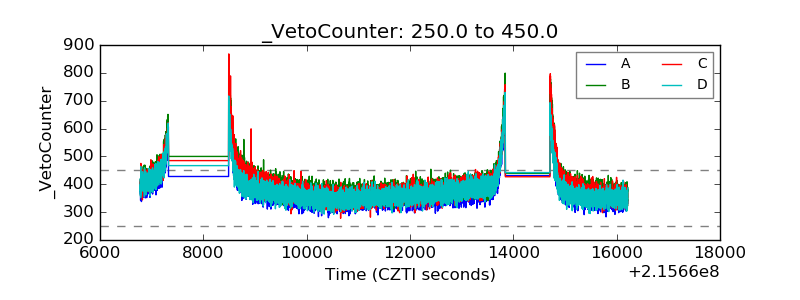 |