| Param | Original file | Final file |
|---|---|---|
| Filename | modeM0/AS1A02_174T01_9000000766_05924cztM0_level2.evt | modeM0/AS1A02_174T01_9000000766_05924cztM0_level2_quad_clean.evt |
| Size (bytes) | 615,804,480 | 70,453,440 |
| Size | 587.3 MB | 67.2 MB |
| Events in quadrant A | 3,557,680 | 405,602 |
| Events in quadrant B | 4,090,202 | 402,642 |
| Events in quadrant C | 3,511,237 | 407,048 |
| Events in quadrant D | 6,961,669 | 375,340 |
| Mode M9 | |||
|---|---|---|---|
| Quadrant | BADHDUFLAG | Total packets | Discarded packets |
| A | 0 | 3 | 0 |
| B | 0 | 3 | 0 |
| C | 0 | 3 | 1 |
| D | 0 | 4 | 0 |
| Mode M0 | |||
|---|---|---|---|
| Quadrant | BADHDUFLAG | Total packets | Discarded packets |
| A | 0 | 16336 | 98 |
| B | 0 | 17486 | 131 |
| C | 0 | 16260 | 124 |
| D | 0 | 26329 | 295 |
| Mode SS | |||
|---|---|---|---|
| Quadrant | BADHDUFLAG | Total packets | Discarded packets |
| A | 0 | 158 | 0 |
| B | 0 | 158 | 0 |
| C | 0 | 158 | 0 |
| D | 0 | 158 | 2 |
| Quadrant | Total seconds | Saturated seconds | Saturation percentage |
|---|---|---|---|
| A | 7809 | 270 | 3.457549% |
| B | 7801 | 385 | 4.935265% |
| C | 7798 | 156 | 2.000513% |
| D | 7776 | 582 | 7.484568% |
Noise dominated data is calculated using 1-second bins in cleaned event files. If a bin has >2000 counts, and if more than 50% of those come from <1% of pixels, then it is considered to be noise-dominated and hence unusable.
| Quadrant | # 1 sec bins | Bins with >0 counts | Bins with >2000 counts | High rate bins dominated by noise | Noise dominated (total time) | Noise dominated (detector-on time) | Marked lightcurve |
|---|---|---|---|---|---|---|---|
| A | 7892 | 7852 | 0 | 0 | 0.00% | 0.00% | 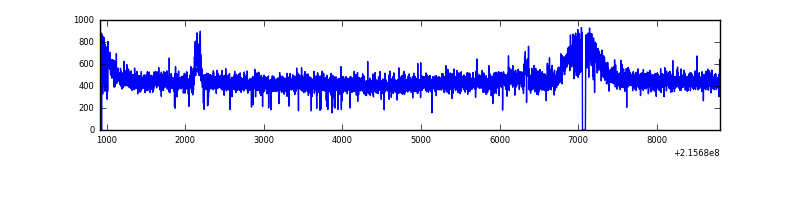 |
| B | 7892 | 7853 | 66 | 66 | 0.84% | 0.84% | 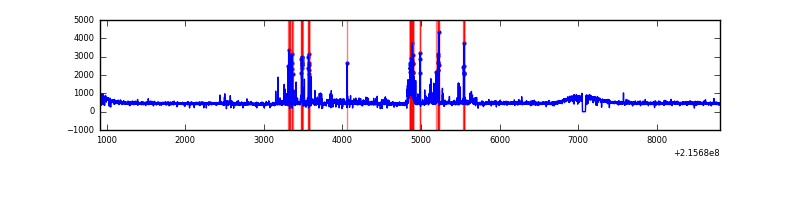 |
| C | 7892 | 7853 | 0 | 0 | 0.00% | 0.00% | 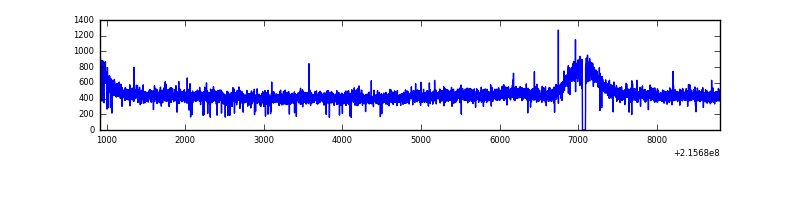 |
| D | 7892 | 7849 | 342 | 342 | 4.33% | 4.36% | 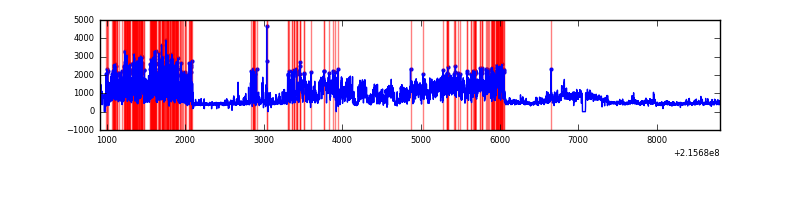 |
Top three noisy pixels from each quadrant. If the there are fewer than three noisy pixels in the level2.evt file, extra rows are filled as -1
| Pixel properties | Quadrant properties | ||||||
|---|---|---|---|---|---|---|---|
| Quadrant | DetID | PixID | Counts | Sigma | Mean | Median | Sigma |
| A | 15 | 174 | 30535 | 155.99 | 916 | 892 | 190.0 |
| A | 0 | 226 | 9044 | 42.9 | 916 | 892 | 190.0 |
| A | 12 | 194 | 8815 | 41.69 | 916 | 892 | 190.0 |
| B | 15 | 255 | 344453 | 1930.33 | 924 | 898 | 178.0 |
| B | 15 | 204 | 48088 | 265.14 | 924 | 898 | 178.0 |
| B | 0 | 214 | 46527 | 256.37 | 924 | 898 | 178.0 |
| C | 13 | 61 | 7272 | 30.32 | 899 | 901 | 210.1 |
| C | 8 | 222 | 2672 | 8.43 | 899 | 901 | 210.1 |
| C | 1 | 16 | 2373 | 7.01 | 899 | 901 | 210.1 |
| D | 1 | 20 | 2854437 | 13031.34 | 879 | 847 | 219.0 |
| D | 8 | 195 | 401699 | 1830.55 | 879 | 847 | 219.0 |
| D | 2 | 152 | 334814 | 1525.11 | 879 | 847 | 219.0 |
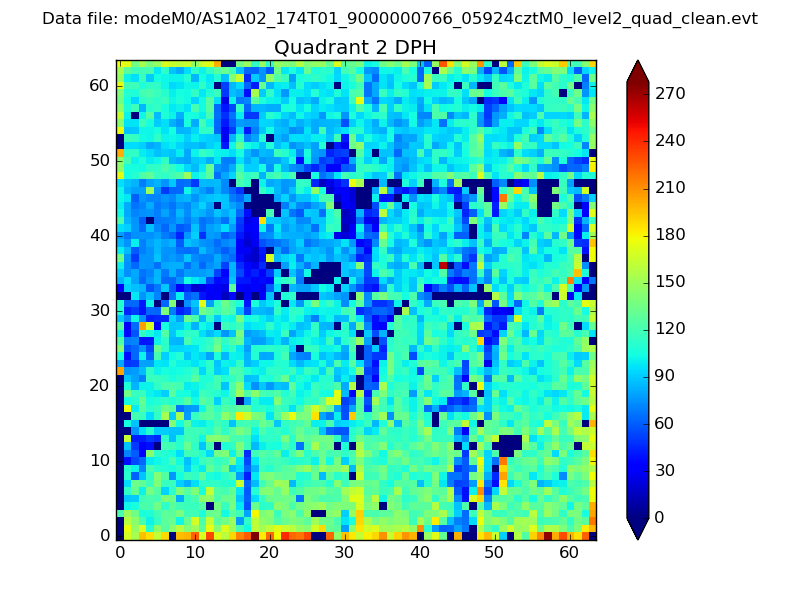
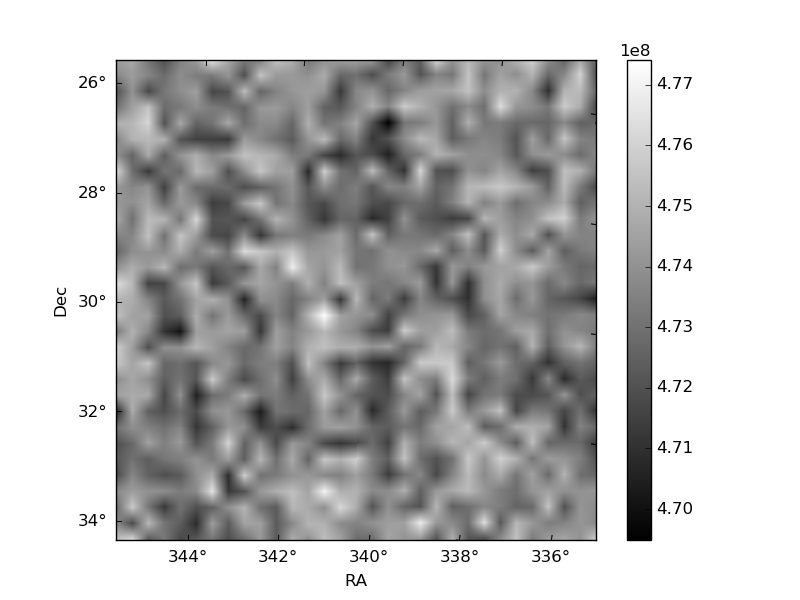
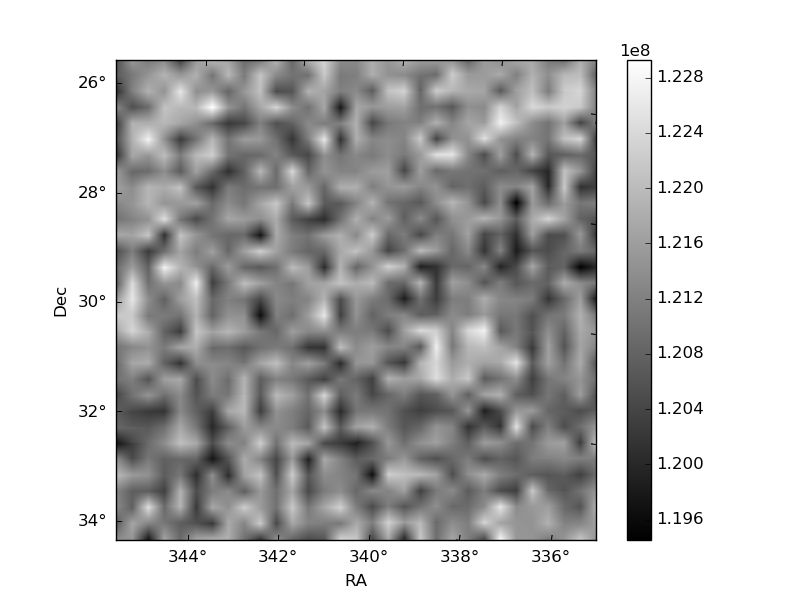
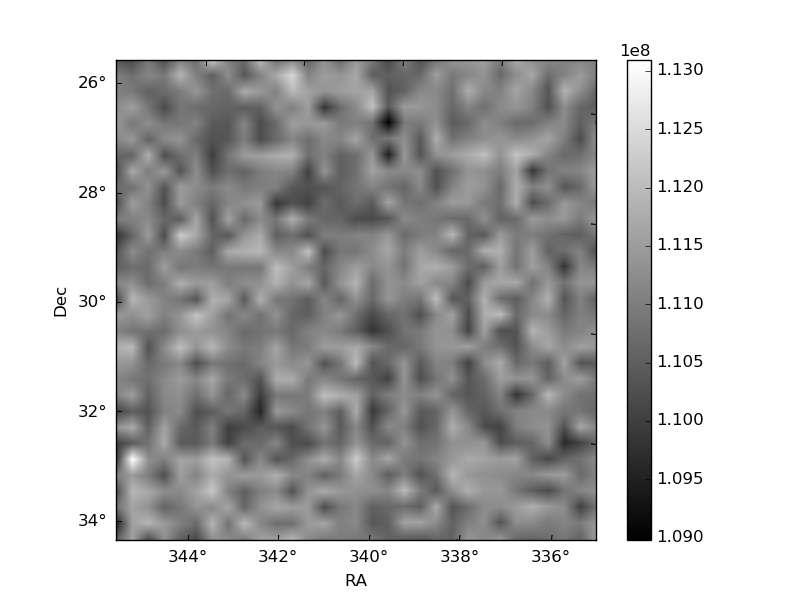
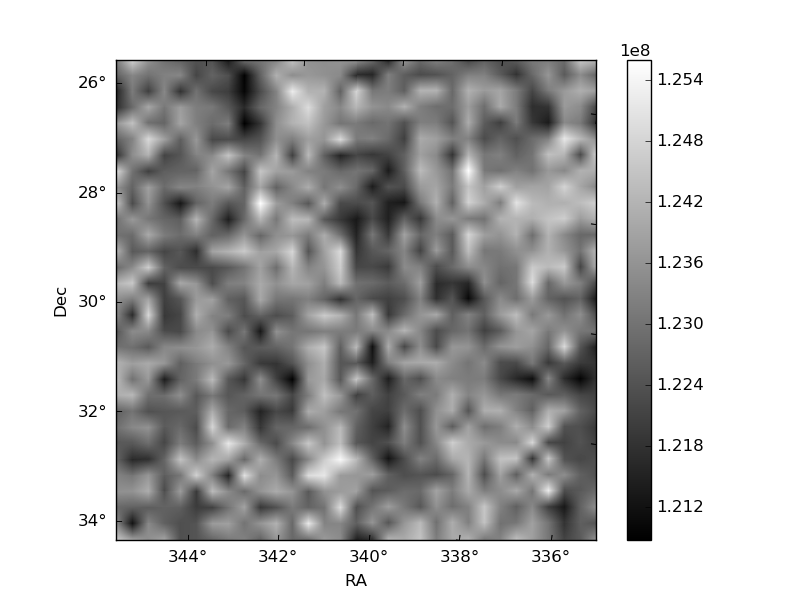
Histogram calculated using DETX and DETY for each event in the final _common_clean file
| Quadrant A | 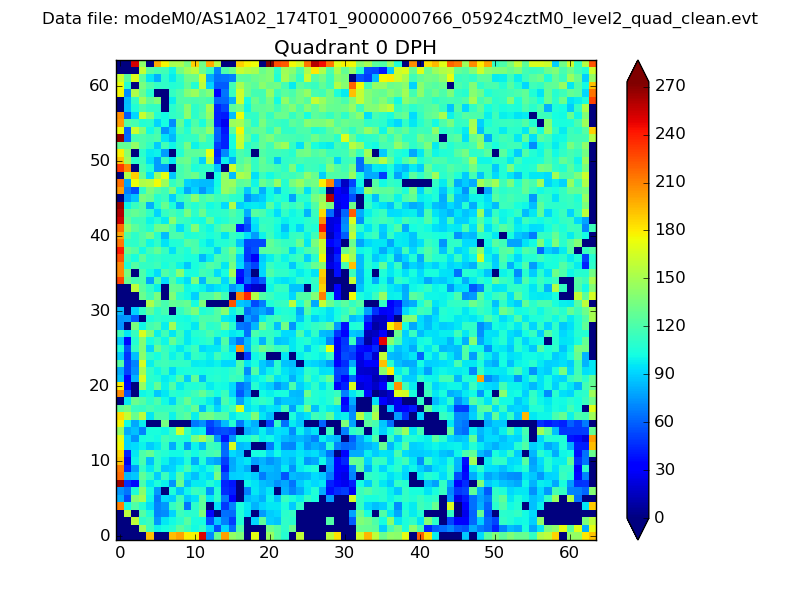 |
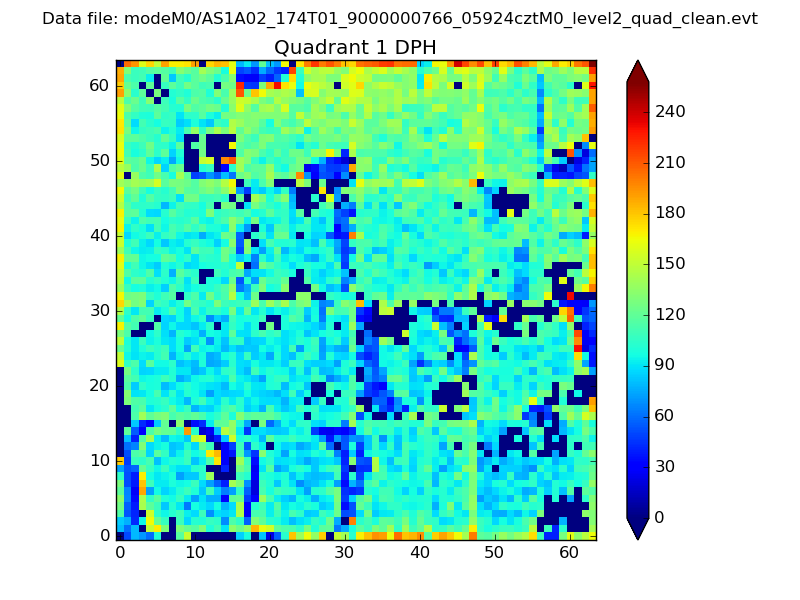 |
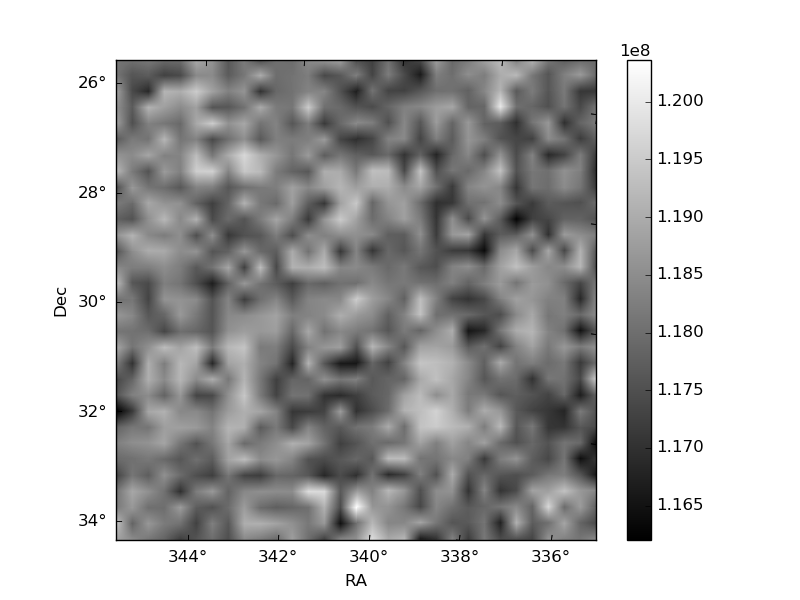
Quadrant B |
|---|---|---|---|
| Quadrant D | 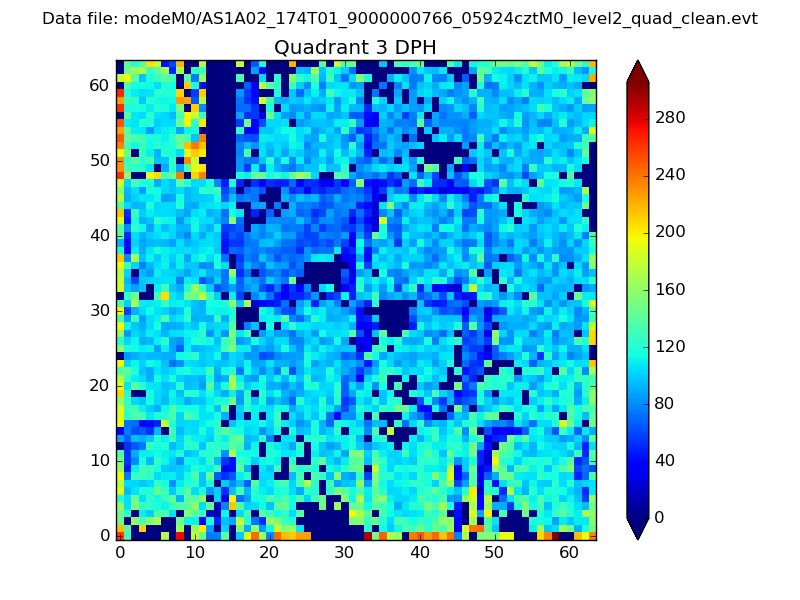 |
 |
Quadrant C |
| Plot type | Count rate plots | Images |
|---|---|---|
| Comparison with Poisson distribution Blue bars denote a histogram of data divided into 1 sec bins. Red curve is a Poisson curve with rate = median count rate of data. |
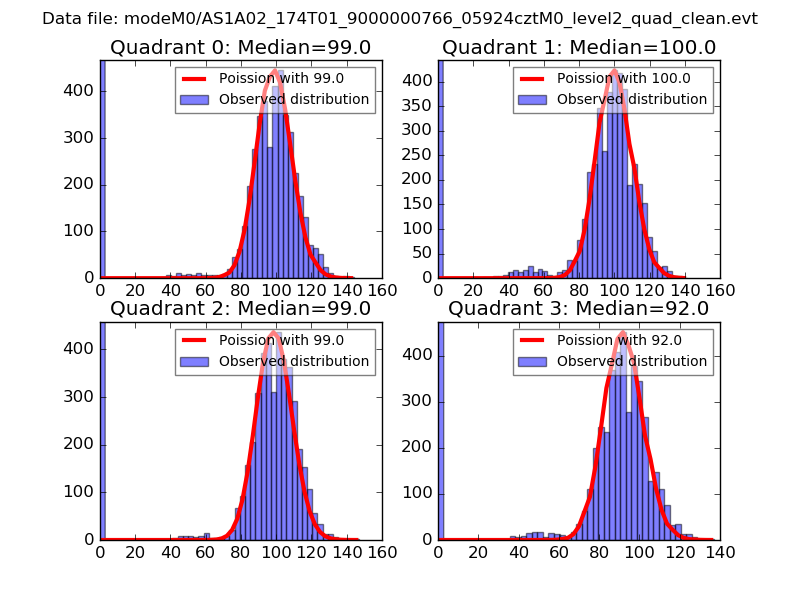 |
 |
| Quadrant-wise count rates Data is divided into 100 sec bins |
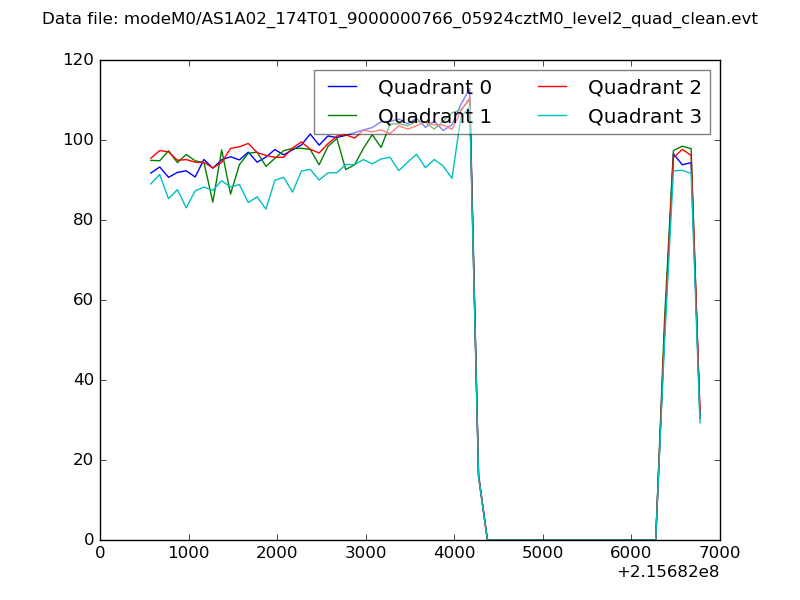 |
|
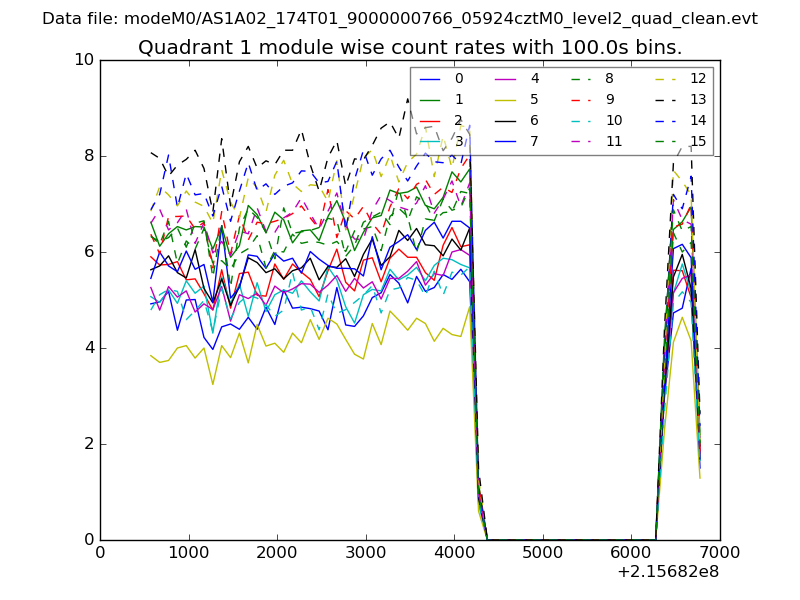
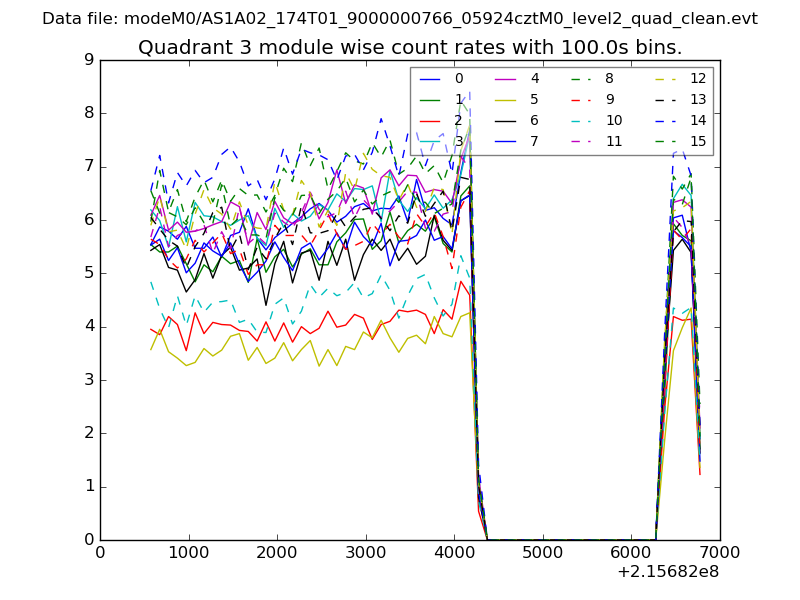
| Module-wise count rates for Quadrant A Data is divided into 100 sec bins |
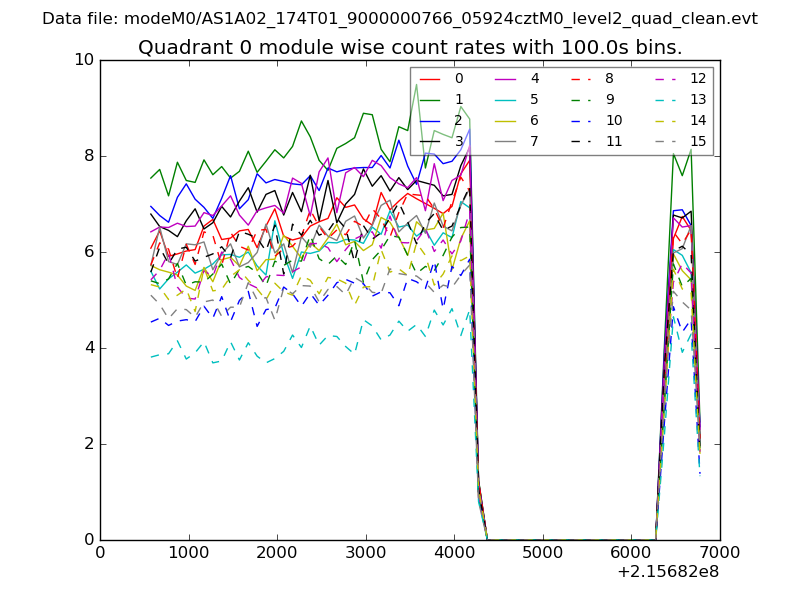 |
 |
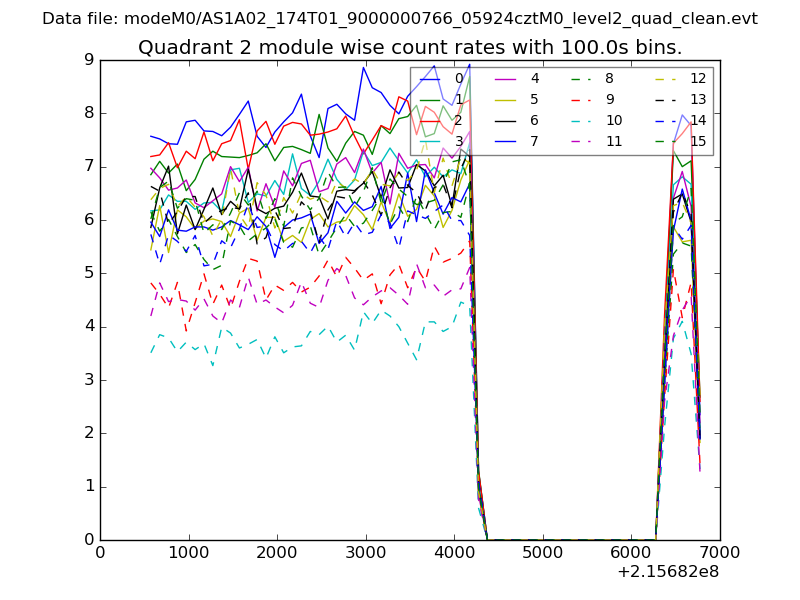
| Module-wise count rates for Quadrant B Data is divided into 100 sec bins |
 |
 |
| Module-wise count rates for Quadrant C Data is divided into 100 sec bins |
 |
 |
| Module-wise count rates for Quadrant D Data is divided into 100 sec bins |
 |
 |
| Parameter | Plot |
|---|---|
| CZT HV Monitor | 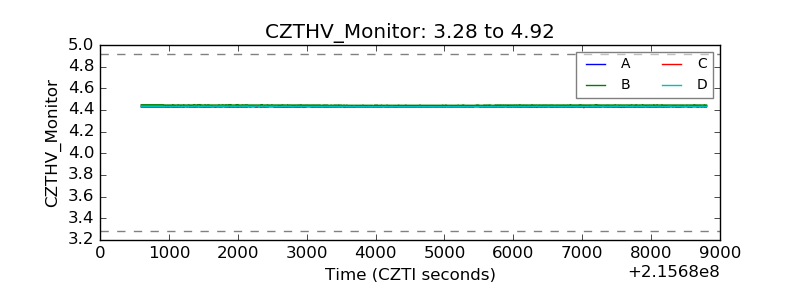 |
| D_VDD | 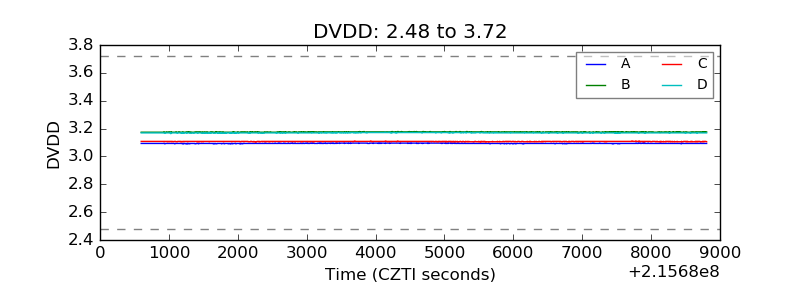 |
| Temperature 1 | 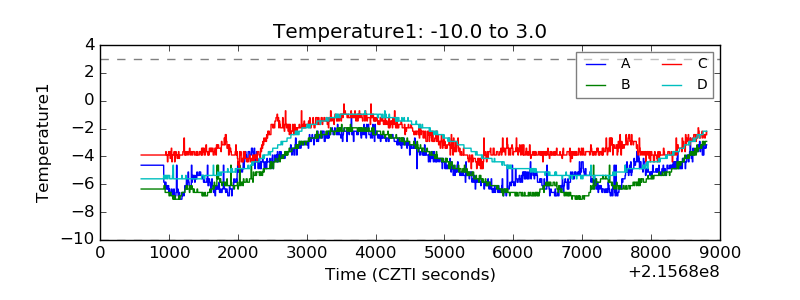 |
| Veto HV Monitor | 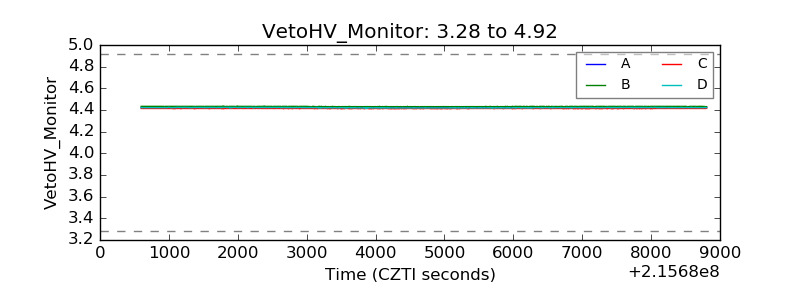 |
| Veto LLD | 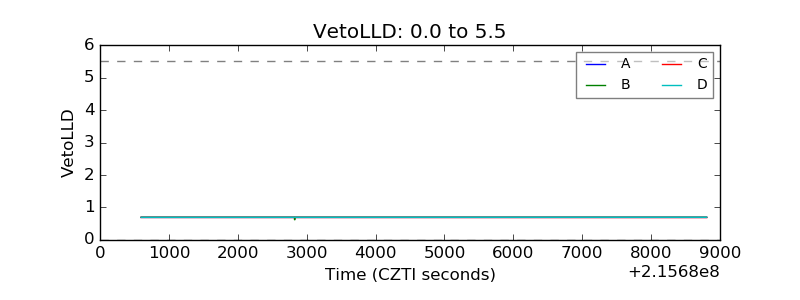 |
| Alpha Counter | 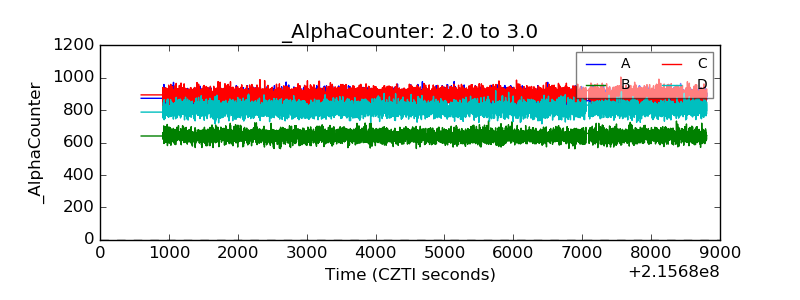 |
| _CPM_Rate | 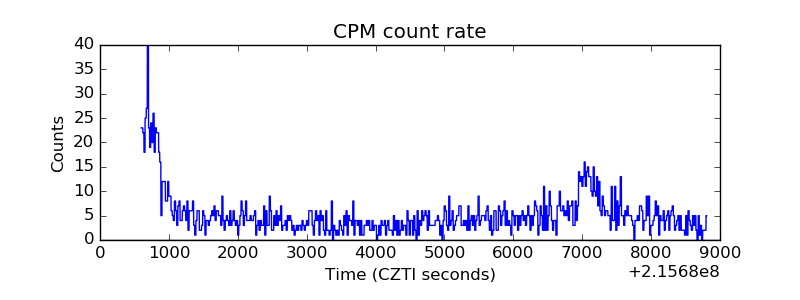 |
| CZT Counter | 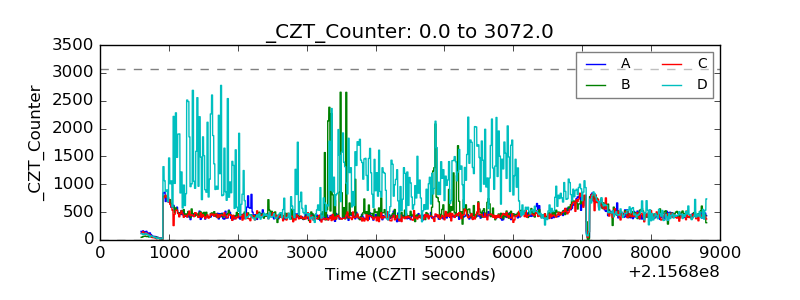 |
| +2.5 Volts monitor | 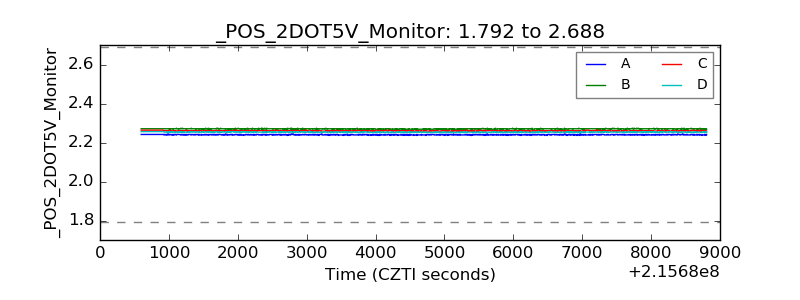 |
| +5 Volts monitor | 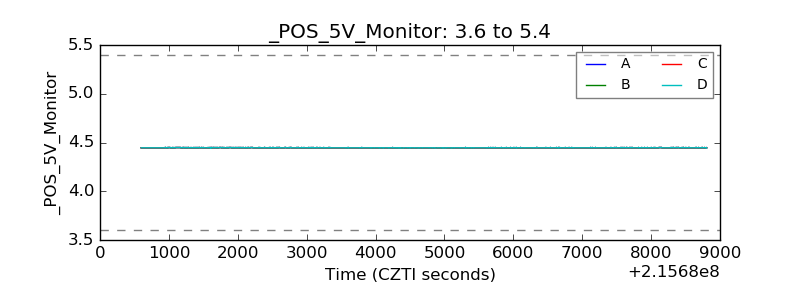 |
| _ROLL_ROT | 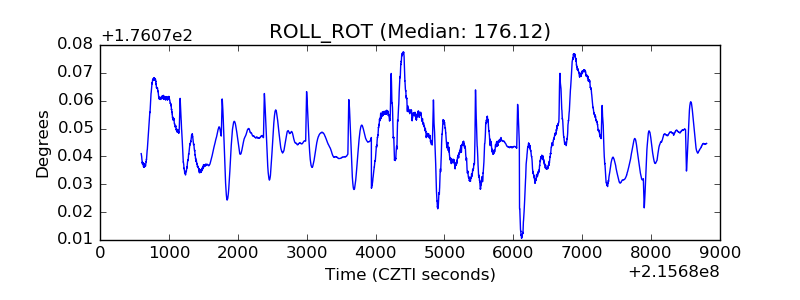 |
| _Roll_DEC | 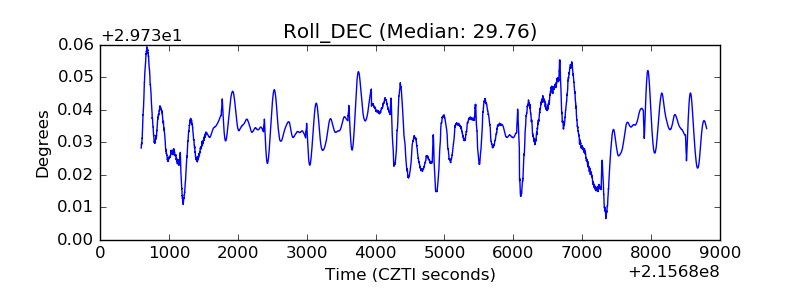 |
| _Roll_RA | 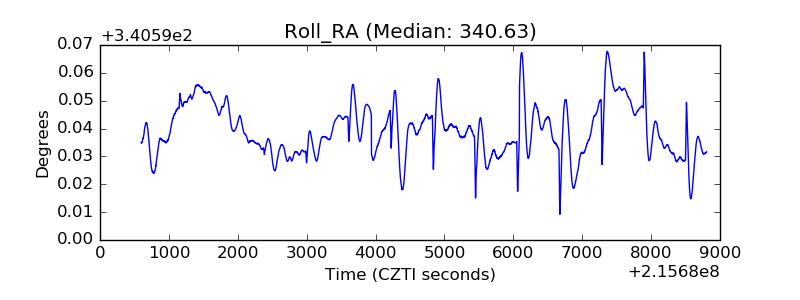 |
| Veto Counter | 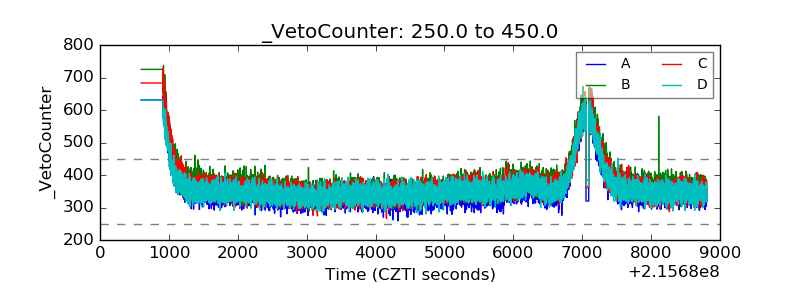 |