| Param | Original file | Final file |
|---|---|---|
| Filename | modeM0/AS1A02_174T01_9000000766_05928cztM0_level2.evt | modeM0/AS1A02_174T01_9000000766_05928cztM0_level2_quad_clean.evt |
| Size (bytes) | 231,952,320 | 36,273,600 |
| Size | 221.2 MB | 34.6 MB |
| Events in quadrant A | 1,535,447 | 228,348 |
| Events in quadrant B | 1,833,597 | 217,583 |
| Events in quadrant C | 1,471,795 | 230,808 |
| Events in quadrant D | 1,958,211 | 188,117 |
| Mode M9 | |||
|---|---|---|---|
| Quadrant | BADHDUFLAG | Total packets | Discarded packets |
| A | 0 | 4 | 3 |
| B | 0 | 4 | 4 |
| C | 0 | 4 | 2 |
| D | 0 | 4 | 3 |
| Mode M0 | |||
|---|---|---|---|
| Quadrant | BADHDUFLAG | Total packets | Discarded packets |
| A | 0 | 16750 | 9817 |
| B | 0 | 18886 | 11305 |
| C | 0 | 16416 | 9590 |
| D | 0 | 21666 | 13916 |
| Mode SS | |||
|---|---|---|---|
| Quadrant | BADHDUFLAG | Total packets | Discarded packets |
| A | 0 | 165 | 103 |
| B | 0 | 165 | 86 |
| C | 0 | 165 | 102 |
| D | 0 | 162 | 93 |
| Quadrant | Total seconds | Saturated seconds | Saturation percentage |
|---|---|---|---|
| A | 3380 | 36 | 1.065089% |
| B | 3263 | 73 | 2.237205% |
| C | 3394 | 13 | 0.383029% |
| D | 2985 | 82 | 2.747069% |
Noise dominated data is calculated using 1-second bins in cleaned event files. If a bin has >2000 counts, and if more than 50% of those come from <1% of pixels, then it is considered to be noise-dominated and hence unusable.
| Quadrant | # 1 sec bins | Bins with >0 counts | Bins with >2000 counts | High rate bins dominated by noise | Noise dominated (total time) | Noise dominated (detector-on time) | Marked lightcurve |
|---|---|---|---|---|---|---|---|
| A | 8325 | 4500 | 14 | 14 | 0.17% | 0.31% | 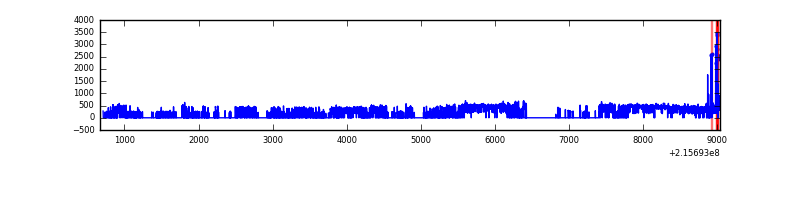 |
| B | 8367 | 4337 | 36 | 36 | 0.43% | 0.83% | 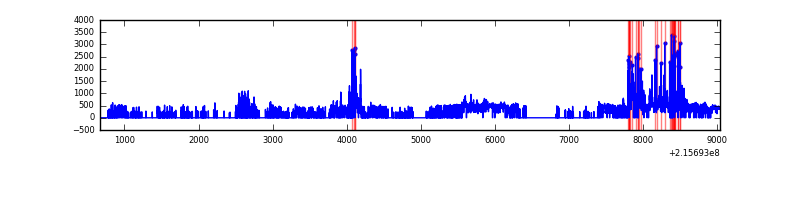 |
| C | 8266 | 4514 | 0 | 0 | 0.00% | 0.00% | 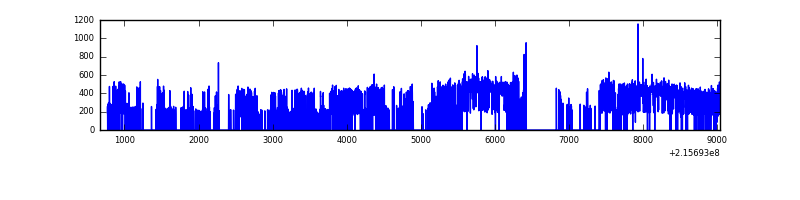 |
| D | 8292 | 4028 | 46 | 46 | 0.55% | 1.14% | 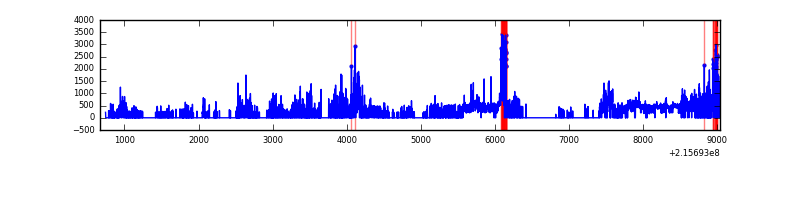 |
Top three noisy pixels from each quadrant. If the there are fewer than three noisy pixels in the level2.evt file, extra rows are filled as -1
| Pixel properties | Quadrant properties | ||||||
|---|---|---|---|---|---|---|---|
| Quadrant | DetID | PixID | Counts | Sigma | Mean | Median | Sigma |
| A | 0 | 50 | 50542 | 627.5 | 381 | 372 | 80.0 |
| A | 7 | 16 | 16030 | 195.84 | 381 | 372 | 80.0 |
| A | 12 | 194 | 3759 | 42.36 | 381 | 372 | 80.0 |
| B | 15 | 255 | 279866 | 3885.06 | 367 | 359 | 71.9 |
| B | 15 | 85 | 38740 | 533.48 | 367 | 359 | 71.9 |
| B | 0 | 214 | 32614 | 448.33 | 367 | 359 | 71.9 |
| C | 8 | 128 | 4325 | 44.75 | 373 | 377 | 88.2 |
| C | 13 | 61 | 3028 | 30.05 | 373 | 377 | 88.2 |
| C | 9 | 68 | 2999 | 29.72 | 373 | 377 | 88.2 |
| D | 2 | 63 | 393855 | 4845.57 | 326 | 314 | 81.2 |
| D | 2 | 14 | 120168 | 1475.73 | 326 | 314 | 81.2 |
| D | 8 | 195 | 83345 | 1022.34 | 326 | 314 | 81.2 |
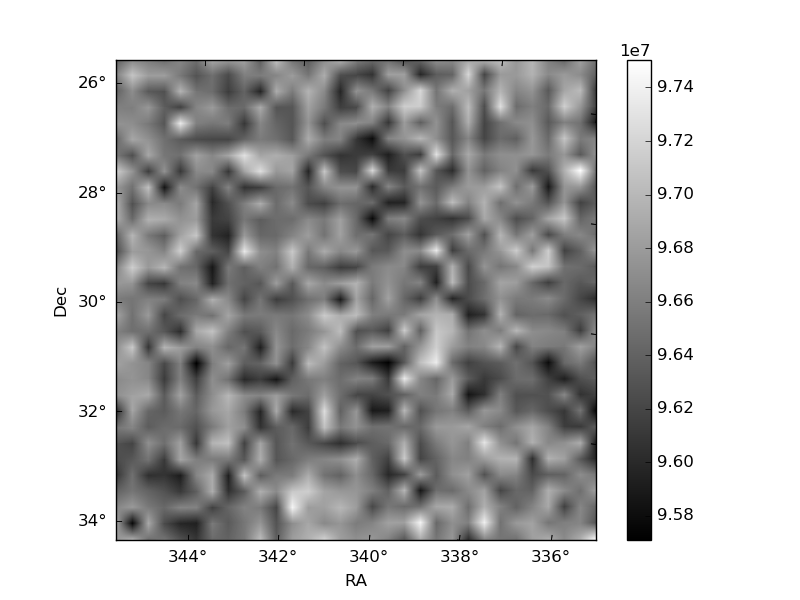
Histogram calculated using DETX and DETY for each event in the final _common_clean file
| Quadrant A | 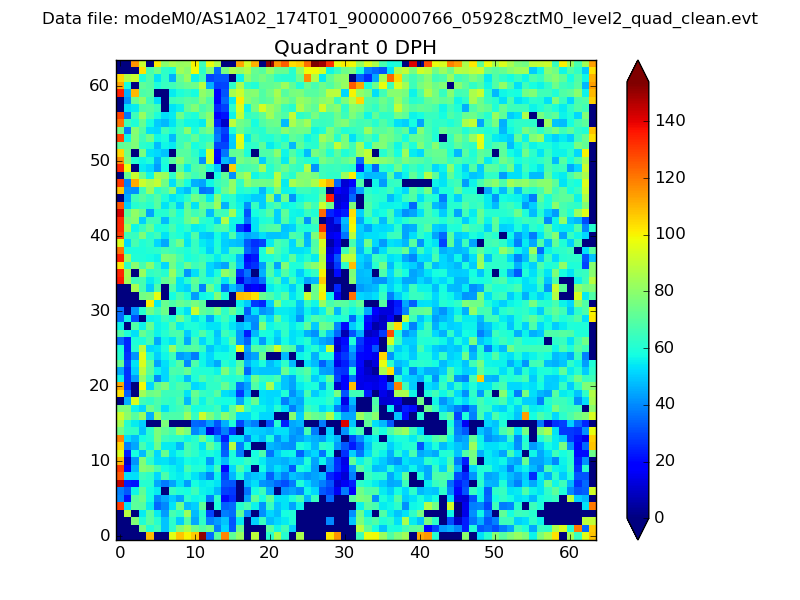 |
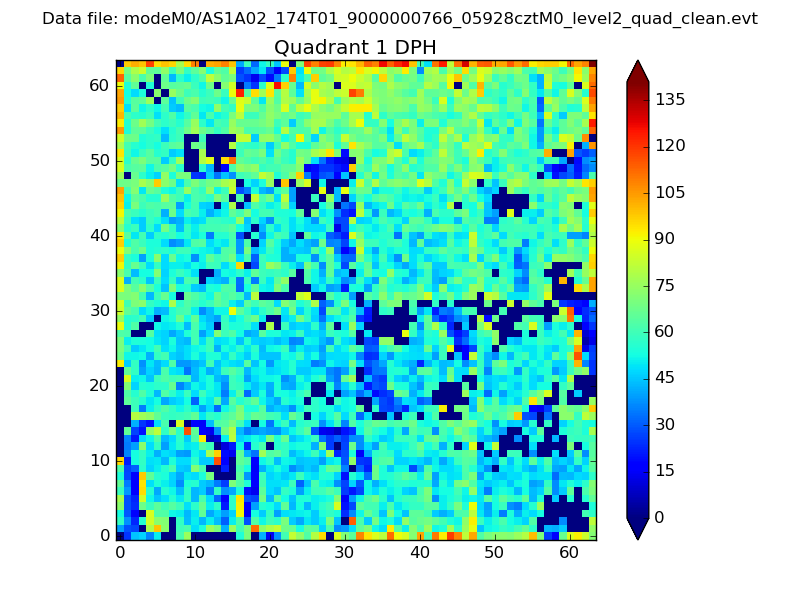 |
Quadrant B |
|---|---|---|---|
| Quadrant D | 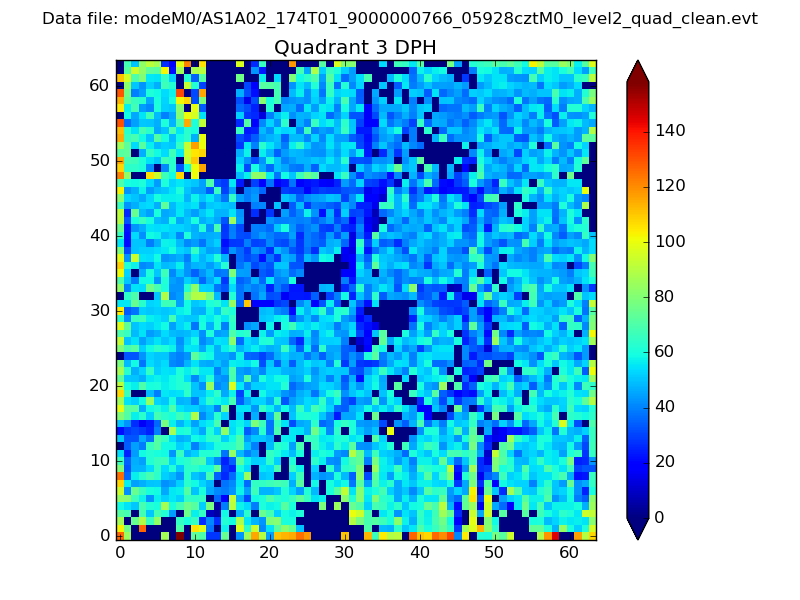 |
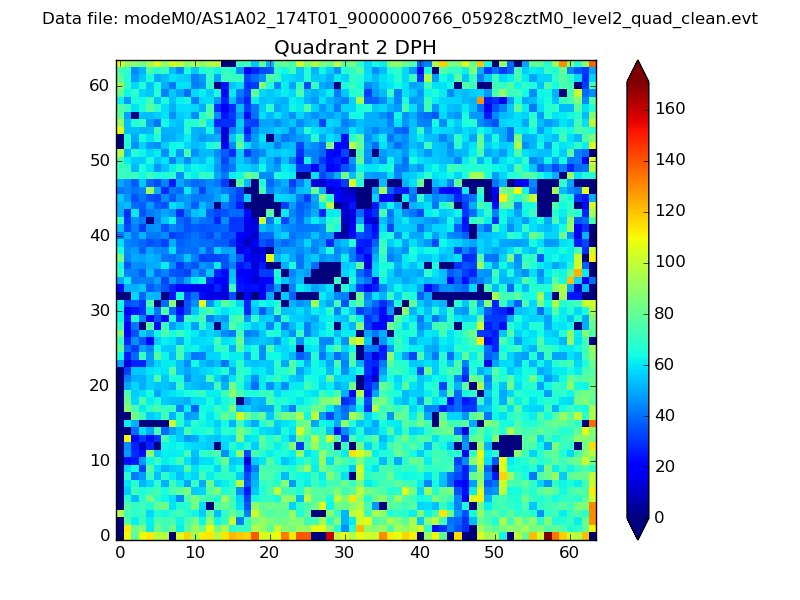 |
Quadrant C |
| Plot type | Count rate plots | Images |
|---|---|---|
| Comparison with Poisson distribution Blue bars denote a histogram of data divided into 1 sec bins. Red curve is a Poisson curve with rate = median count rate of data. |
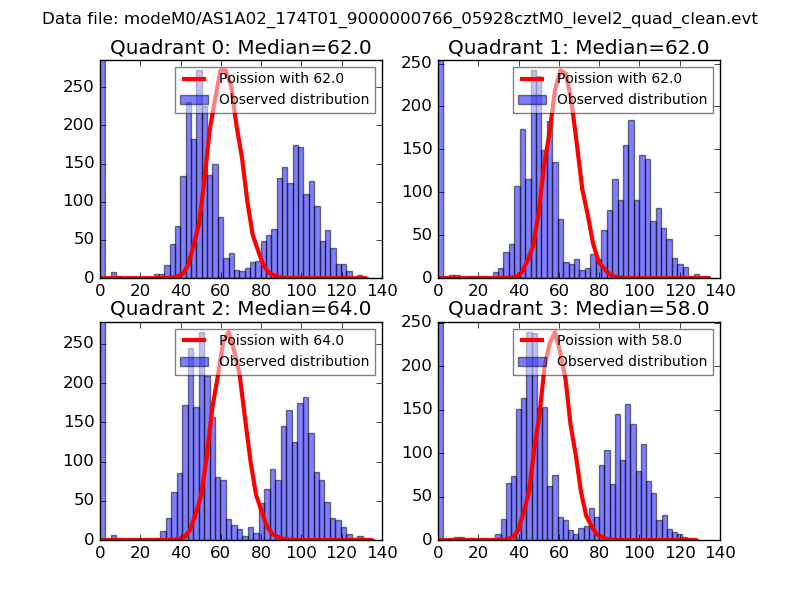 |
 |
| Quadrant-wise count rates Data is divided into 100 sec bins |
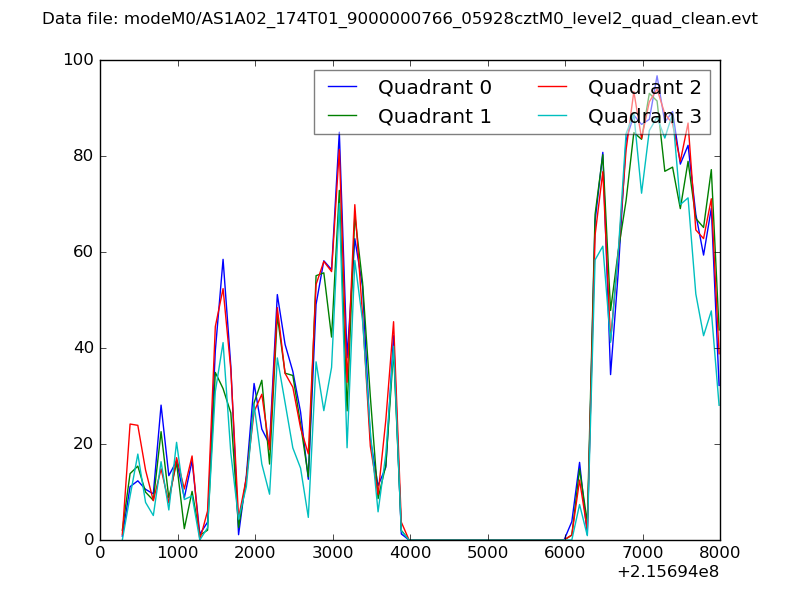 |
|
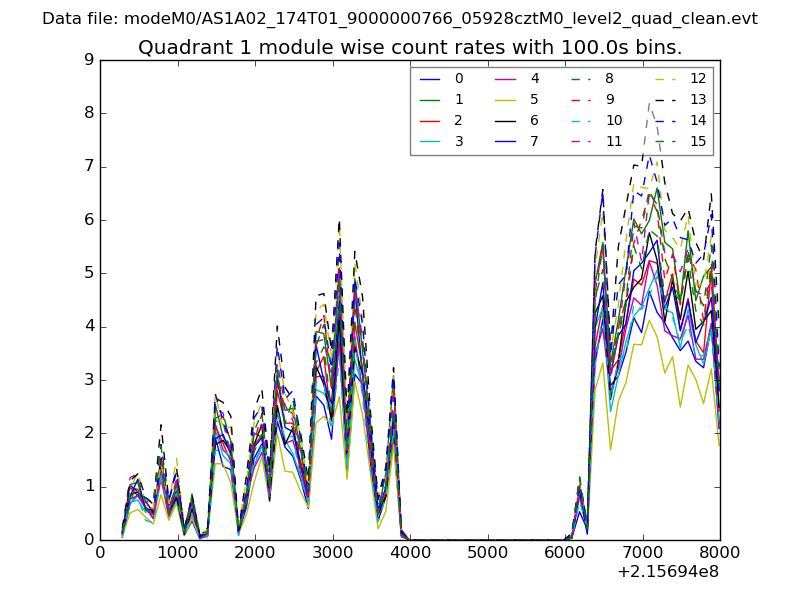
| Module-wise count rates for Quadrant A Data is divided into 100 sec bins |
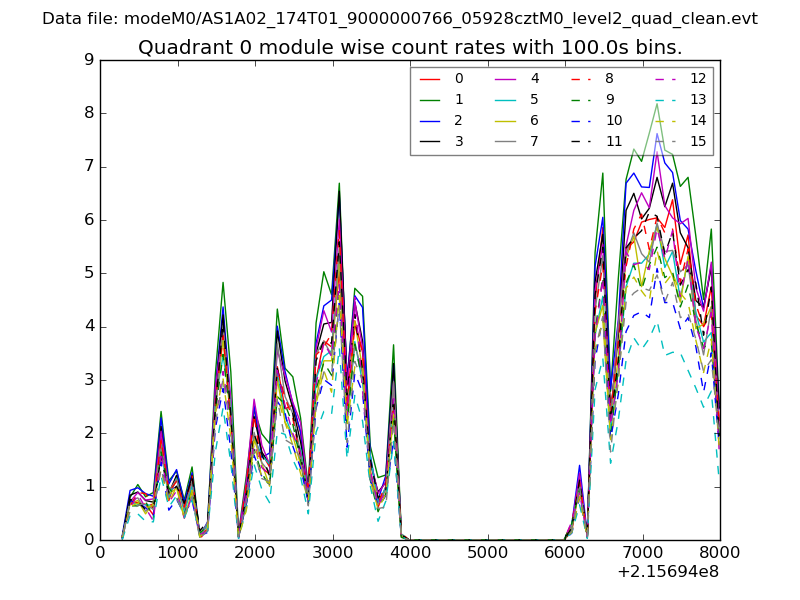 |
 |
| Module-wise count rates for Quadrant B Data is divided into 100 sec bins |
 |
 |
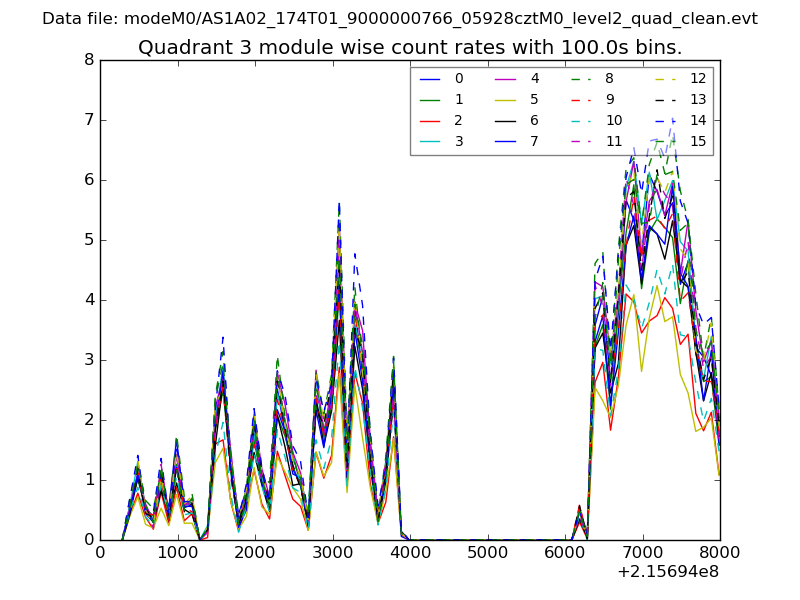
| Module-wise count rates for Quadrant C Data is divided into 100 sec bins |
 |
 |
| Module-wise count rates for Quadrant D Data is divided into 100 sec bins |
 |
 |
| Parameter | Plot |
|---|---|
| CZT HV Monitor | 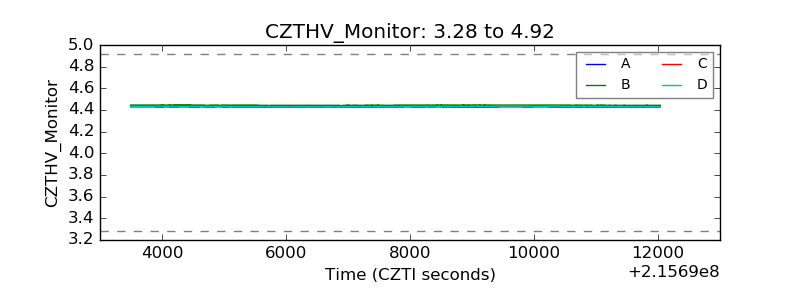 |
| D_VDD | 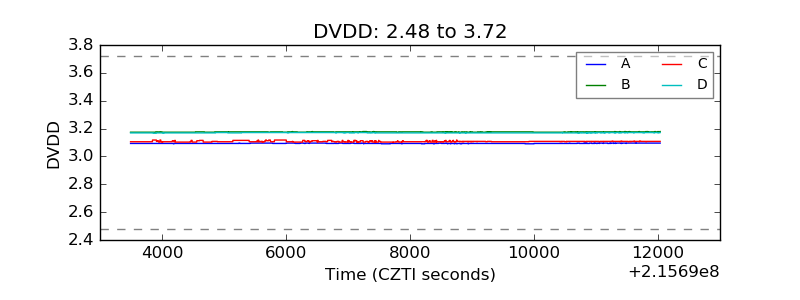 |
| Temperature 1 | 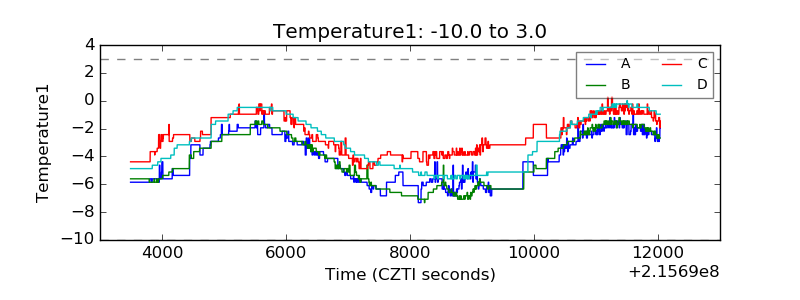 |
| Veto HV Monitor | 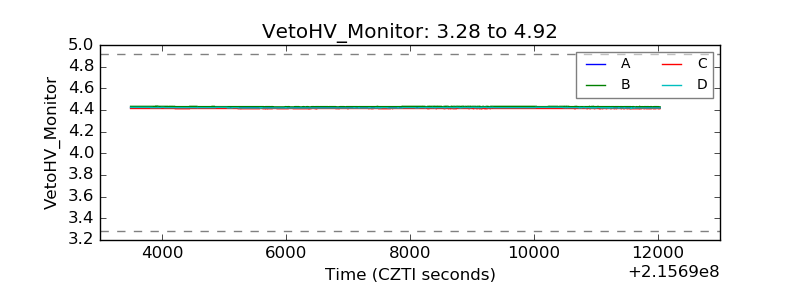 |
| Veto LLD | 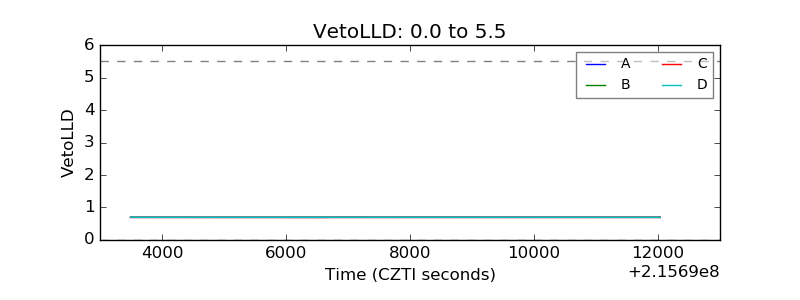 |
| Alpha Counter | 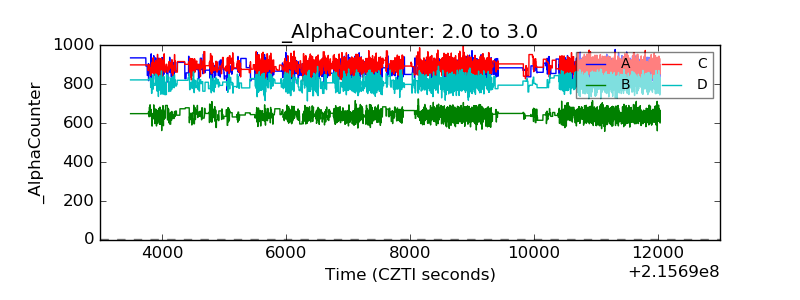 |
| _CPM_Rate | 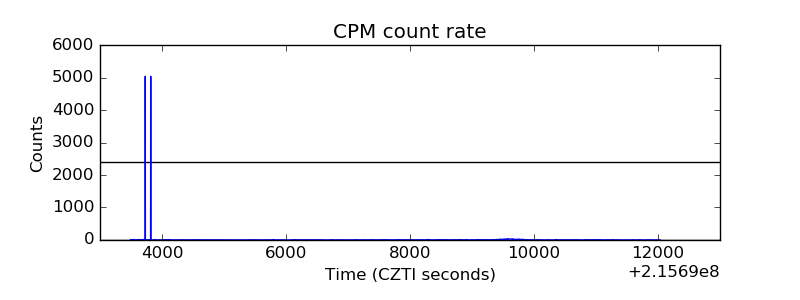 |
| CZT Counter | 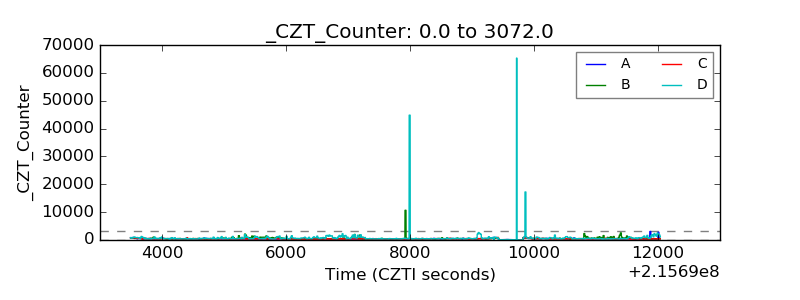 |
| +2.5 Volts monitor |  |
| +5 Volts monitor | 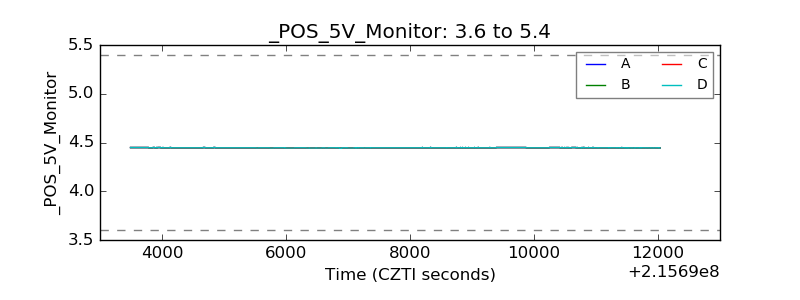 |
| _ROLL_ROT | 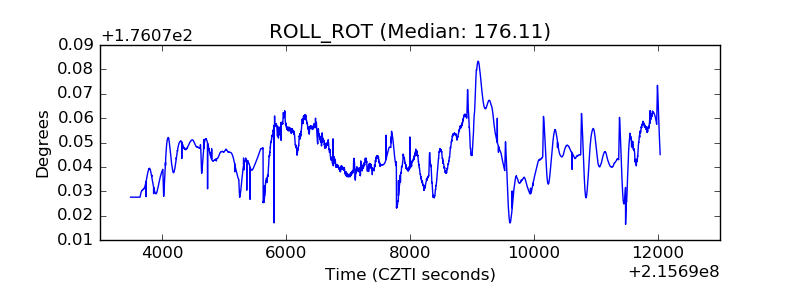 |
| _Roll_DEC | 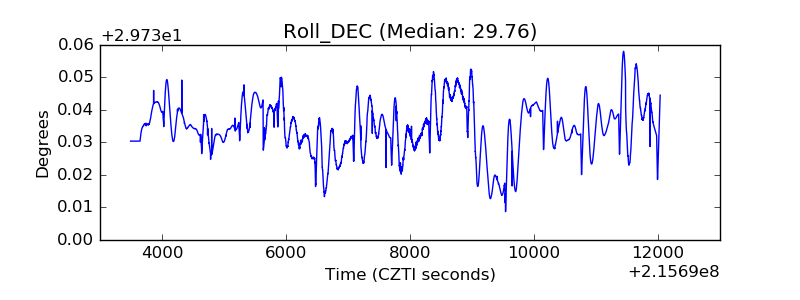 |
| _Roll_RA | 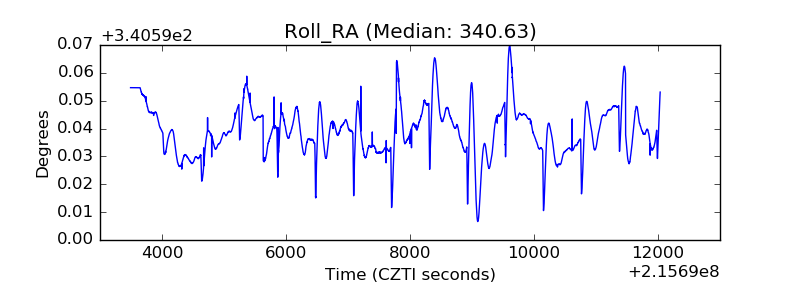 |
| Veto Counter | 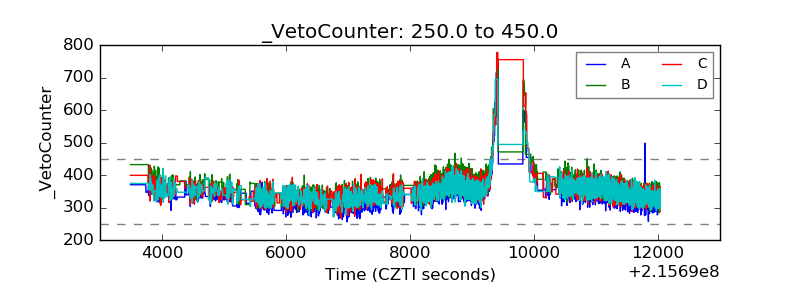 |