| Param | Original file | Final file |
|---|---|---|
| Filename | modeM0/AS1G06_028T01_9000000768cztM0_level2.fits | modeM0/AS1G06_028T01_9000000768cztM0_level2_quad_clean.evt |
| Size (bytes) | 335,295,360 | 297,691,200 |
| Size | 319.8 MB | 283.9 MB |
| Events in quadrant A | 2,025,068 | 1,719,393 |
| Events in quadrant B | 1,960,384 | 1,716,578 |
| Events in quadrant C | 2,001,888 | 1,650,522 |
| Events in quadrant D | 1,665,180 | 1,427,657 |
| Mode M0 | |||
|---|---|---|---|
| Quadrant | BADHDUFLAG | Total packets | Discarded packets |
| A | 0 | 76093 | 0 |
| B | 0 | 80865 | 0 |
| C | 0 | 74300 | 0 |
| D | 0 | 109733 | 0 |
| Mode M9 | |||
|---|---|---|---|
| Quadrant | BADHDUFLAG | Total packets | Discarded packets |
| A | 0 | 72 | 0 |
| B | 0 | 72 | 0 |
| C | 0 | 72 | 0 |
| D | 0 | 72 | 0 |
| Mode SS | |||
|---|---|---|---|
| Quadrant | BADHDUFLAG | Total packets | Discarded packets |
| A | 0 | 750 | 0 |
| B | 0 | 746 | 0 |
| C | 0 | 748 | 0 |
| D | 0 | 748 | 0 |
| Quadrant | Total seconds | Saturated seconds | Saturation percentage |
|---|---|---|---|
| A | 36382 | 338 | 0.929031% |
| B | 36385 | 496 | 1.363199% |
| C | 36431 | 135 | 0.370564% |
| D | 36328 | 2775 | 7.638736% |
Noise dominated data is calculated using 1-second bins in cleaned event files. If a bin has >2000 counts, and if more than 50% of those come from <1% of pixels, then it is considered to be noise-dominated and hence unusable.
| Quadrant | # 1 sec bins | Bins with >0 counts | Bins with >2000 counts | High rate bins dominated by noise | Noise dominated (total time) | Noise dominated (detector-on time) | Marked lightcurve |
|---|---|---|---|---|---|---|---|
| A | 44083 | 36703 | 0 | 0 | 0.00% | 0.00% |  |
| B | 44083 | 36719 | 0 | 0 | 0.00% | 0.00% | 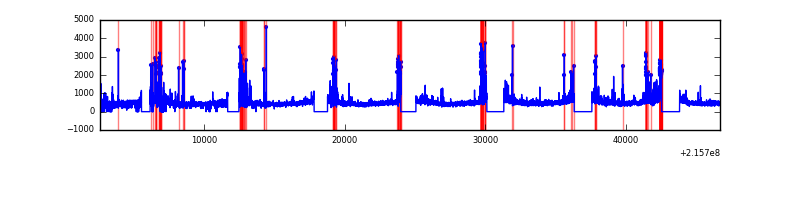 |
| C | 44083 | 36773 | 0 | 0 | 0.00% | 0.00% |  |
| D | 44083 | 36711 | 0 | 0 | 0.00% | 0.00% |  |
Top three noisy pixels from each quadrant. If the there are fewer than three noisy pixels in the level2.evt file, extra rows are filled as -1
| Pixel properties | Quadrant properties | ||||||
|---|---|---|---|---|---|---|---|
| Quadrant | DetID | PixID | Counts | Sigma | Mean | Median | Sigma |
| A | 14 | 188 | 2090 | 11.96 | 524 | 490 | 133.8 |
| A | 0 | 29 | 2000 | 11.29 | 524 | 490 | 133.8 |
| A | 14 | 204 | 1854 | 10.19 | 524 | 490 | 133.8 |
| B | 2 | 9 | 1744 | 11.85 | 516 | 491 | 105.8 |
| B | 12 | 226 | 1431 | 8.89 | 516 | 491 | 105.8 |
| B | 14 | 254 | 1372 | 8.33 | 516 | 491 | 105.8 |
| C | 12 | 241 | 1468 | 6.85 | 529 | 489 | 143.0 |
| C | 9 | 188 | 1355 | 6.06 | 529 | 489 | 143.0 |
| C | 9 | 242 | 1330 | 5.88 | 529 | 489 | 143.0 |
| D | 11 | 82 | 1268 | 6.45 | 474 | 430 | 130.0 |
| D | 10 | 189 | 1245 | 6.27 | 474 | 430 | 130.0 |
| D | 6 | 231 | 1242 | 6.25 | 474 | 430 | 130.0 |
Histogram calculated using DETX and DETY for each event in the final _common_clean file
| Quadrant A | 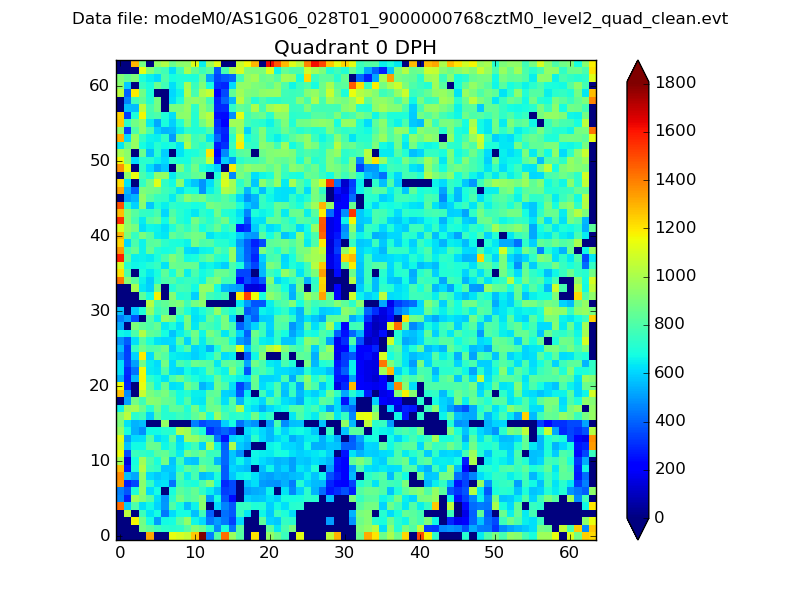 |
 |
Quadrant B |
|---|---|---|---|
| Quadrant D | 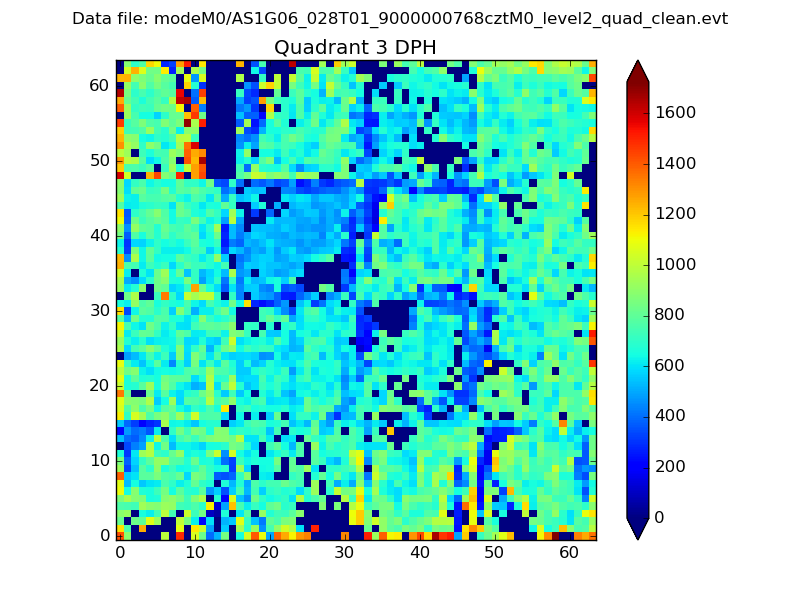 |
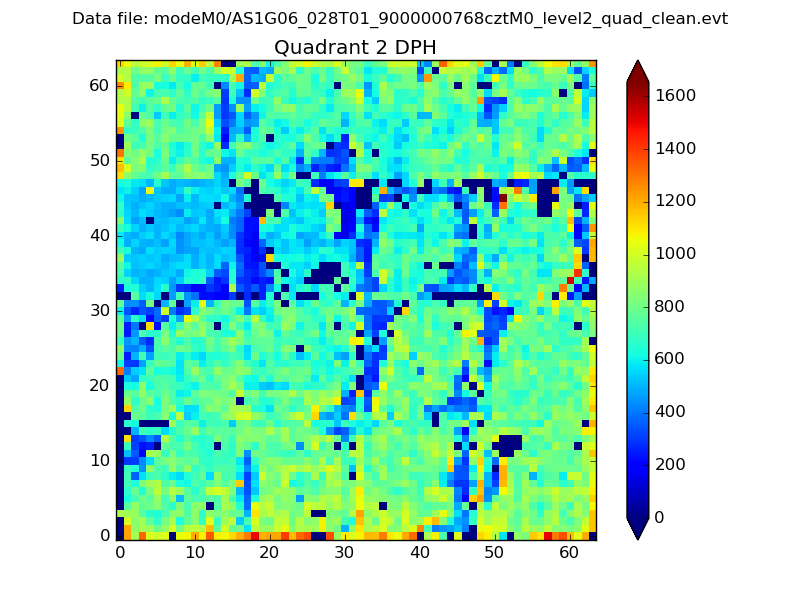 |
Quadrant C |
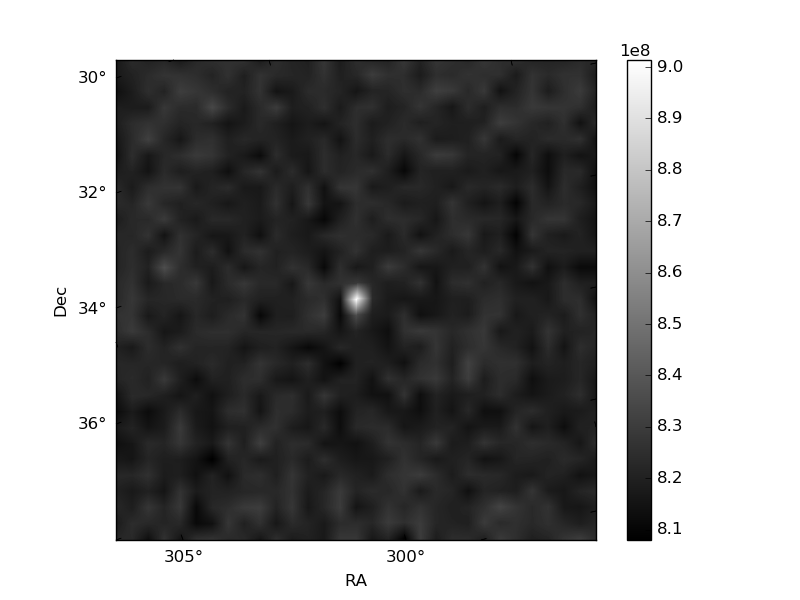
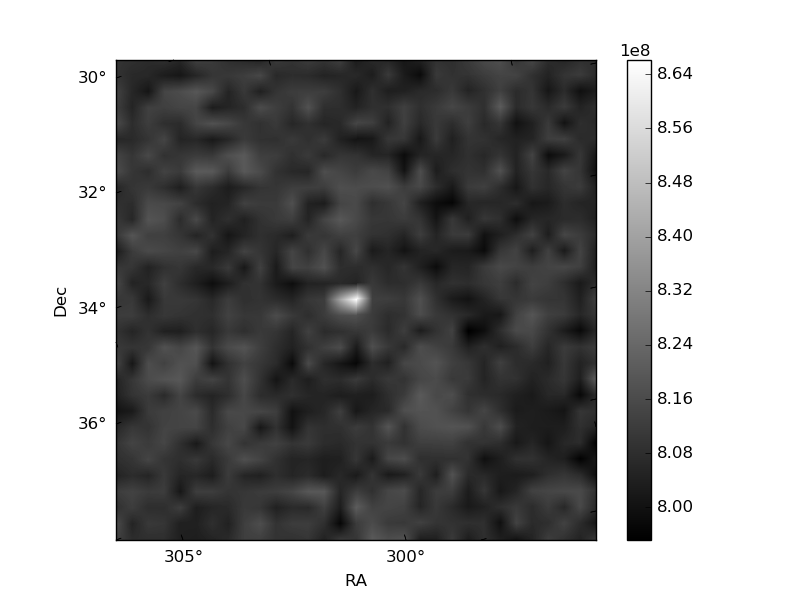
| Plot type | Count rate plots | Images |
|---|---|---|
| Comparison with Poisson distribution Blue bars denote a histogram of data divided into 1 sec bins. Red curve is a Poisson curve with rate = median count rate of data. |
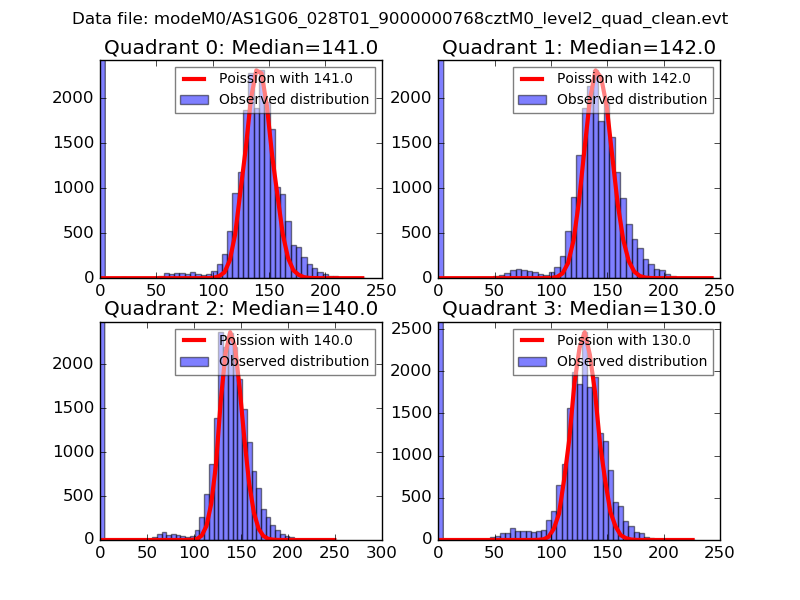 |
 |
| Quadrant-wise count rates Data is divided into 100 sec bins |
 |
|
| Module-wise count rates for Quadrant A Data is divided into 100 sec bins |
 |
 |
| Module-wise count rates for Quadrant B Data is divided into 100 sec bins |
 |
 |
| Module-wise count rates for Quadrant C Data is divided into 100 sec bins |
 |
 |
| Module-wise count rates for Quadrant D Data is divided into 100 sec bins |
 |
 |
| Parameter | Plot |
|---|---|
| CZT HV Monitor |  |
| D_VDD |  |
| Temperature 1 |  |
| Veto HV Monitor |  |
| Veto LLD | 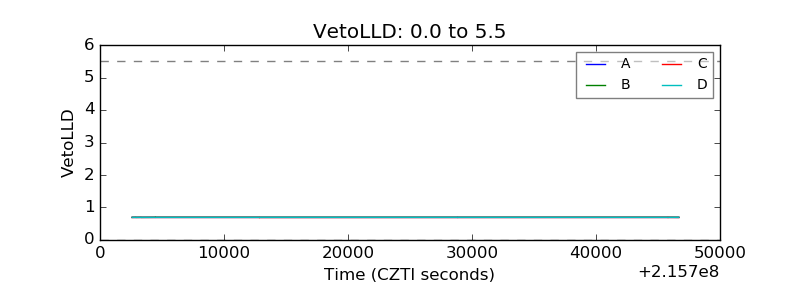 |
| Alpha Counter |  |
| _CPM_Rate | 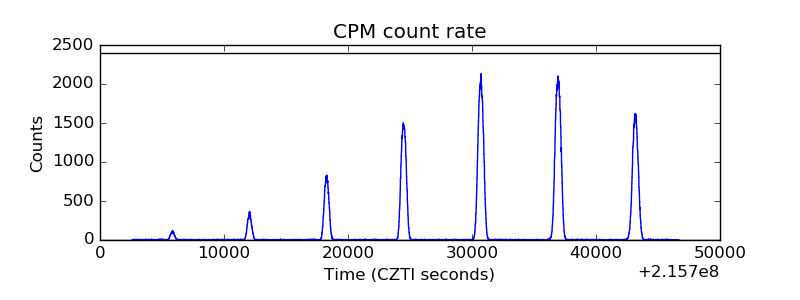 |
| CZT Counter | 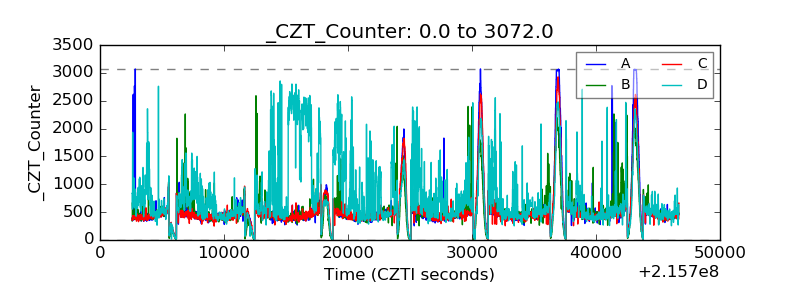 |
| +2.5 Volts monitor |  |
| +5 Volts monitor |  |
| _ROLL_ROT |  |
| _Roll_DEC |  |
| _Roll_RA |  |
| Veto Counter | 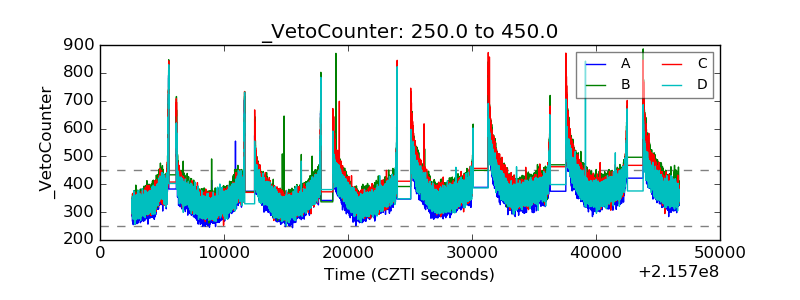 |