| Param | Original file | Final file |
|---|---|---|
| Filename | modeM0/AS1G06_028T01_9000000768_05931cztM0_level2.evt | modeM0/AS1G06_028T01_9000000768_05931cztM0_level2_quad_clean.evt |
| Size (bytes) | 506,522,880 | 84,516,480 |
| Size | 483.1 MB | 80.6 MB |
| Events in quadrant A | 2,939,047 | 544,687 |
| Events in quadrant B | 3,198,248 | 543,336 |
| Events in quadrant C | 2,938,955 | 538,358 |
| Events in quadrant D | 5,830,086 | 486,728 |
| Mode M0 | |||
|---|---|---|---|
| Quadrant | BADHDUFLAG | Total packets | Discarded packets |
| A | 0 | 13071 | 2 |
| B | 0 | 13792 | 1 |
| C | 0 | 13004 | 1 |
| D | 0 | 21792 | 1 |
| Mode M9 | |||
|---|---|---|---|
| Quadrant | BADHDUFLAG | Total packets | Discarded packets |
| A | 0 | 11 | 0 |
| B | 0 | 11 | 0 |
| C | 0 | 11 | 0 |
| D | 0 | 11 | 0 |
| Mode SS | |||
|---|---|---|---|
| Quadrant | BADHDUFLAG | Total packets | Discarded packets |
| A | 0 | 130 | 0 |
| B | 0 | 130 | 0 |
| C | 0 | 130 | 0 |
| D | 0 | 130 | 0 |
| Quadrant | Total seconds | Saturated seconds | Saturation percentage |
|---|---|---|---|
| A | 6391 | 25 | 0.391175% |
| B | 6391 | 77 | 1.204819% |
| C | 6391 | 27 | 0.422469% |
| D | 6391 | 532 | 8.324206% |
Noise dominated data is calculated using 1-second bins in cleaned event files. If a bin has >2000 counts, and if more than 50% of those come from <1% of pixels, then it is considered to be noise-dominated and hence unusable.
| Quadrant | # 1 sec bins | Bins with >0 counts | Bins with >2000 counts | High rate bins dominated by noise | Noise dominated (total time) | Noise dominated (detector-on time) | Marked lightcurve |
|---|---|---|---|---|---|---|---|
| A | 7476 | 6392 | 2 | 2 | 0.03% | 0.03% | 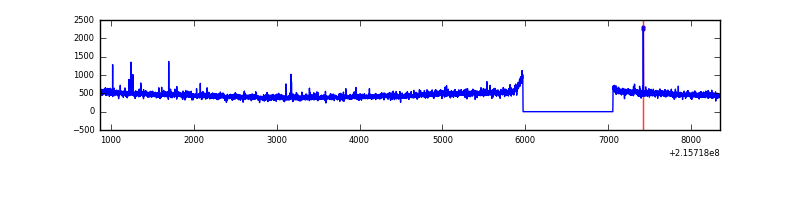 |
| B | 7476 | 6391 | 25 | 25 | 0.33% | 0.39% | 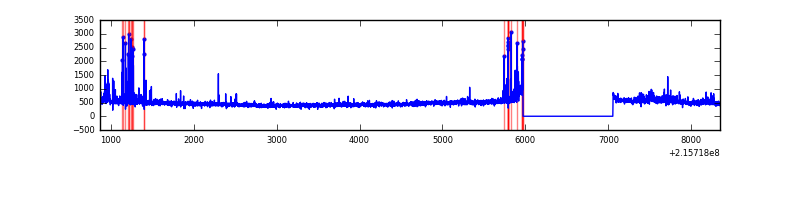 |
| C | 7476 | 6392 | 0 | 0 | 0.00% | 0.00% | 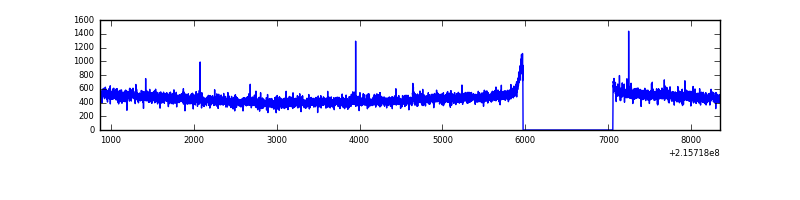 |
| D | 7476 | 6392 | 377 | 377 | 5.04% | 5.90% | 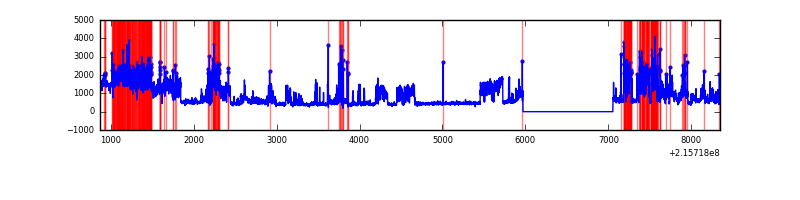 |
Top three noisy pixels from each quadrant. If the there are fewer than three noisy pixels in the level2.evt file, extra rows are filled as -1
| Pixel properties | Quadrant properties | ||||||
|---|---|---|---|---|---|---|---|
| Quadrant | DetID | PixID | Counts | Sigma | Mean | Median | Sigma |
| A | 7 | 16 | 27120 | 170.64 | 754 | 738 | 154.6 |
| A | 12 | 194 | 7292 | 42.39 | 754 | 738 | 154.6 |
| A | 0 | 226 | 6928 | 40.04 | 754 | 738 | 154.6 |
| B | 4 | 80 | 75165 | 510.24 | 761 | 745 | 145.9 |
| B | 15 | 204 | 73436 | 498.39 | 761 | 745 | 145.9 |
| B | 15 | 255 | 58855 | 398.42 | 761 | 745 | 145.9 |
| C | 9 | 68 | 21796 | 122.2 | 741 | 749 | 172.2 |
| C | 14 | 67 | 17582 | 97.73 | 741 | 749 | 172.2 |
| C | 13 | 61 | 5919 | 30.02 | 741 | 749 | 172.2 |
| D | 2 | 63 | 1922013 | 10894.05 | 721 | 700 | 176.4 |
| D | 1 | 20 | 1017133 | 5763.28 | 721 | 700 | 176.4 |
| D | 2 | 152 | 87425 | 491.74 | 721 | 700 | 176.4 |
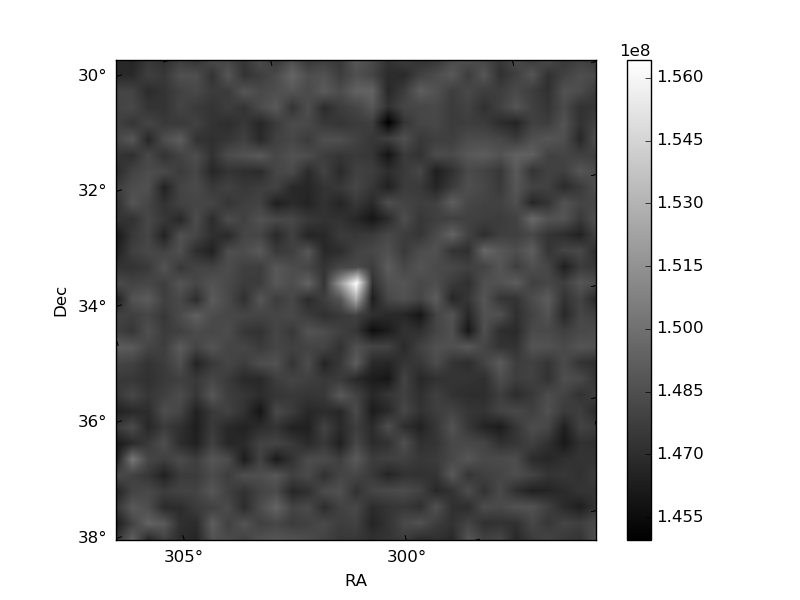
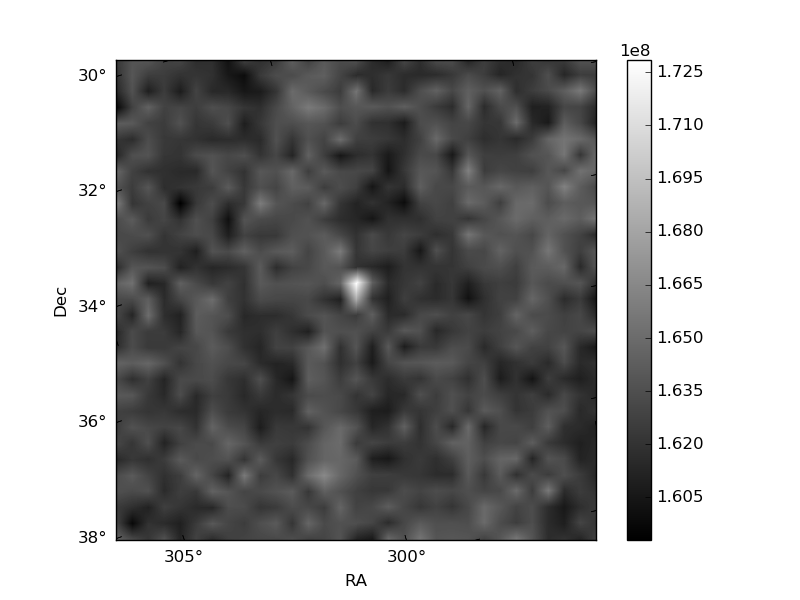
Histogram calculated using DETX and DETY for each event in the final _common_clean file
| Quadrant A | 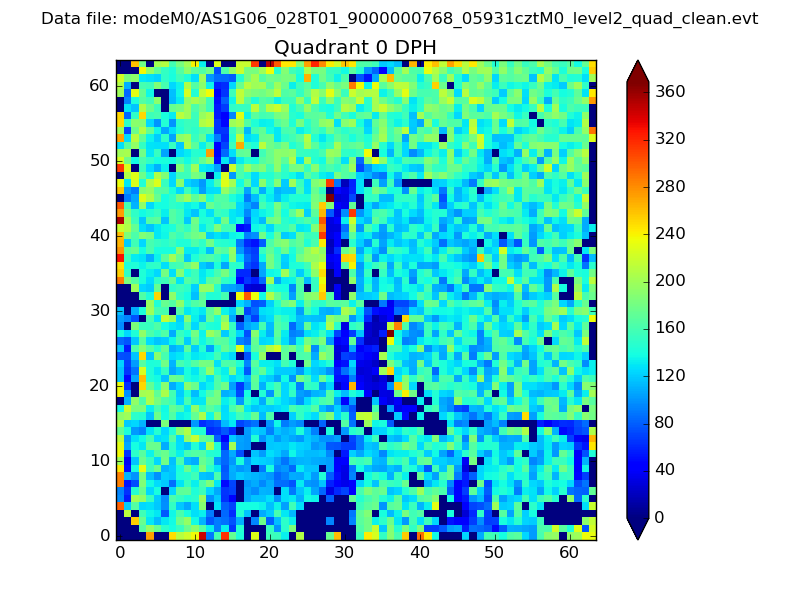 |
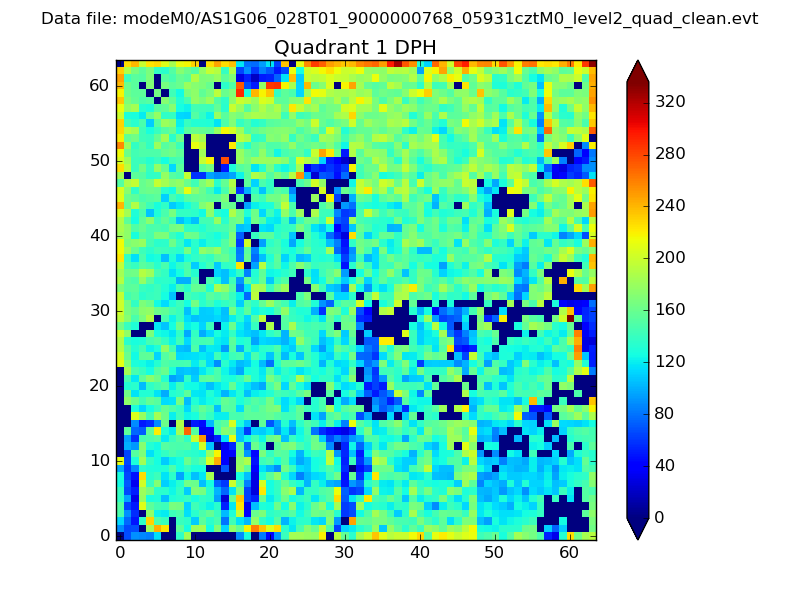 |
Quadrant B |
|---|---|---|---|
| Quadrant D | 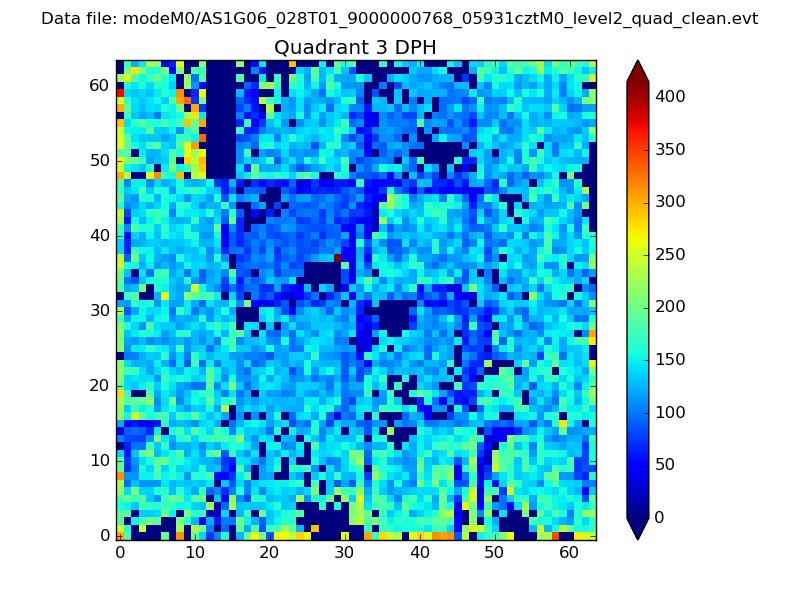 |
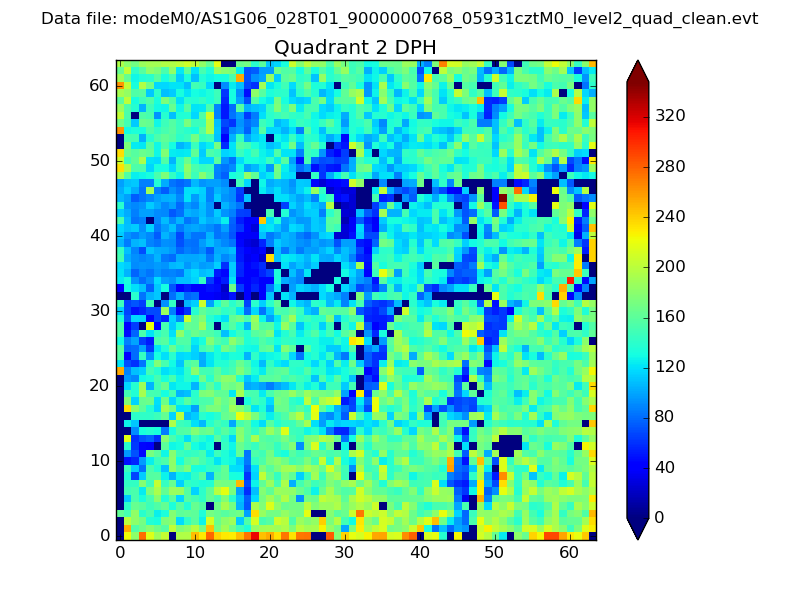 |
Quadrant C |
| Plot type | Count rate plots | Images |
|---|---|---|
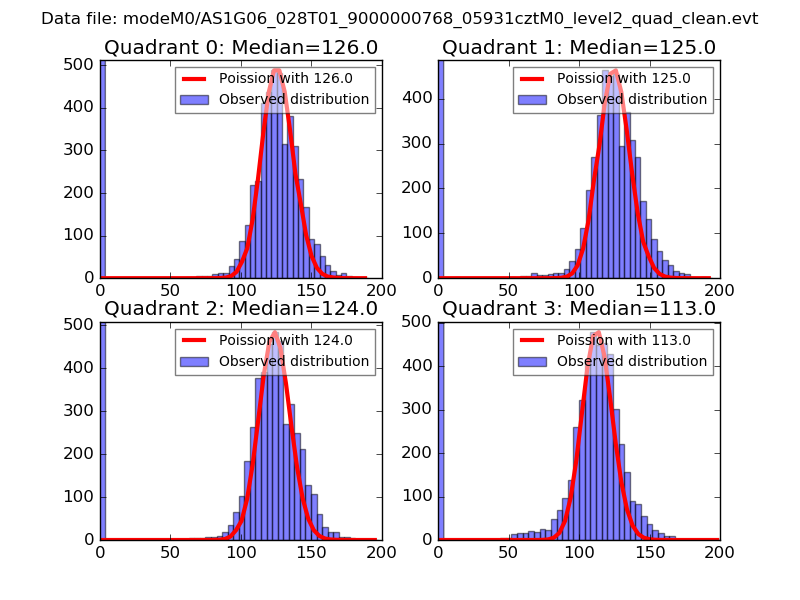
| Comparison with Poisson distribution Blue bars denote a histogram of data divided into 1 sec bins. Red curve is a Poisson curve with rate = median count rate of data. |
 |
 |
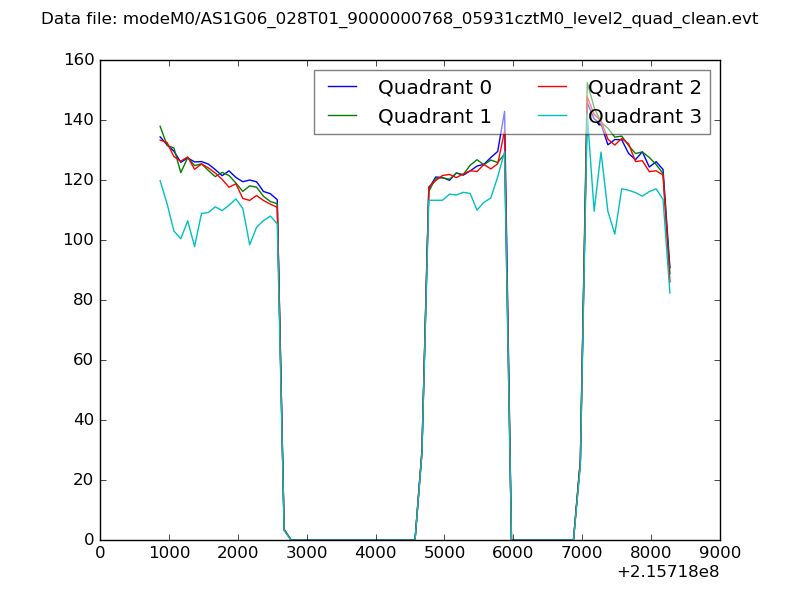
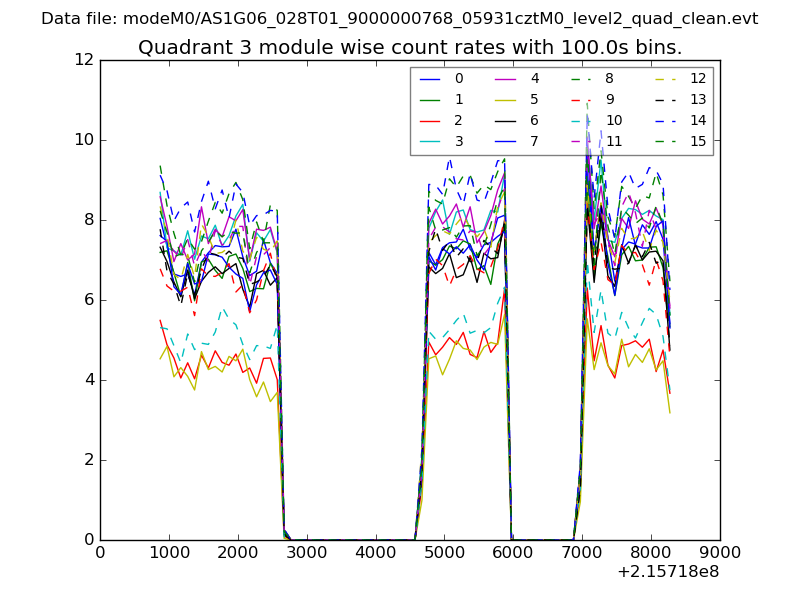
| Quadrant-wise count rates Data is divided into 100 sec bins |
 |
|
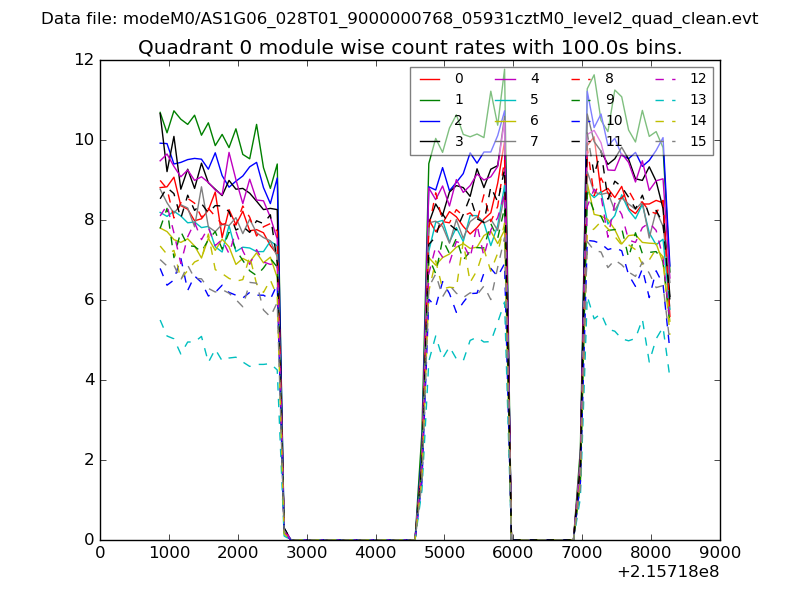
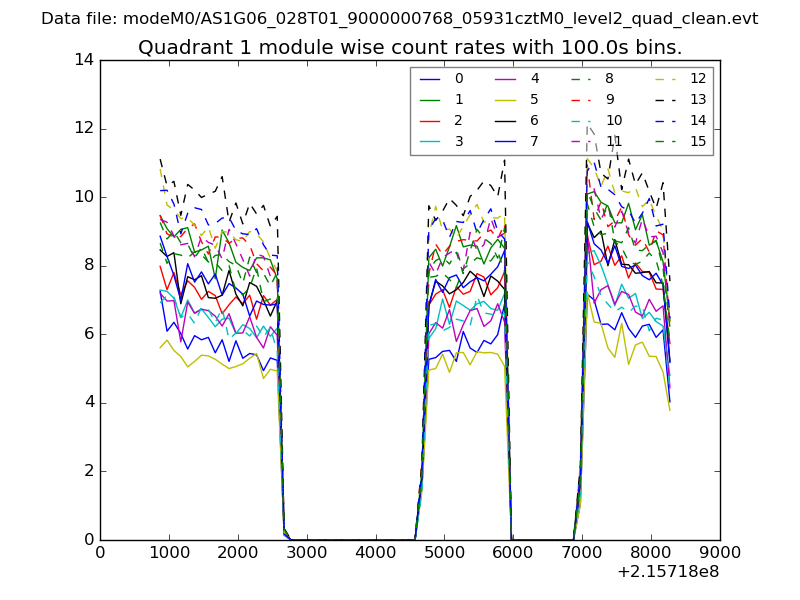
| Module-wise count rates for Quadrant A Data is divided into 100 sec bins |
 |
 |
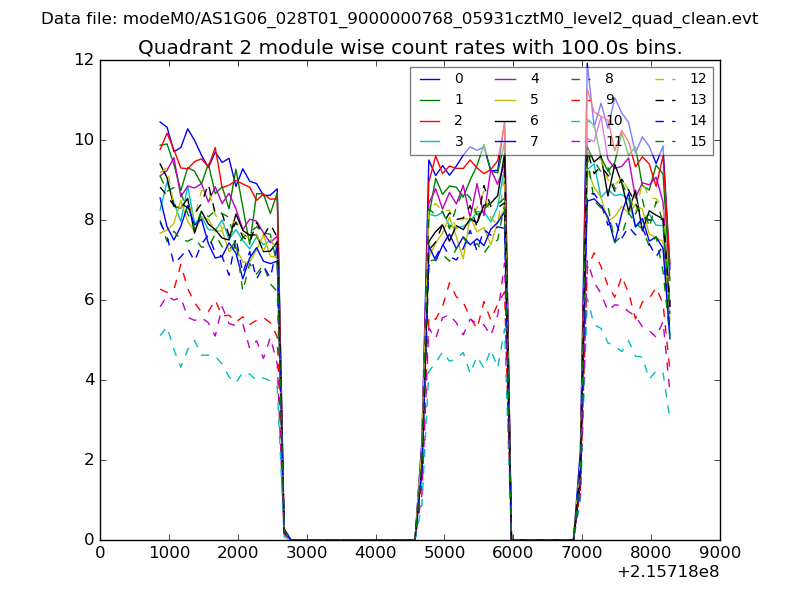
| Module-wise count rates for Quadrant B Data is divided into 100 sec bins |
 |
 |
| Module-wise count rates for Quadrant C Data is divided into 100 sec bins |
 |
 |
| Module-wise count rates for Quadrant D Data is divided into 100 sec bins |
 |
 |
| Parameter | Plot |
|---|---|
| CZT HV Monitor | 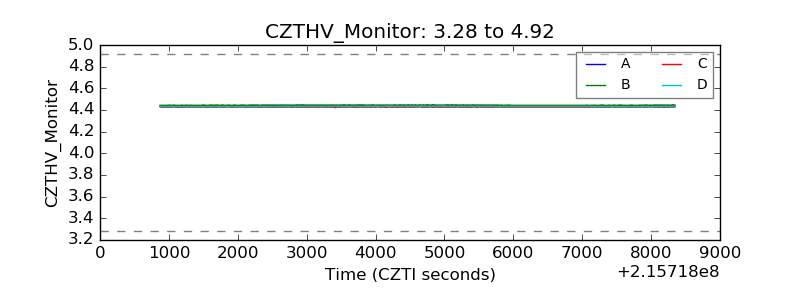 |
| D_VDD | 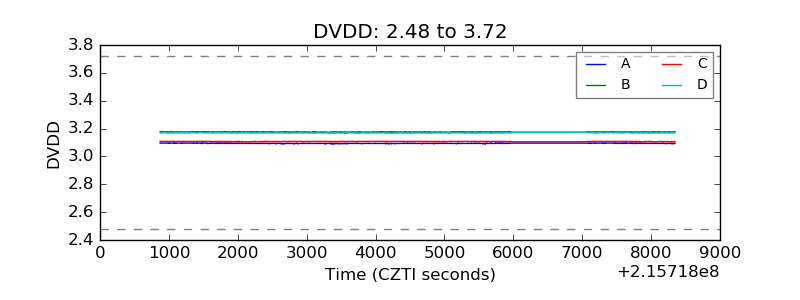 |
| Temperature 1 | 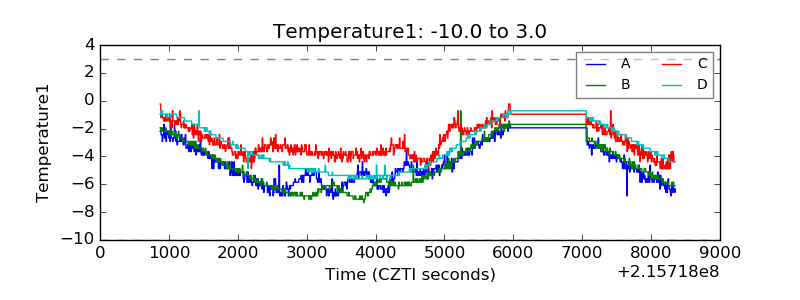 |
| Veto HV Monitor | 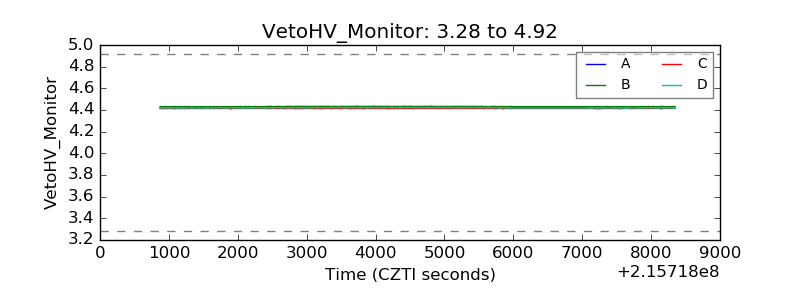 |
| Veto LLD | 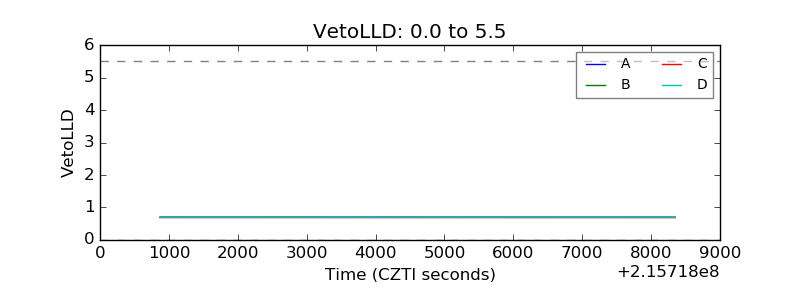 |
| Alpha Counter | 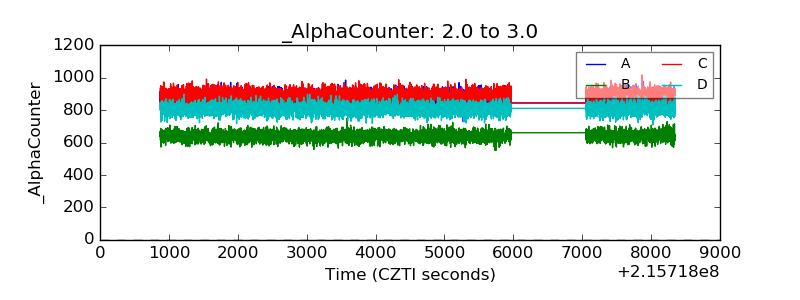 |
| _CPM_Rate | 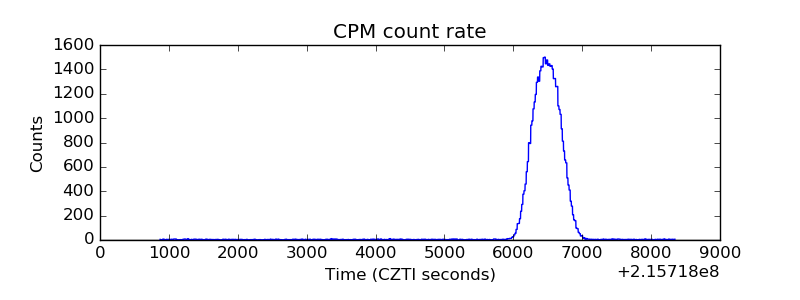 |
| CZT Counter | 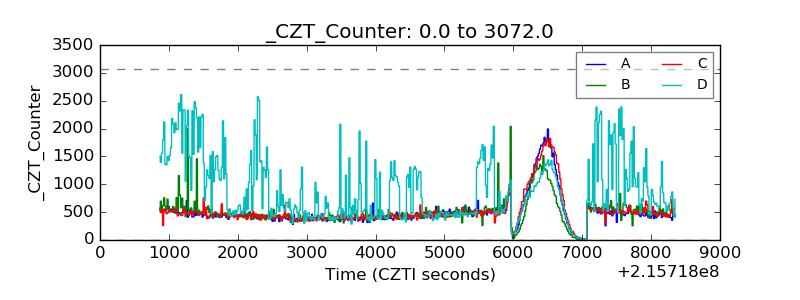 |
| +2.5 Volts monitor | 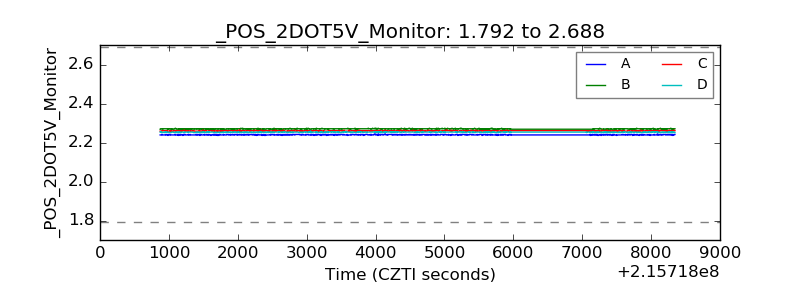 |
| +5 Volts monitor | 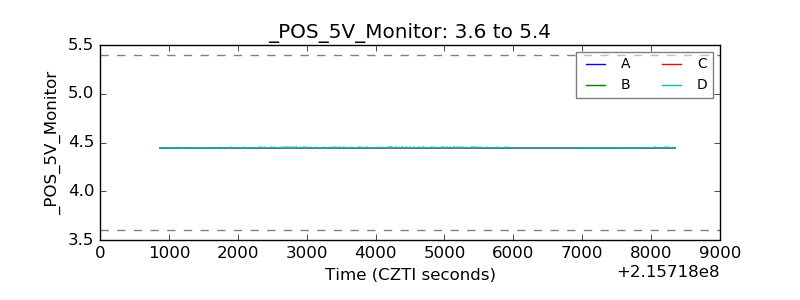 |
| _ROLL_ROT | 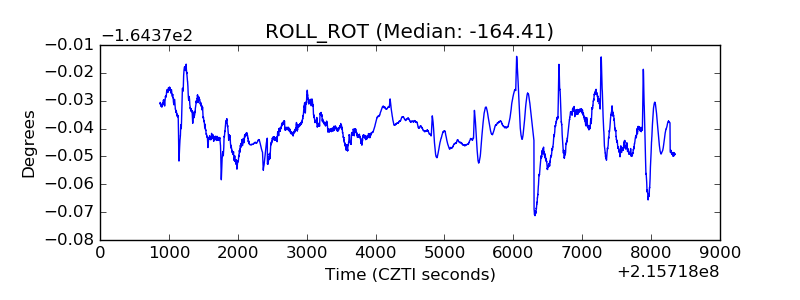 |
| _Roll_DEC | 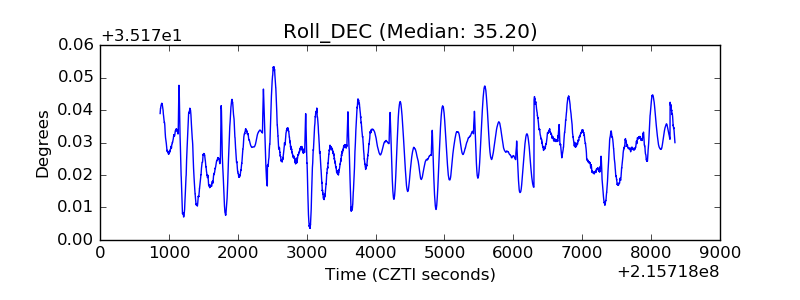 |
| _Roll_RA | 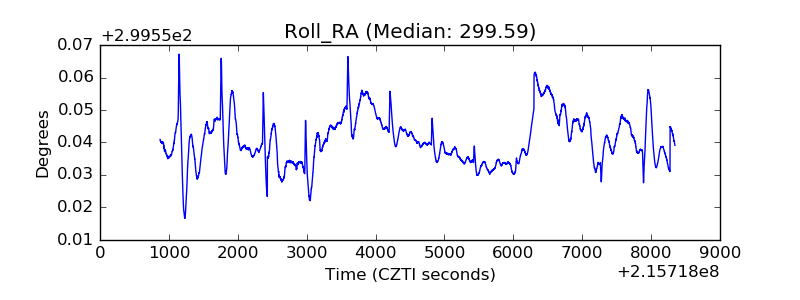 |
| Veto Counter | 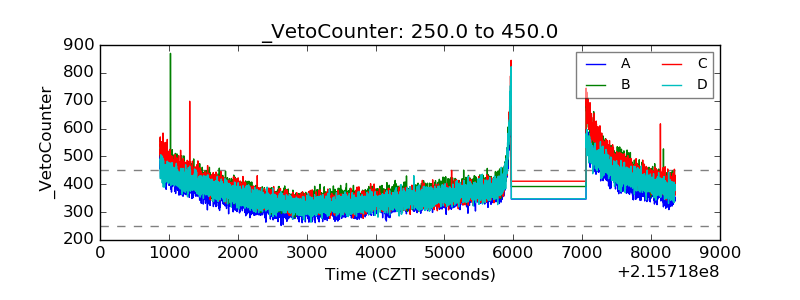 |