| Param | Original file | Final file |
|---|---|---|
| Filename | modeM0/AS1G06_028T01_9000000768_05933cztM0_level2.evt | modeM0/AS1G06_028T01_9000000768_05933cztM0_level2_quad_clean.evt |
| Size (bytes) | 490,227,840 | 77,754,240 |
| Size | 467.5 MB | 74.2 MB |
| Events in quadrant A | 3,165,067 | 483,470 |
| Events in quadrant B | 3,661,842 | 487,965 |
| Events in quadrant C | 3,141,872 | 477,520 |
| Events in quadrant D | 4,426,155 | 441,477 |
| Mode M0 | |||
|---|---|---|---|
| Quadrant | BADHDUFLAG | Total packets | Discarded packets |
| A | 0 | 13738 | 3 |
| B | 0 | 15138 | 2 |
| C | 0 | 13691 | 2 |
| D | 0 | 17694 | 2 |
| Mode M9 | |||
|---|---|---|---|
| Quadrant | BADHDUFLAG | Total packets | Discarded packets |
| A | 0 | 17 | 0 |
| B | 0 | 17 | 0 |
| C | 0 | 17 | 0 |
| D | 0 | 18 | 0 |
| Mode SS | |||
|---|---|---|---|
| Quadrant | BADHDUFLAG | Total packets | Discarded packets |
| A | 0 | 136 | 0 |
| B | 0 | 136 | 0 |
| C | 0 | 136 | 0 |
| D | 0 | 136 | 0 |
| Quadrant | Total seconds | Saturated seconds | Saturation percentage |
|---|---|---|---|
| A | 6651 | 26 | 0.390919% |
| B | 6651 | 57 | 0.857014% |
| C | 6651 | 21 | 0.315742% |
| D | 6651 | 197 | 2.961961% |
Noise dominated data is calculated using 1-second bins in cleaned event files. If a bin has >2000 counts, and if more than 50% of those come from <1% of pixels, then it is considered to be noise-dominated and hence unusable.
| Quadrant | # 1 sec bins | Bins with >0 counts | Bins with >2000 counts | High rate bins dominated by noise | Noise dominated (total time) | Noise dominated (detector-on time) | Marked lightcurve |
|---|---|---|---|---|---|---|---|
| A | 7911 | 6652 | 3 | 3 | 0.04% | 0.05% | 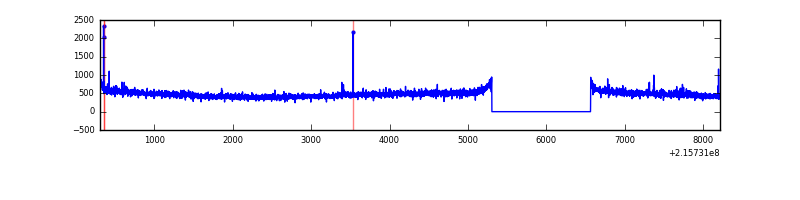 |
| B | 7911 | 6652 | 12 | 12 | 0.15% | 0.18% | 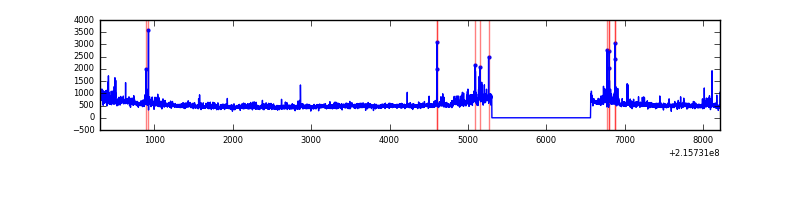 |
| C | 7911 | 6652 | 1 | 1 | 0.01% | 0.02% | 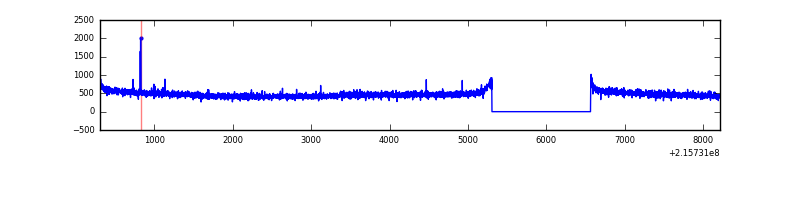 |
| D | 7911 | 6652 | 130 | 130 | 1.64% | 1.95% | 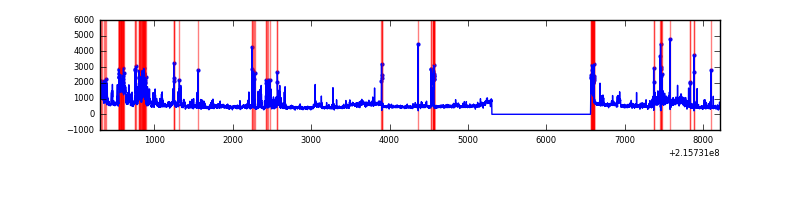 |
Top three noisy pixels from each quadrant. If the there are fewer than three noisy pixels in the level2.evt file, extra rows are filled as -1
| Pixel properties | Quadrant properties | ||||||
|---|---|---|---|---|---|---|---|
| Quadrant | DetID | PixID | Counts | Sigma | Mean | Median | Sigma |
| A | 15 | 234 | 36795 | 219.22 | 811 | 795 | 164.2 |
| A | 12 | 194 | 7769 | 42.47 | 811 | 795 | 164.2 |
| A | 0 | 226 | 7757 | 42.4 | 811 | 795 | 164.2 |
| B | 15 | 204 | 290161 | 1850.13 | 825 | 808 | 156.4 |
| B | 4 | 80 | 39306 | 246.16 | 825 | 808 | 156.4 |
| B | 15 | 255 | 35111 | 219.33 | 825 | 808 | 156.4 |
| C | 9 | 68 | 20393 | 106.53 | 797 | 805 | 183.9 |
| C | 1 | 16 | 10527 | 52.87 | 797 | 805 | 183.9 |
| C | 13 | 61 | 6206 | 29.37 | 797 | 805 | 183.9 |
| D | 2 | 63 | 715632 | 3754.58 | 780 | 759 | 190.4 |
| D | 1 | 20 | 337711 | 1769.71 | 780 | 759 | 190.4 |
| D | 2 | 152 | 284339 | 1489.39 | 780 | 759 | 190.4 |
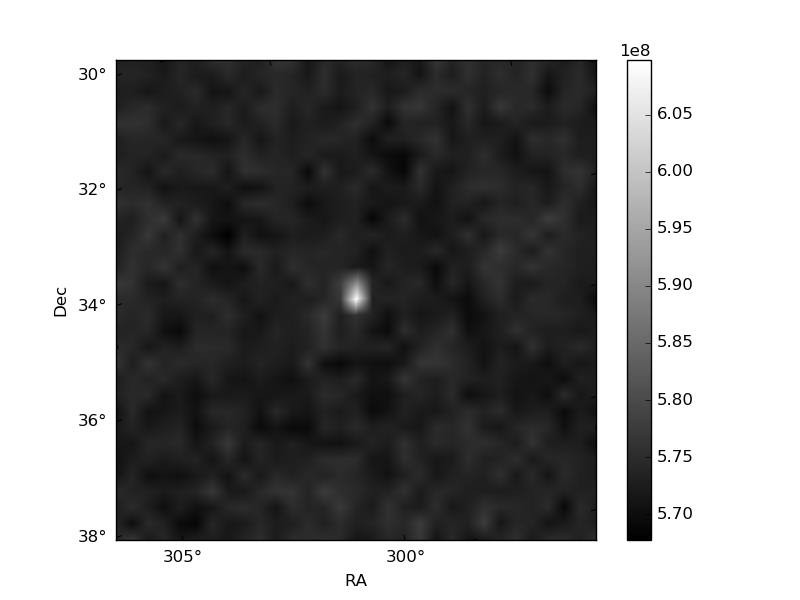
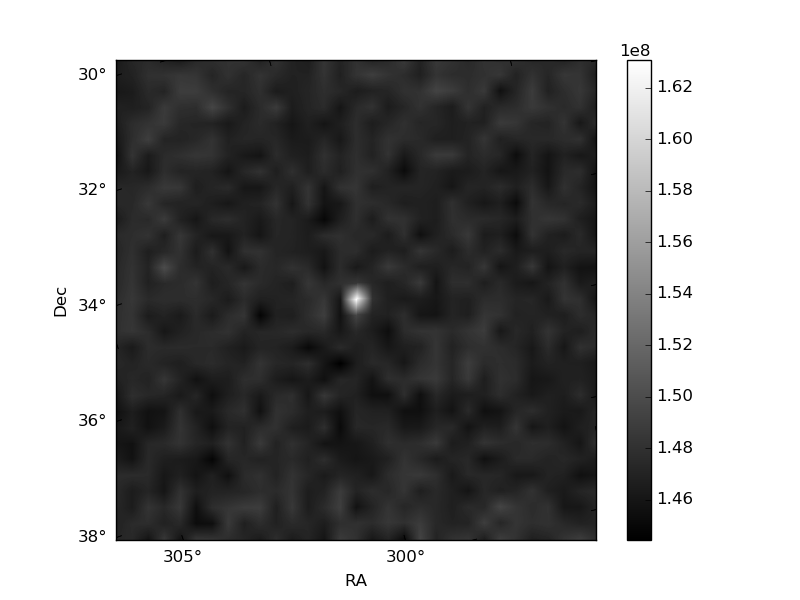
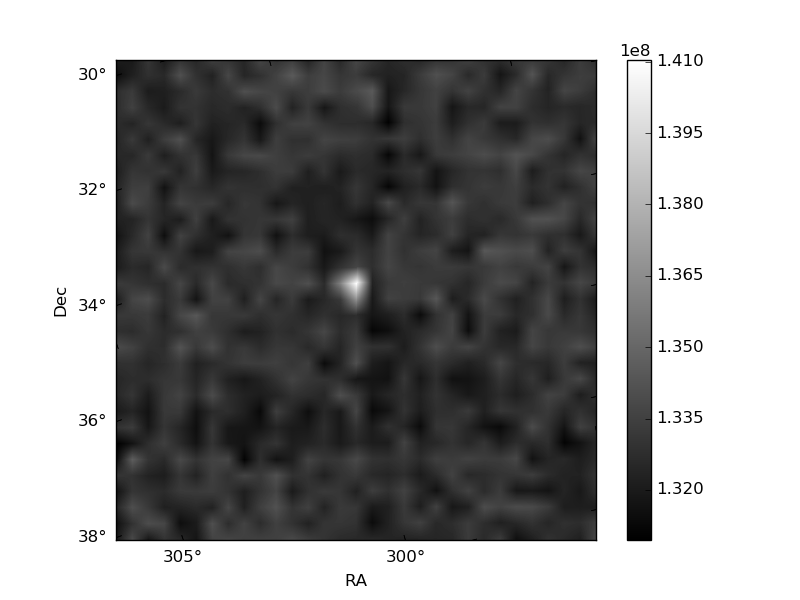
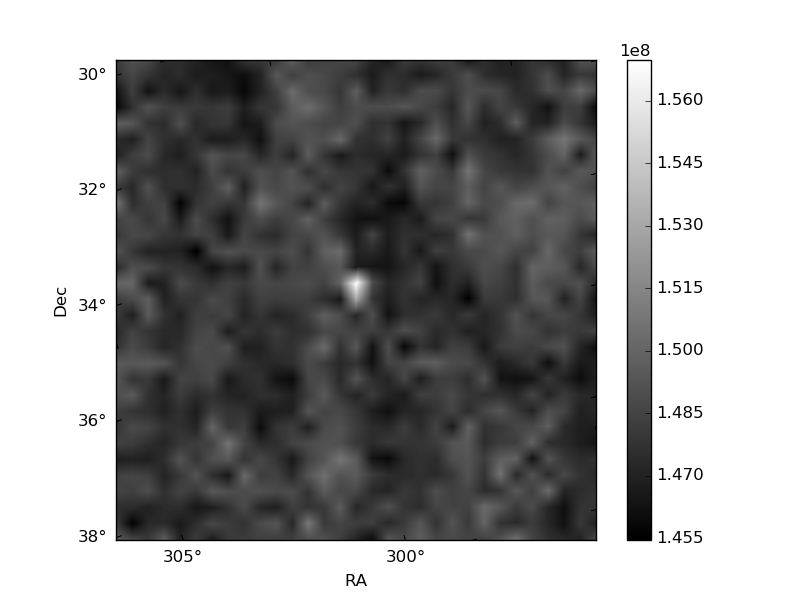
Histogram calculated using DETX and DETY for each event in the final _common_clean file
| Quadrant A | 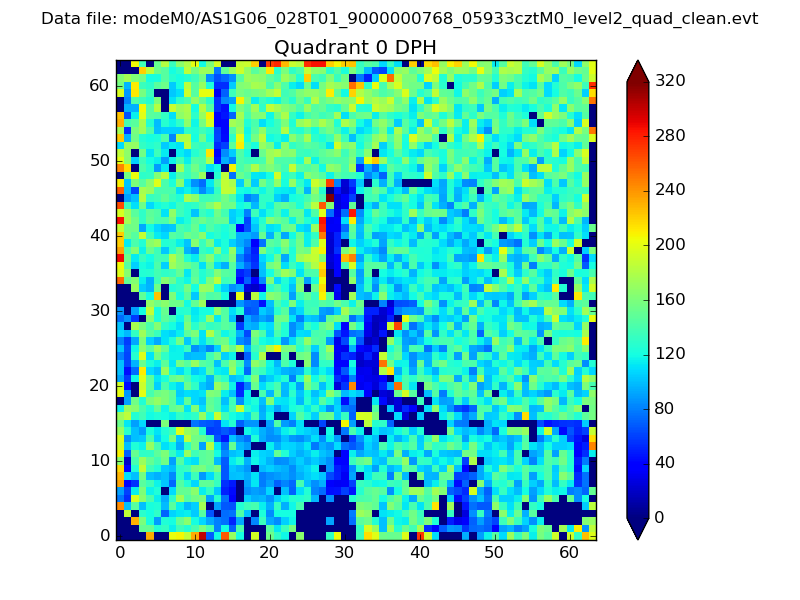 |
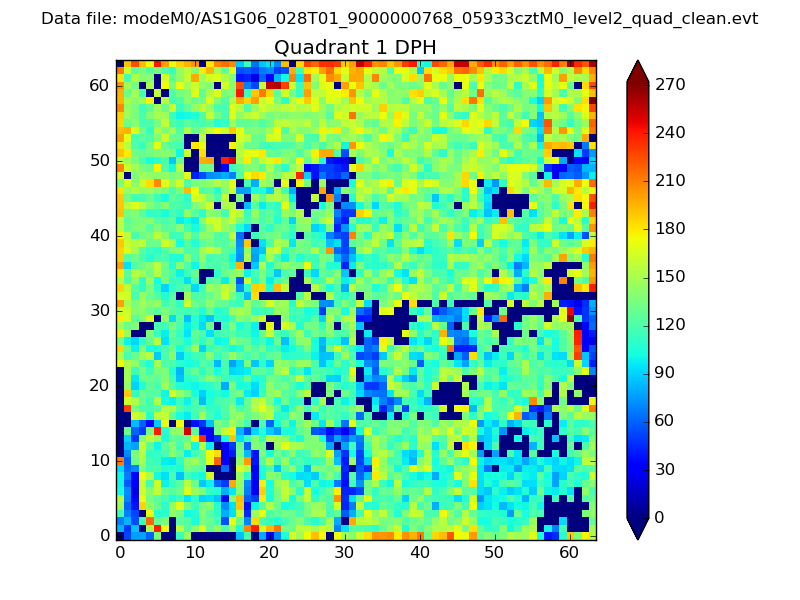 |
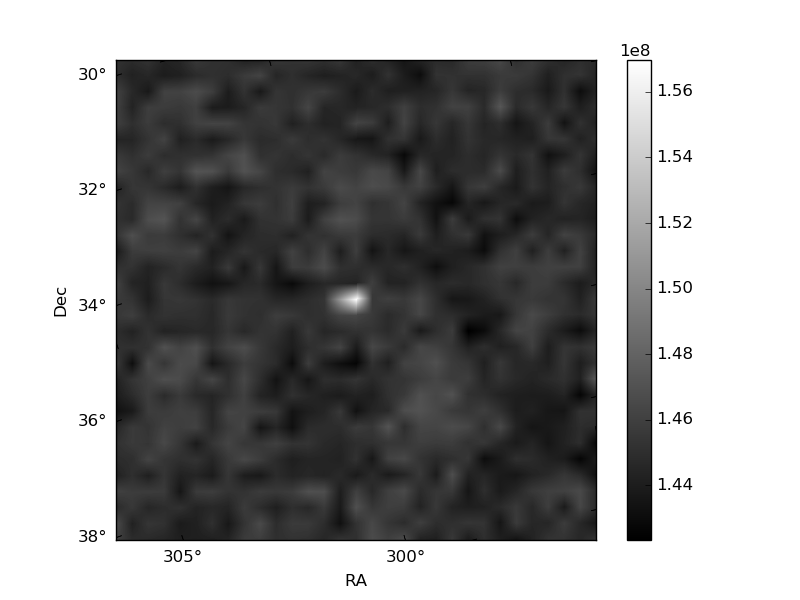
Quadrant B |
|---|---|---|---|
| Quadrant D | 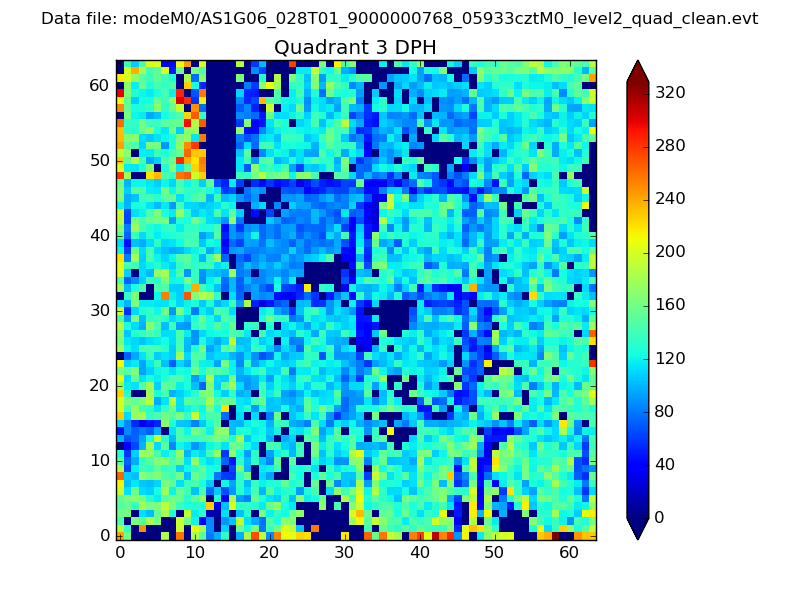 |
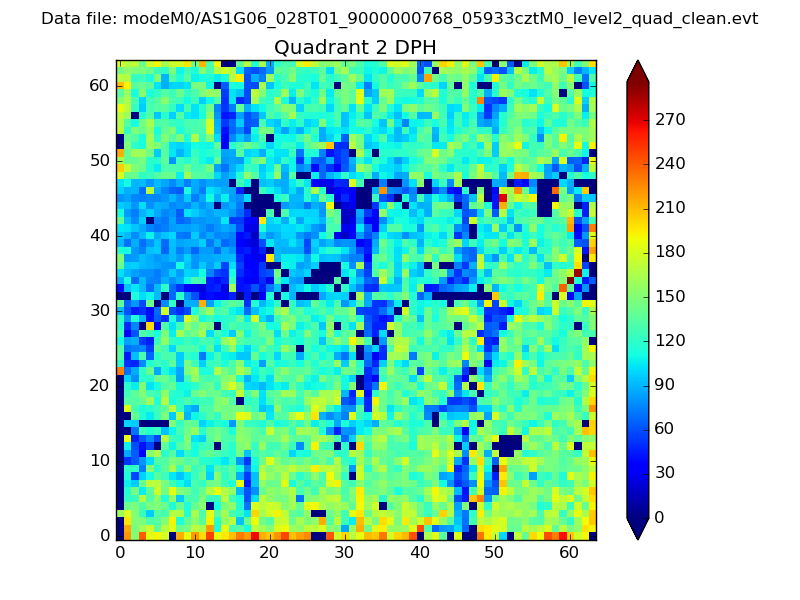 |
Quadrant C |
| Plot type | Count rate plots | Images |
|---|---|---|
| Comparison with Poisson distribution Blue bars denote a histogram of data divided into 1 sec bins. Red curve is a Poisson curve with rate = median count rate of data. |
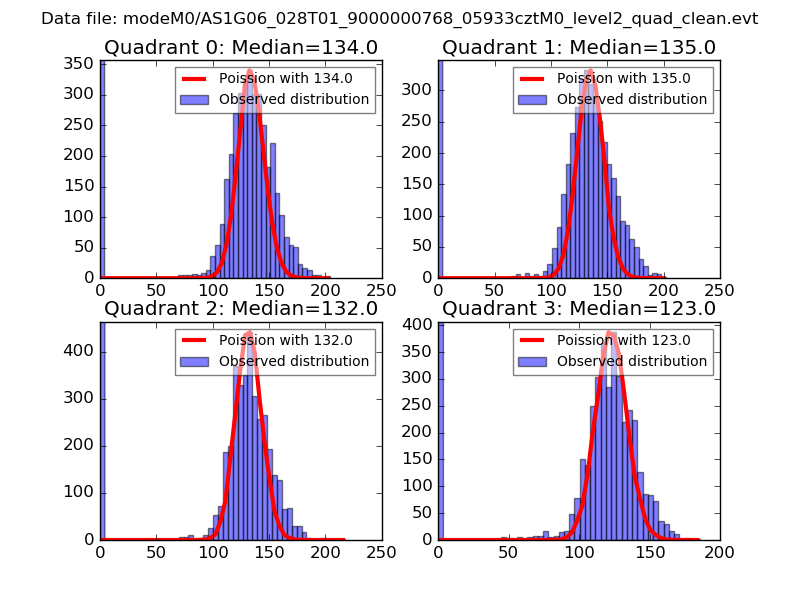 |
 |
| Quadrant-wise count rates Data is divided into 100 sec bins |
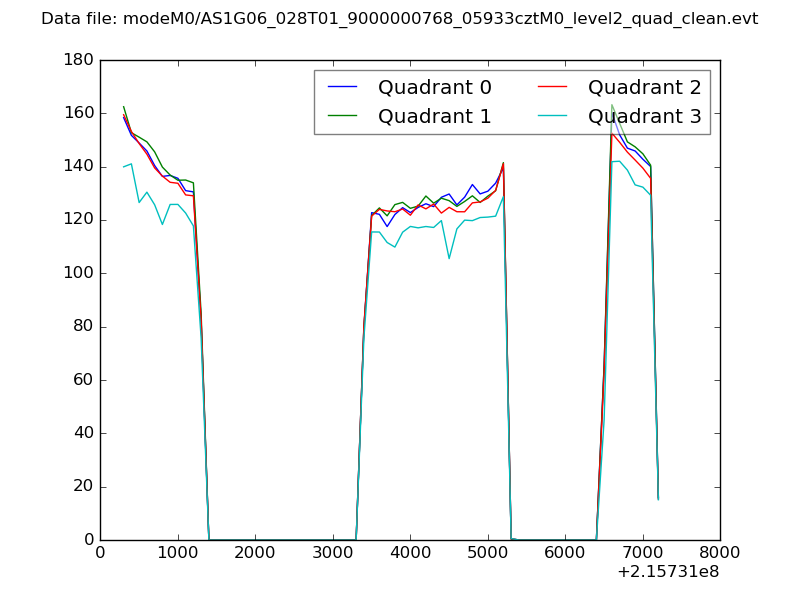 |
|
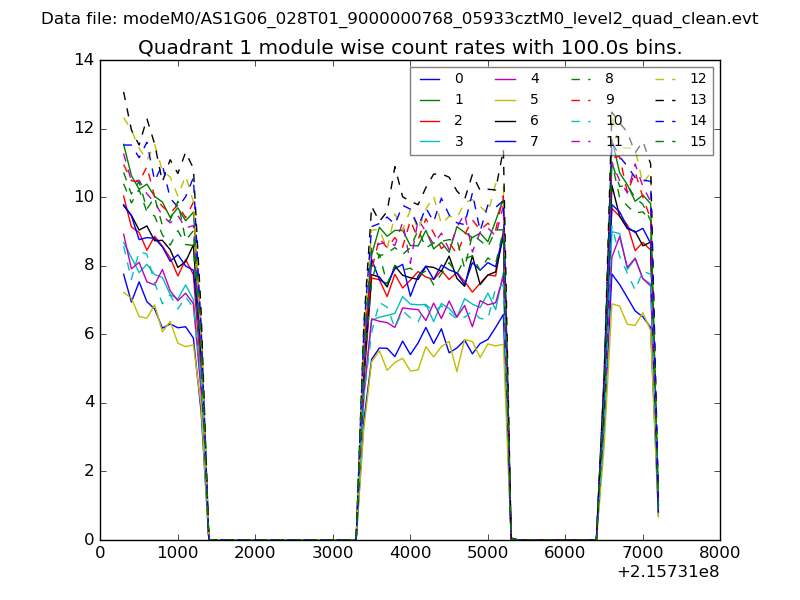
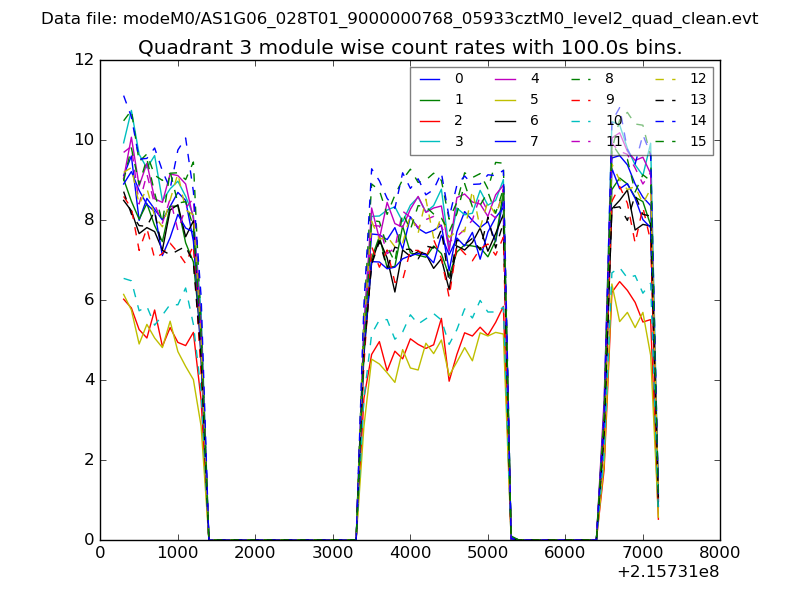
| Module-wise count rates for Quadrant A Data is divided into 100 sec bins |
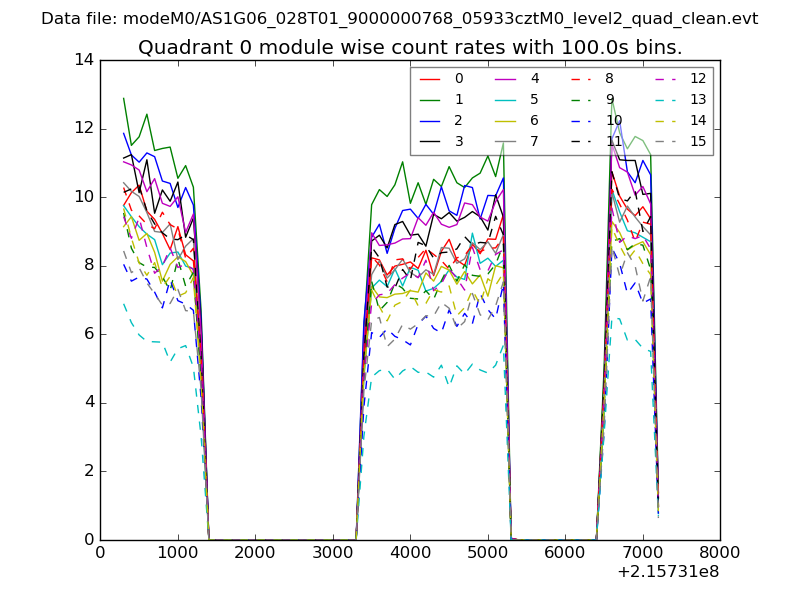 |
 |
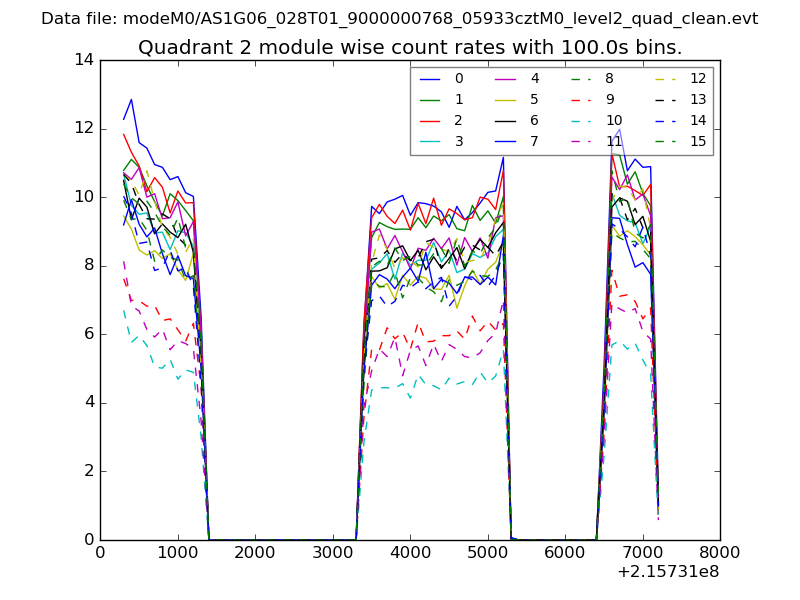
| Module-wise count rates for Quadrant B Data is divided into 100 sec bins |
 |
 |
| Module-wise count rates for Quadrant C Data is divided into 100 sec bins |
 |
 |
| Module-wise count rates for Quadrant D Data is divided into 100 sec bins |
 |
 |
| Parameter | Plot |
|---|---|
| CZT HV Monitor | 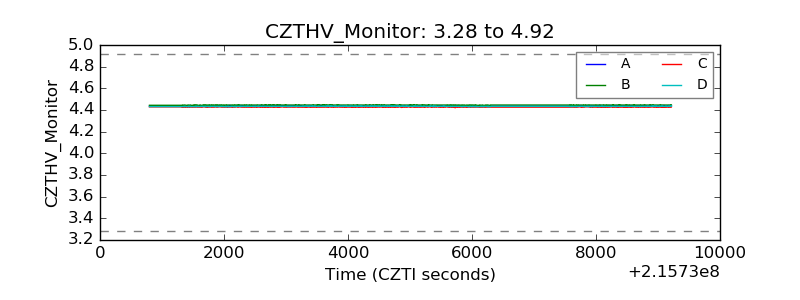 |
| D_VDD | 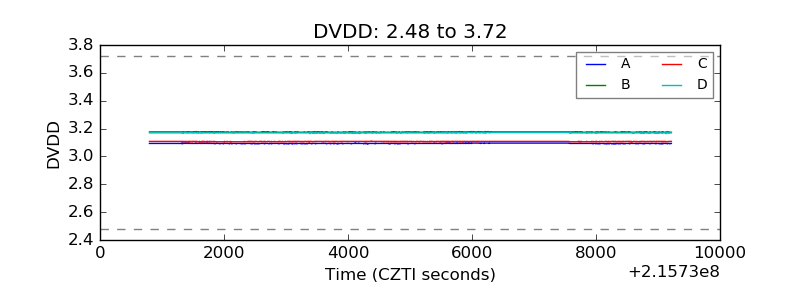 |
| Temperature 1 | 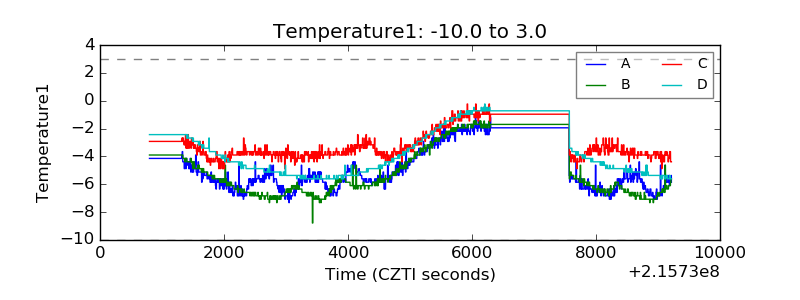 |
| Veto HV Monitor | 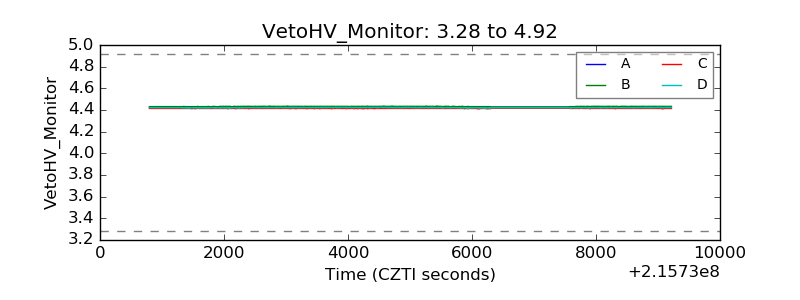 |
| Veto LLD | 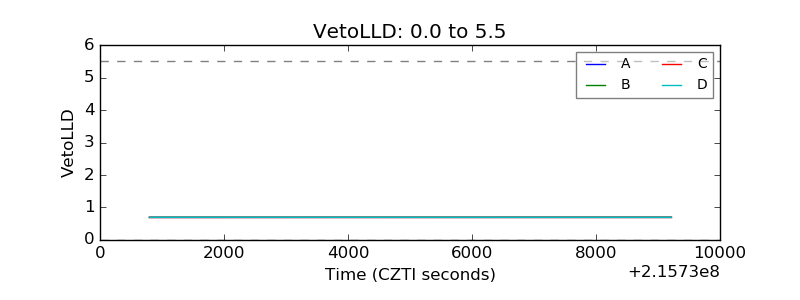 |
| Alpha Counter | 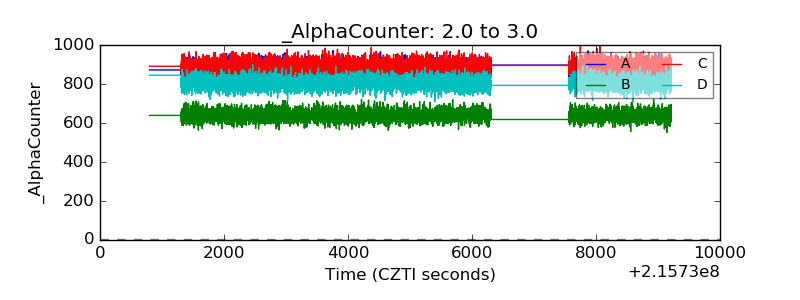 |
| _CPM_Rate | 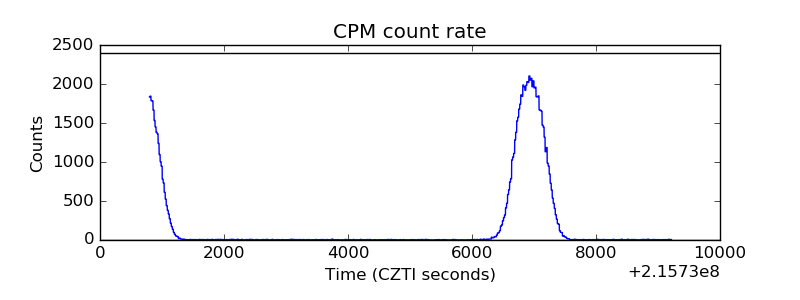 |
| CZT Counter | 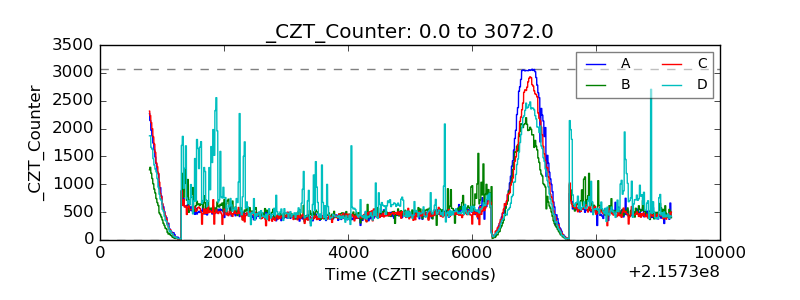 |
| +2.5 Volts monitor | 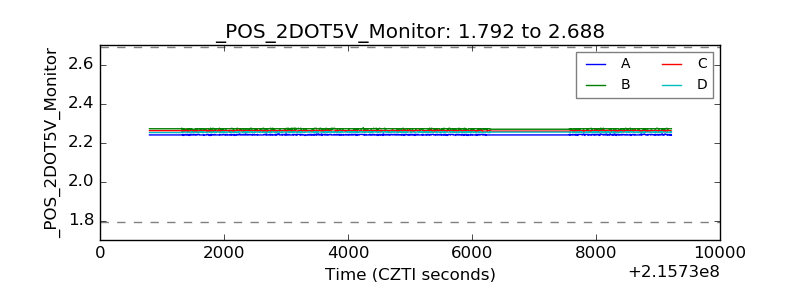 |
| +5 Volts monitor |  |
| _ROLL_ROT | 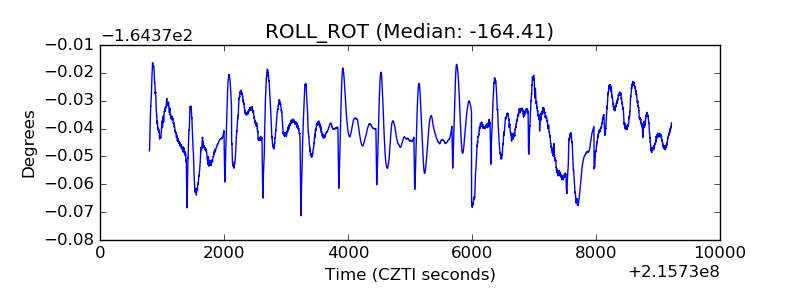 |
| _Roll_DEC | 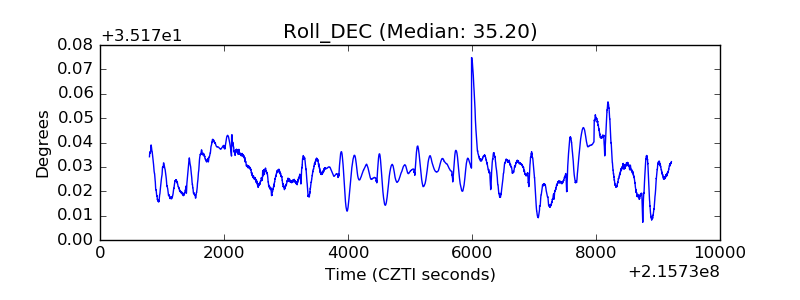 |
| _Roll_RA | 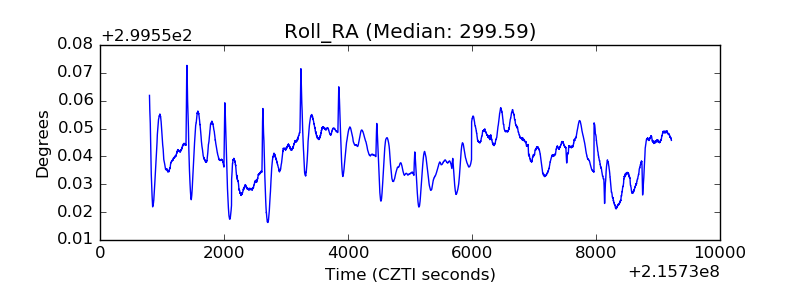 |
| Veto Counter | 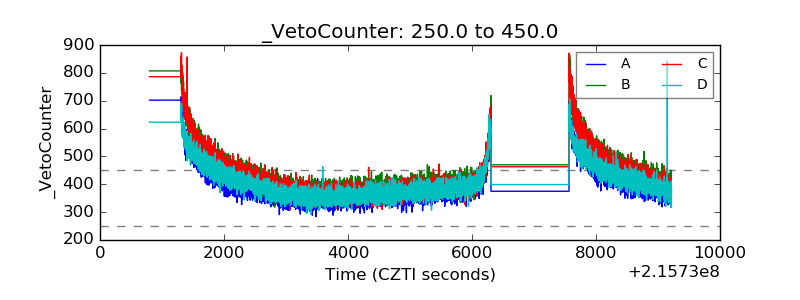 |