| Param | Original file | Final file |
|---|---|---|
| Filename | modeM0/AS1G06_028T01_9000000768_05934cztM0_level2.evt | modeM0/AS1G06_028T01_9000000768_05934cztM0_level2_quad_clean.evt |
| Size (bytes) | 486,673,920 | 68,722,560 |
| Size | 464.1 MB | 65.5 MB |
| Events in quadrant A | 3,471,173 | 411,763 |
| Events in quadrant B | 3,906,806 | 411,281 |
| Events in quadrant C | 3,101,981 | 413,860 |
| Events in quadrant D | 3,810,993 | 383,755 |
| Mode M0 | |||
|---|---|---|---|
| Quadrant | BADHDUFLAG | Total packets | Discarded packets |
| A | 0 | 14584 | 3 |
| B | 0 | 15866 | 2 |
| C | 0 | 13552 | 2 |
| D | 0 | 15759 | 2 |
| Mode M9 | |||
|---|---|---|---|
| Quadrant | BADHDUFLAG | Total packets | Discarded packets |
| A | 0 | 20 | 0 |
| B | 0 | 20 | 0 |
| C | 0 | 20 | 0 |
| D | 0 | 21 | 0 |
| Mode SS | |||
|---|---|---|---|
| Quadrant | BADHDUFLAG | Total packets | Discarded packets |
| A | 0 | 134 | 0 |
| B | 0 | 134 | 0 |
| C | 0 | 134 | 0 |
| D | 0 | 134 | 0 |
| Quadrant | Total seconds | Saturated seconds | Saturation percentage |
|---|---|---|---|
| A | 6596 | 134 | 2.031534% |
| B | 6596 | 150 | 2.274106% |
| C | 6596 | 28 | 0.424500% |
| D | 6596 | 168 | 2.546998% |
Noise dominated data is calculated using 1-second bins in cleaned event files. If a bin has >2000 counts, and if more than 50% of those come from <1% of pixels, then it is considered to be noise-dominated and hence unusable.
| Quadrant | # 1 sec bins | Bins with >0 counts | Bins with >2000 counts | High rate bins dominated by noise | Noise dominated (total time) | Noise dominated (detector-on time) | Marked lightcurve |
|---|---|---|---|---|---|---|---|
| A | 7876 | 6597 | 81 | 81 | 1.03% | 1.23% | 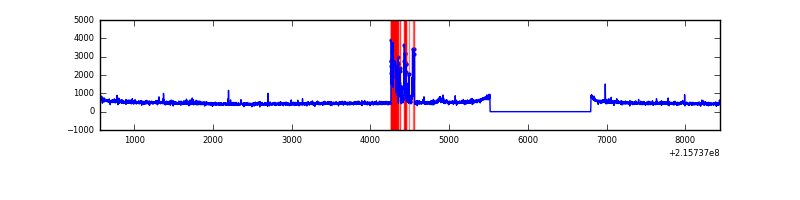 |
| B | 7876 | 6596 | 86 | 86 | 1.09% | 1.30% | 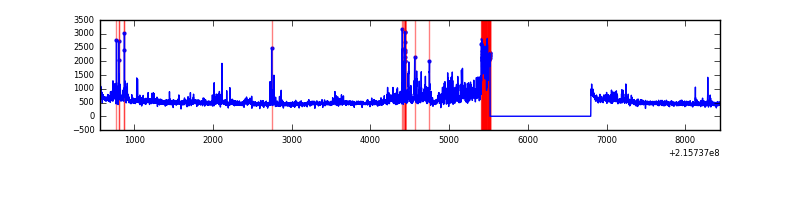 |
| C | 7876 | 6597 | 0 | 0 | 0.00% | 0.00% | 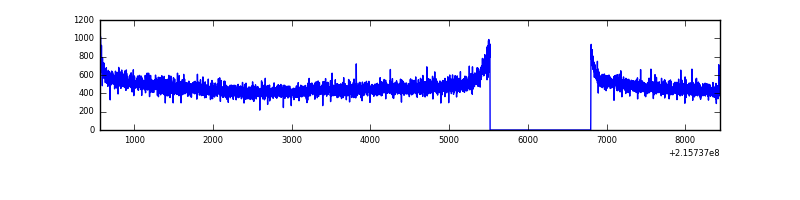 |
| D | 7876 | 6597 | 99 | 99 | 1.26% | 1.50% | 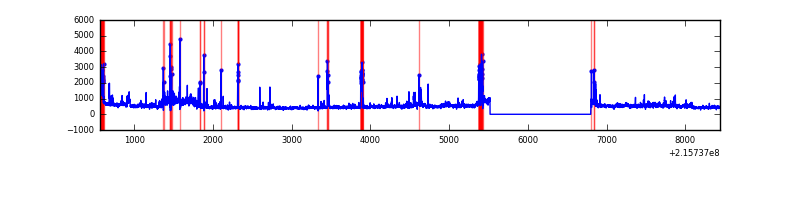 |
Top three noisy pixels from each quadrant. If the there are fewer than three noisy pixels in the level2.evt file, extra rows are filled as -1
| Pixel properties | Quadrant properties | ||||||
|---|---|---|---|---|---|---|---|
| Quadrant | DetID | PixID | Counts | Sigma | Mean | Median | Sigma |
| A | 15 | 234 | 346319 | 2117.04 | 804 | 789 | 163.2 |
| A | 7 | 16 | 20813 | 122.69 | 804 | 789 | 163.2 |
| A | 12 | 194 | 7859 | 43.32 | 804 | 789 | 163.2 |
| B | 15 | 204 | 348606 | 2258.58 | 811 | 794 | 154.0 |
| B | 15 | 255 | 219815 | 1422.25 | 811 | 794 | 154.0 |
| B | 0 | 229 | 55923 | 357.99 | 811 | 794 | 154.0 |
| C | 13 | 61 | 6357 | 30.4 | 794 | 801 | 182.8 |
| C | 1 | 16 | 2547 | 9.55 | 794 | 801 | 182.8 |
| C | 3 | 202 | 1996 | 6.54 | 794 | 801 | 182.8 |
| D | 2 | 63 | 629071 | 3280.29 | 776 | 753 | 191.5 |
| D | 8 | 195 | 126447 | 656.22 | 776 | 753 | 191.5 |
| D | 2 | 152 | 50104 | 257.65 | 776 | 753 | 191.5 |
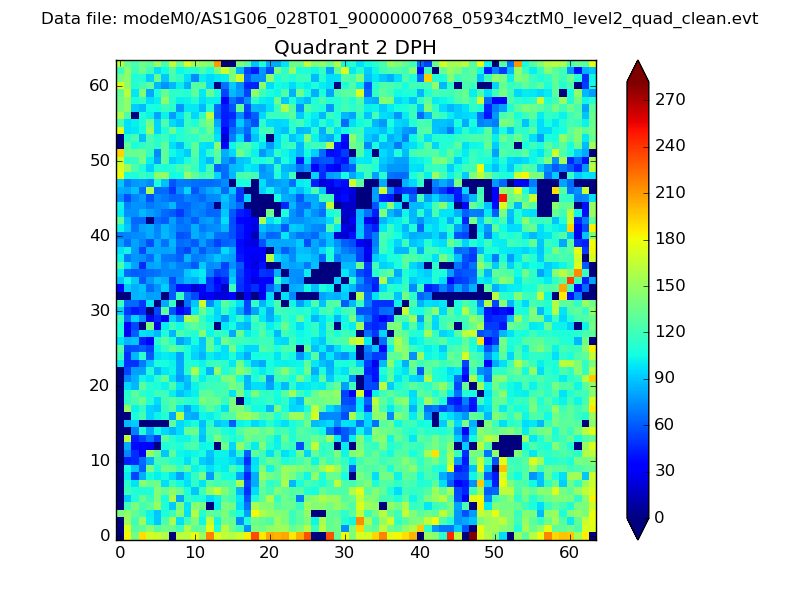
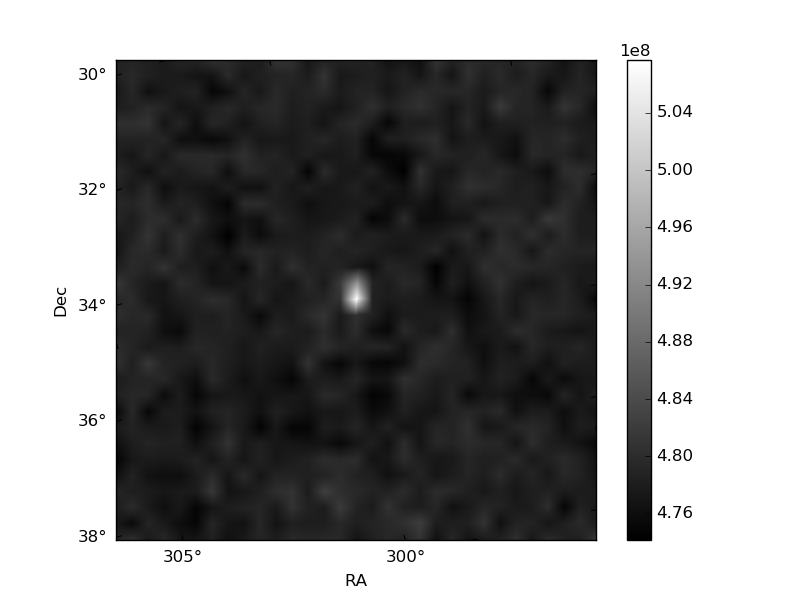
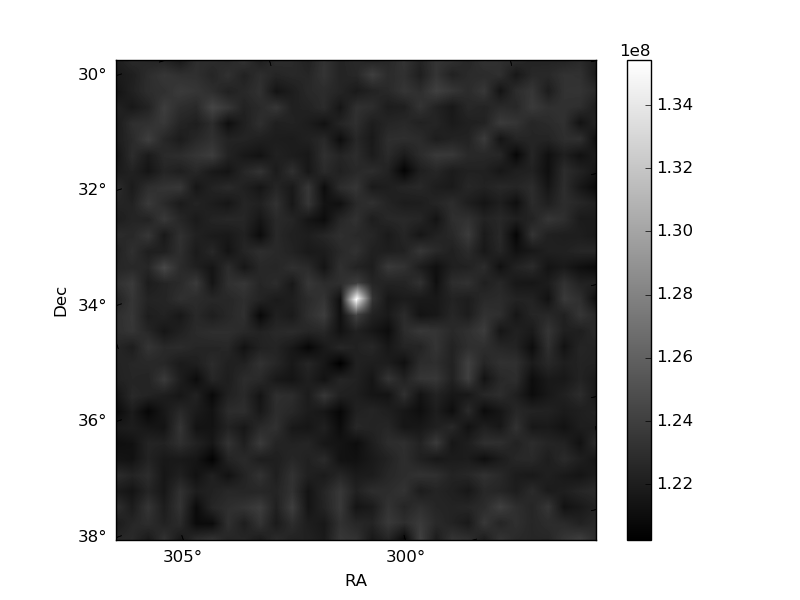
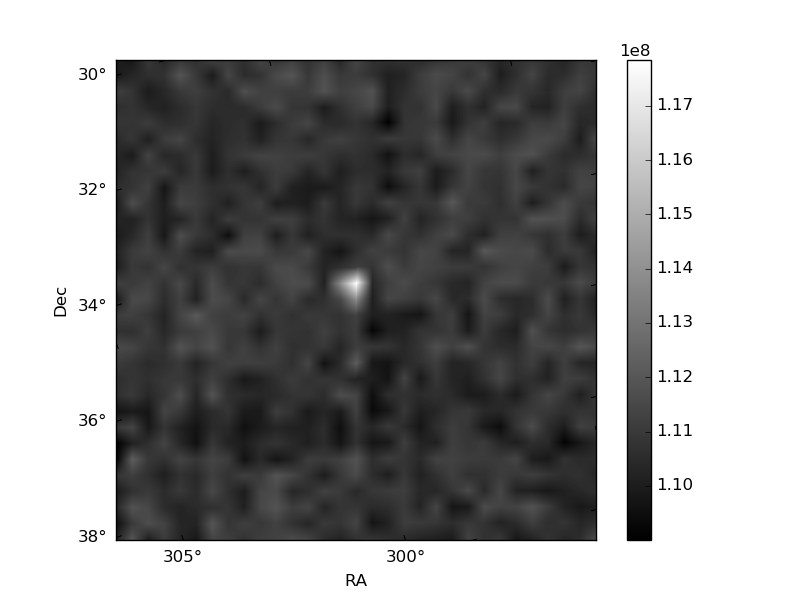
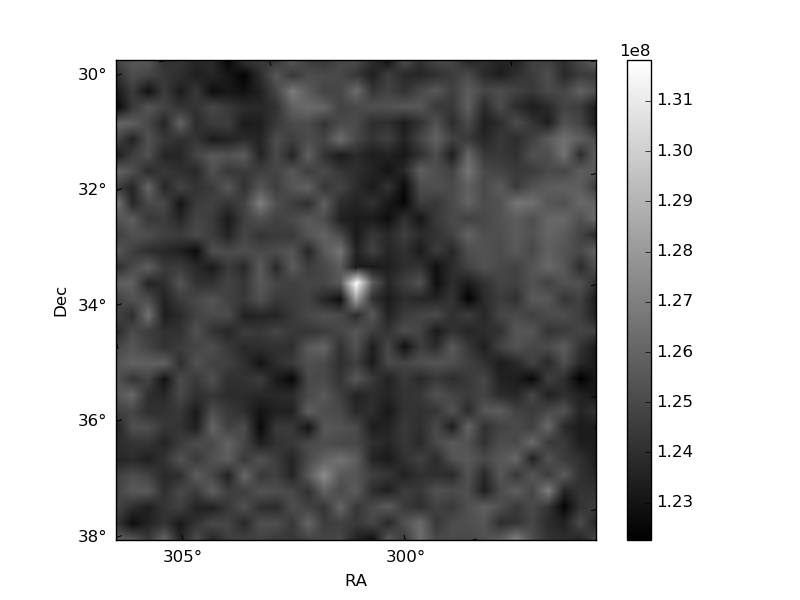
Histogram calculated using DETX and DETY for each event in the final _common_clean file
| Quadrant A | 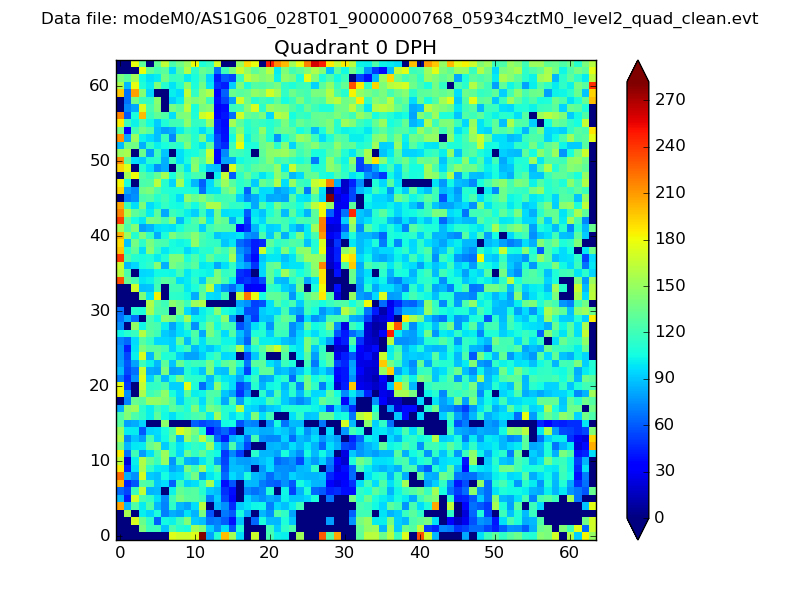 |
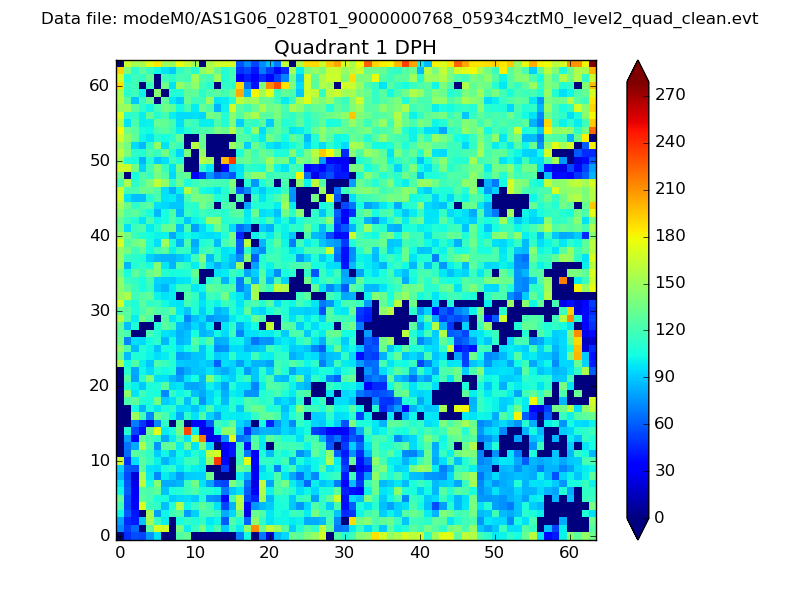 |
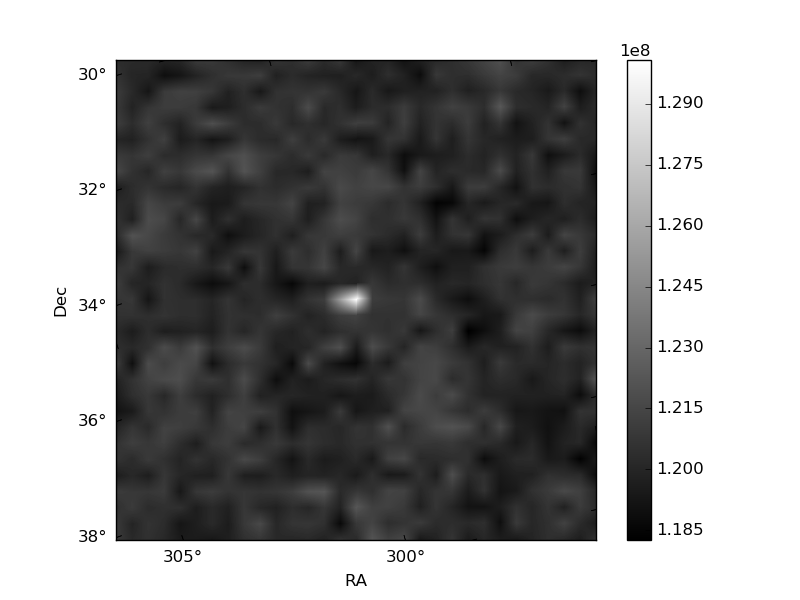
Quadrant B |
|---|---|---|---|
| Quadrant D | 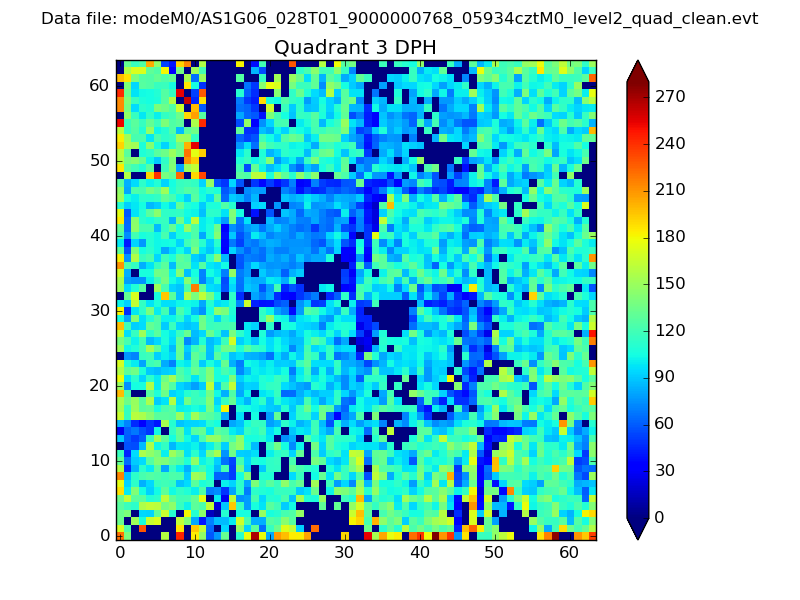 |
 |
Quadrant C |
| Plot type | Count rate plots | Images |
|---|---|---|
| Comparison with Poisson distribution Blue bars denote a histogram of data divided into 1 sec bins. Red curve is a Poisson curve with rate = median count rate of data. |
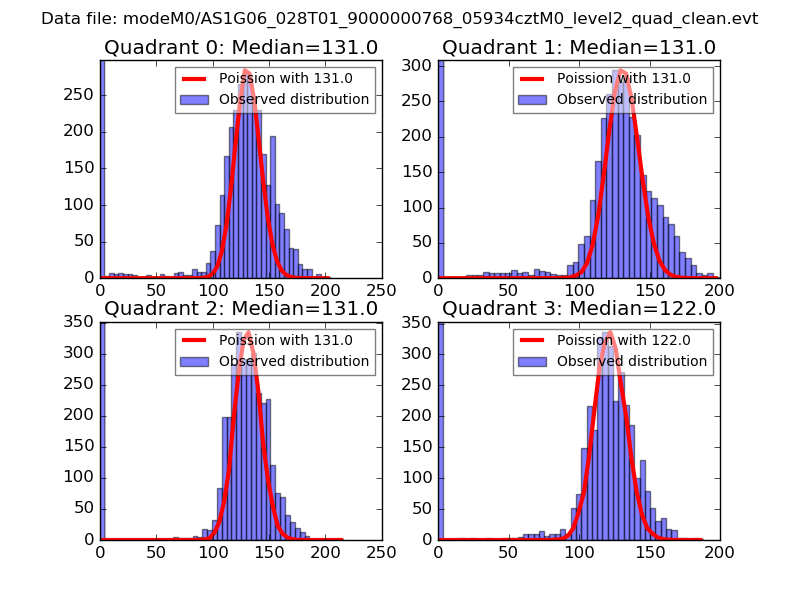 |
 |
| Quadrant-wise count rates Data is divided into 100 sec bins |
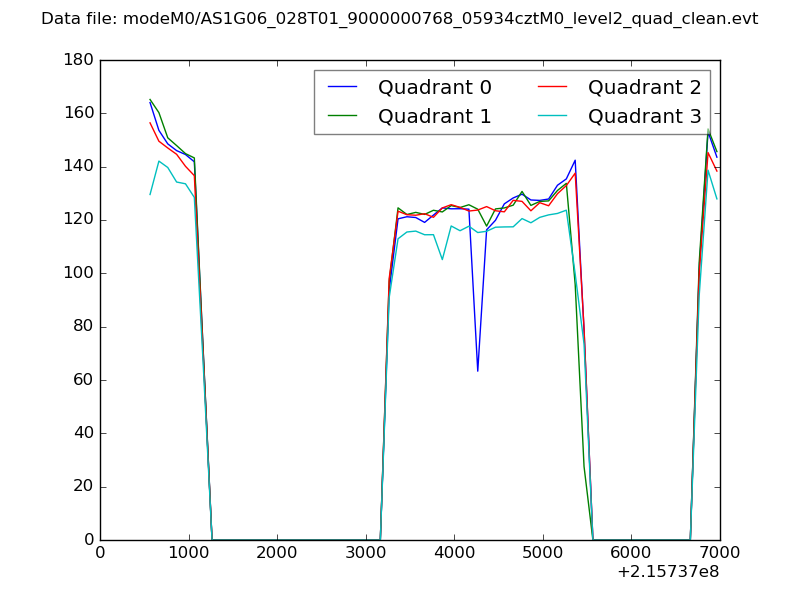 |
|
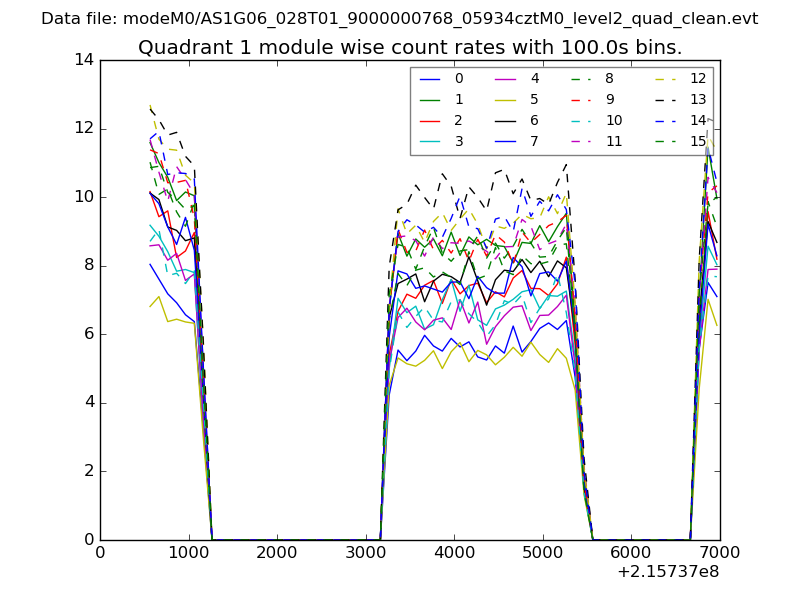
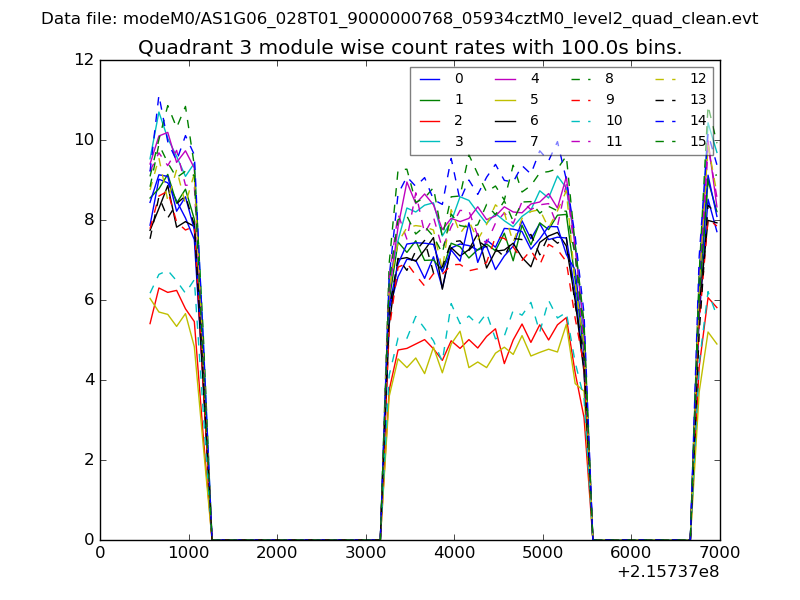
| Module-wise count rates for Quadrant A Data is divided into 100 sec bins |
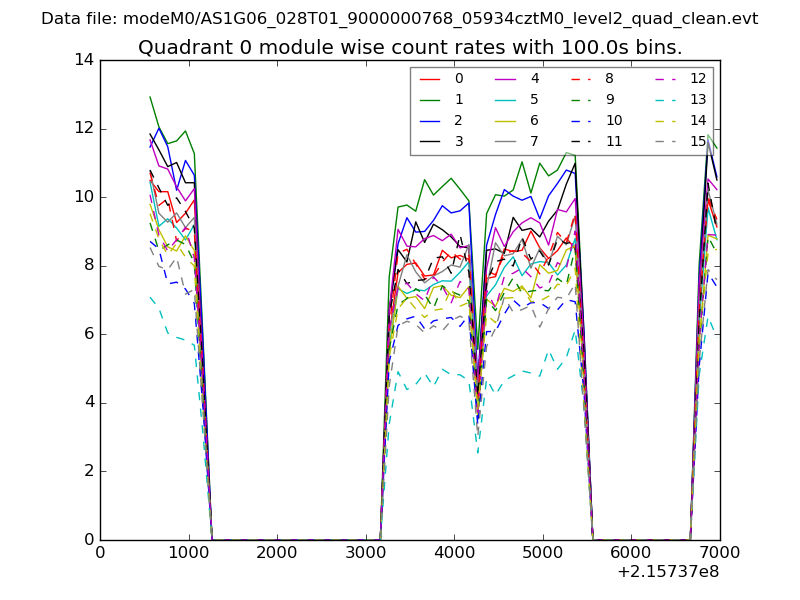 |
 |
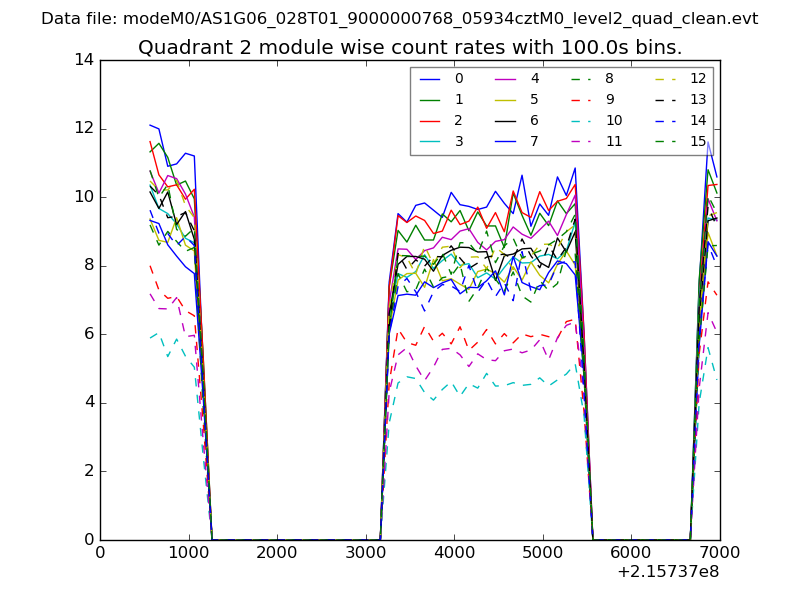
| Module-wise count rates for Quadrant B Data is divided into 100 sec bins |
 |
 |
| Module-wise count rates for Quadrant C Data is divided into 100 sec bins |
 |
 |
| Module-wise count rates for Quadrant D Data is divided into 100 sec bins |
 |
 |
| Parameter | Plot |
|---|---|
| CZT HV Monitor | 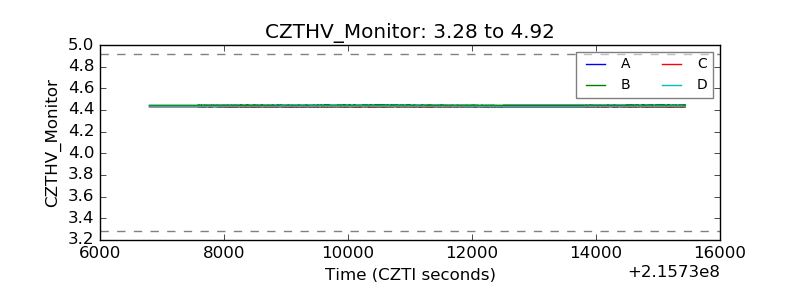 |
| D_VDD | 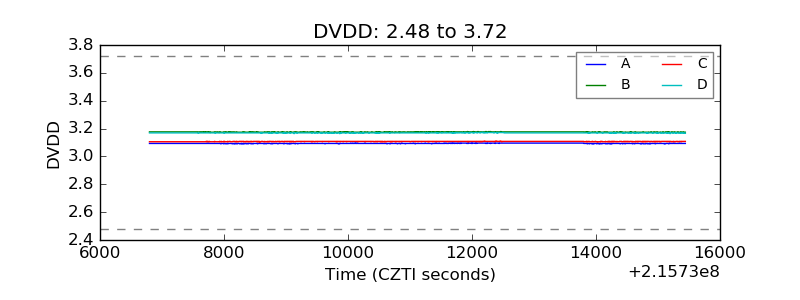 |
| Temperature 1 | 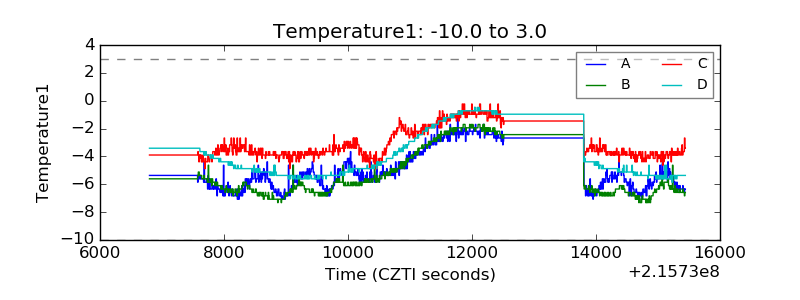 |
| Veto HV Monitor | 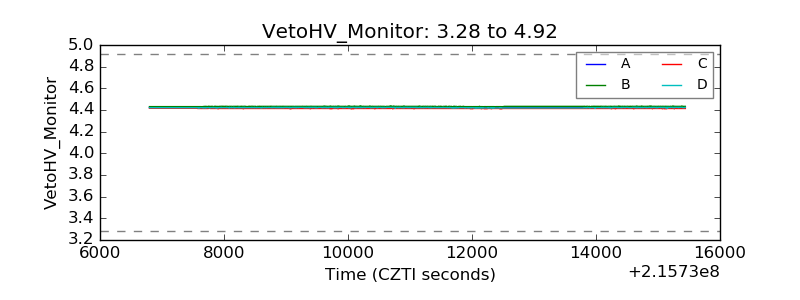 |
| Veto LLD | 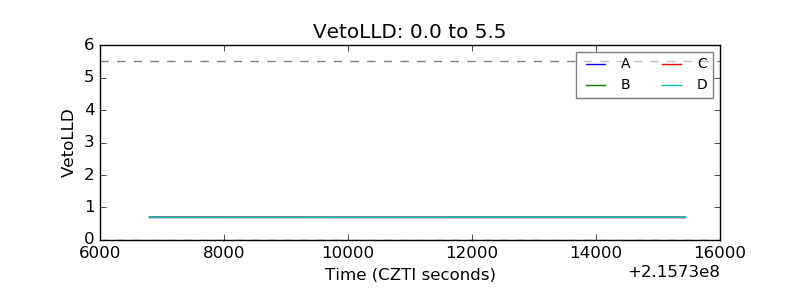 |
| Alpha Counter | 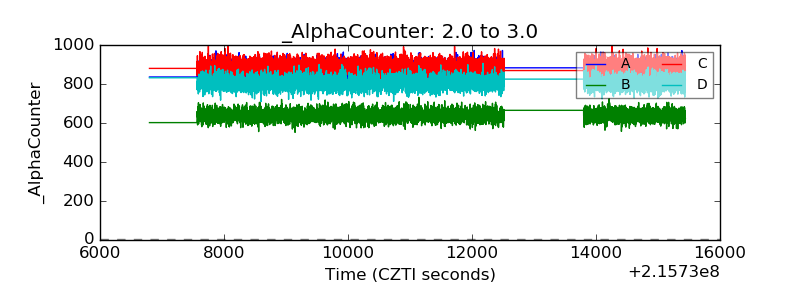 |
| _CPM_Rate | 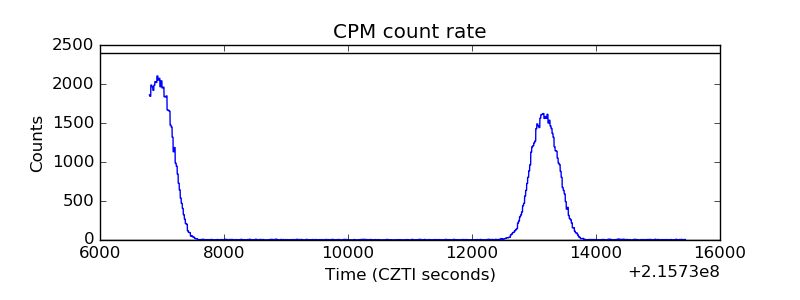 |
| CZT Counter | 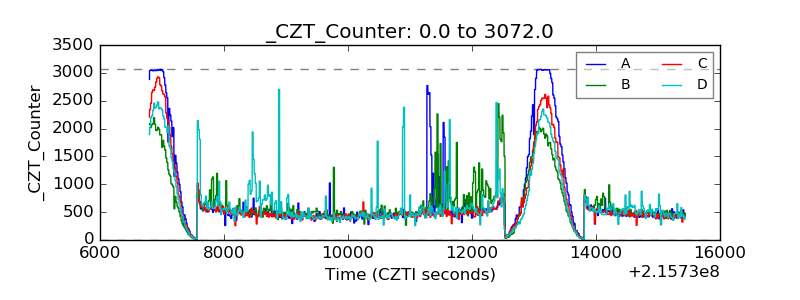 |
| +2.5 Volts monitor | 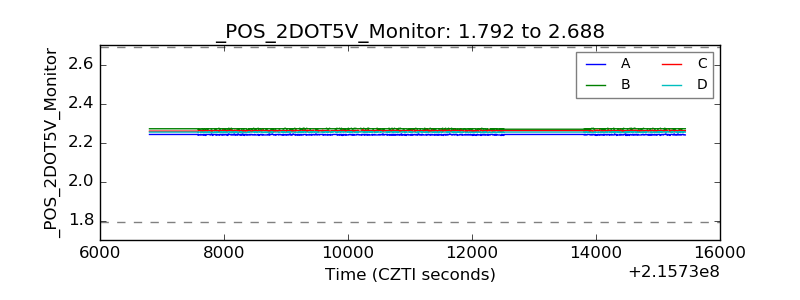 |
| +5 Volts monitor | 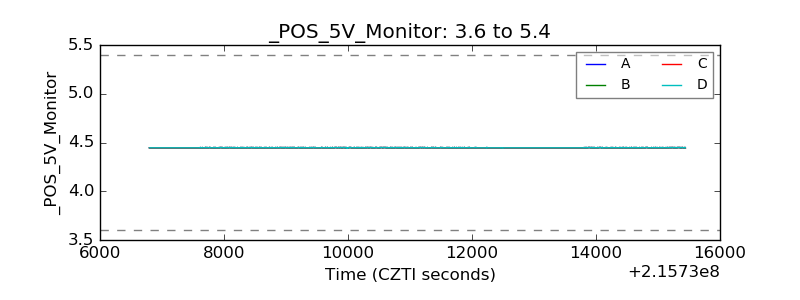 |
| _ROLL_ROT | 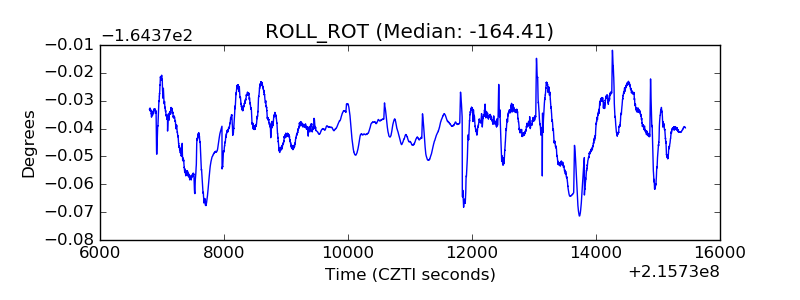 |
| _Roll_DEC | 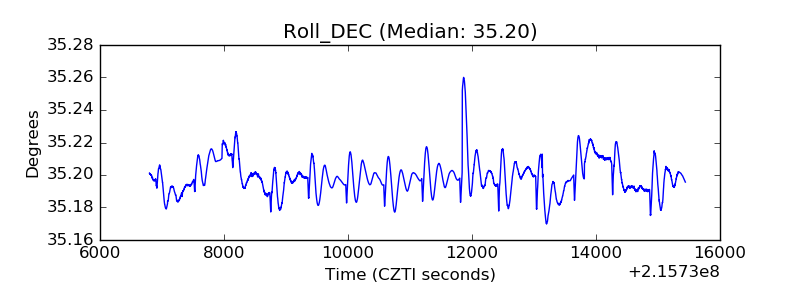 |
| _Roll_RA | 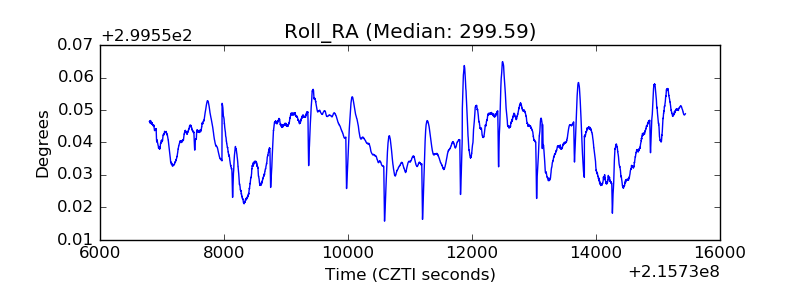 |
| Veto Counter | 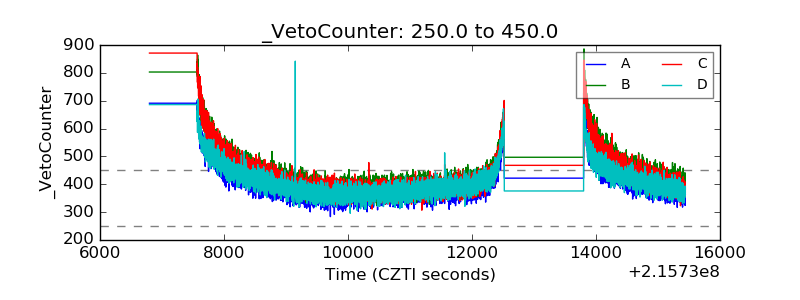 |