| Param | Original file | Final file |
|---|---|---|
| Filename | modeM0/AS1G06_028T01_9000000768_05935cztM0_level2.evt | modeM0/AS1G06_028T01_9000000768_05935cztM0_level2_quad_clean.evt |
| Size (bytes) | 161,115,840 | 15,765,120 |
| Size | 153.7 MB | 15.0 MB |
| Events in quadrant A | 1,123,287 | 73,331 |
| Events in quadrant B | 1,183,354 | 76,038 |
| Events in quadrant C | 1,114,967 | 74,711 |
| Events in quadrant D | 1,283,000 | 70,437 |
| Mode M0 | |||
|---|---|---|---|
| Quadrant | BADHDUFLAG | Total packets | Discarded packets |
| A | 0 | 5087 | 0 |
| B | 0 | 5161 | 0 |
| C | 0 | 5082 | 0 |
| D | 0 | 5438 | 0 |
| Mode SS | |||
|---|---|---|---|
| Quadrant | BADHDUFLAG | Total packets | Discarded packets |
| A | 0 | 50 | 0 |
| B | 0 | 50 | 0 |
| C | 0 | 50 | 0 |
| D | 0 | 50 | 0 |
| Quadrant | Total seconds | Saturated seconds | Saturation percentage |
|---|---|---|---|
| A | 2537 | 3 | 0.118250% |
| B | 2537 | 2 | 0.078833% |
| C | 2537 | 1 | 0.039417% |
| D | 2537 | 0 | 0.000000% |
Noise dominated data is calculated using 1-second bins in cleaned event files. If a bin has >2000 counts, and if more than 50% of those come from <1% of pixels, then it is considered to be noise-dominated and hence unusable.
| Quadrant | # 1 sec bins | Bins with >0 counts | Bins with >2000 counts | High rate bins dominated by noise | Noise dominated (total time) | Noise dominated (detector-on time) | Marked lightcurve |
|---|---|---|---|---|---|---|---|
| A | 2537 | 2537 | 0 | 0 | 0.00% | 0.00% | 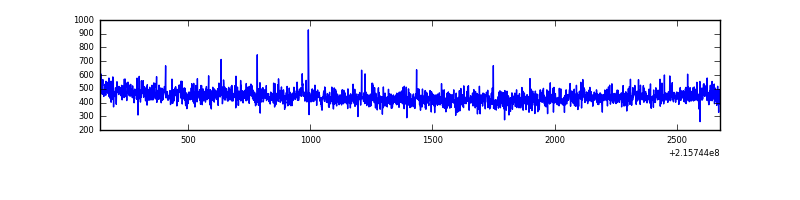 |
| B | 2537 | 2537 | 0 | 0 | 0.00% | 0.00% | 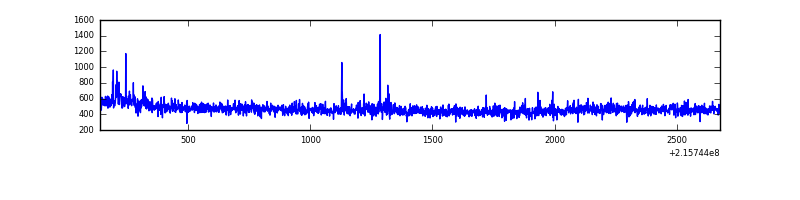 |
| C | 2537 | 2537 | 0 | 0 | 0.00% | 0.00% | 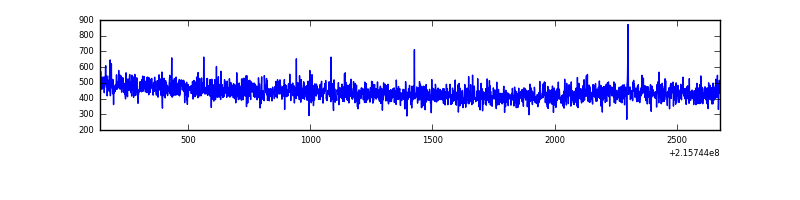 |
| D | 2537 | 2537 | 0 | 0 | 0.00% | 0.00% |  |
Top three noisy pixels from each quadrant. If the there are fewer than three noisy pixels in the level2.evt file, extra rows are filled as -1
| Pixel properties | Quadrant properties | ||||||
|---|---|---|---|---|---|---|---|
| Quadrant | DetID | PixID | Counts | Sigma | Mean | Median | Sigma |
| A | 0 | 50 | 4859 | 75.49 | 290 | 284 | 60.6 |
| A | 0 | 226 | 2801 | 41.53 | 290 | 284 | 60.6 |
| A | 12 | 194 | 2764 | 40.92 | 290 | 284 | 60.6 |
| B | 15 | 204 | 14405 | 243.38 | 298 | 292 | 58.0 |
| B | 0 | 219 | 7030 | 116.2 | 298 | 292 | 58.0 |
| B | 15 | 85 | 6156 | 101.13 | 298 | 292 | 58.0 |
| C | 13 | 61 | 2306 | 30.06 | 285 | 287 | 67.2 |
| C | 1 | 16 | 2192 | 28.37 | 285 | 287 | 67.2 |
| C | 3 | 202 | 668 | 5.67 | 285 | 287 | 67.2 |
| D | 8 | 195 | 144836 | 2040.72 | 280 | 271 | 70.8 |
| D | 2 | 63 | 64656 | 908.88 | 280 | 271 | 70.8 |
| D | 2 | 206 | 9712 | 133.27 | 280 | 271 | 70.8 |
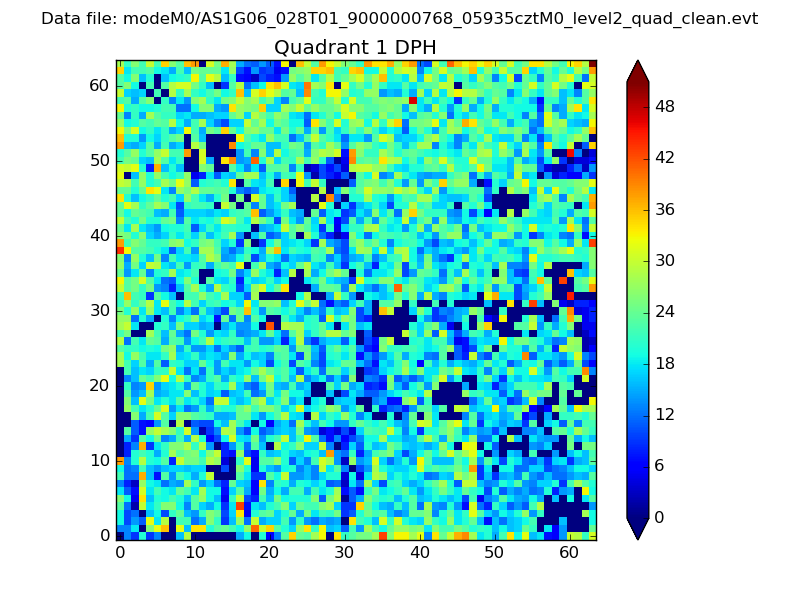
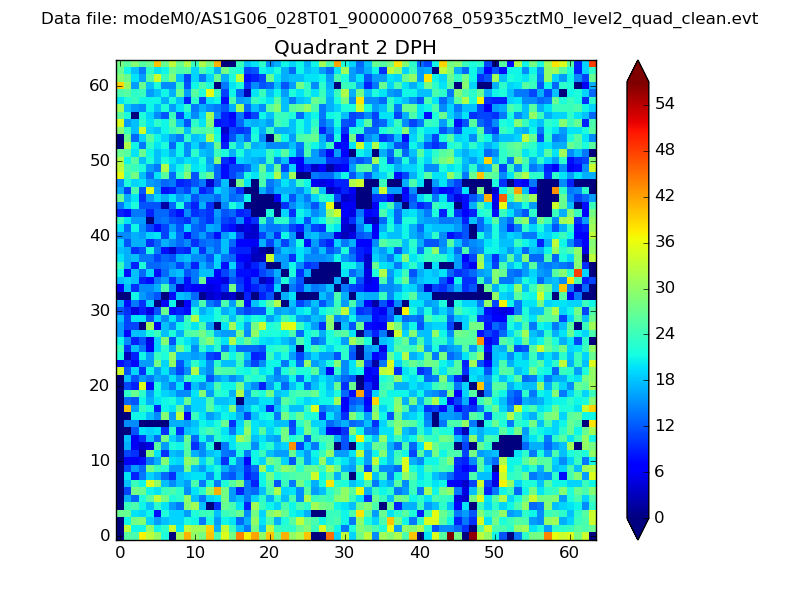
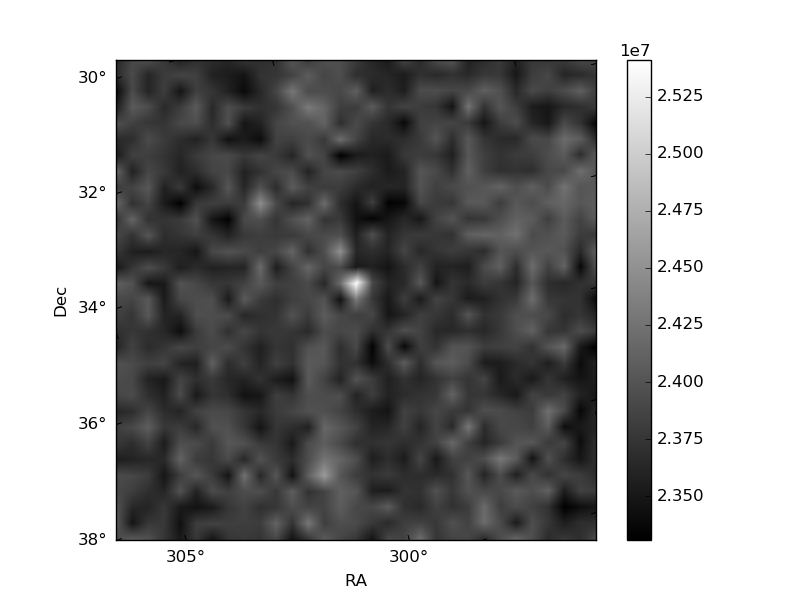
Histogram calculated using DETX and DETY for each event in the final _common_clean file
| Quadrant A | 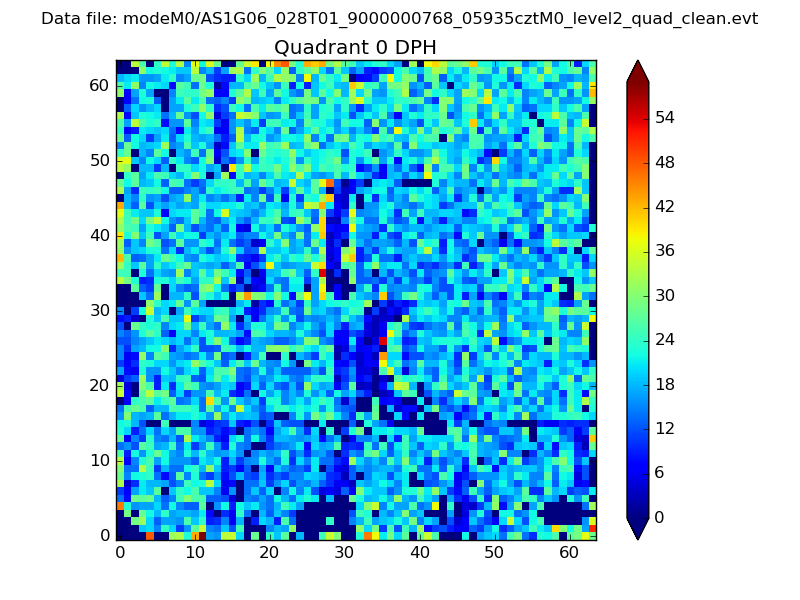 |
 |
Quadrant B |
|---|---|---|---|
| Quadrant D | 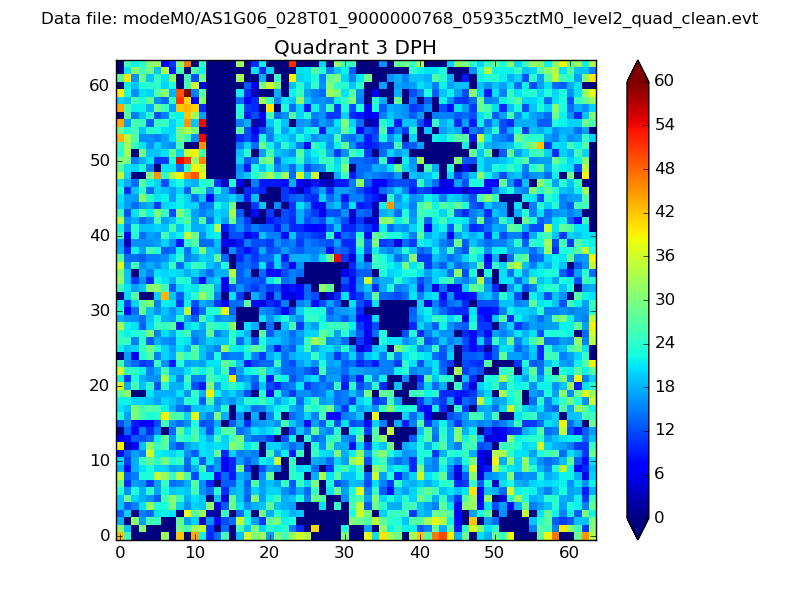 |
 |
Quadrant C |
| Plot type | Count rate plots | Images |
|---|---|---|
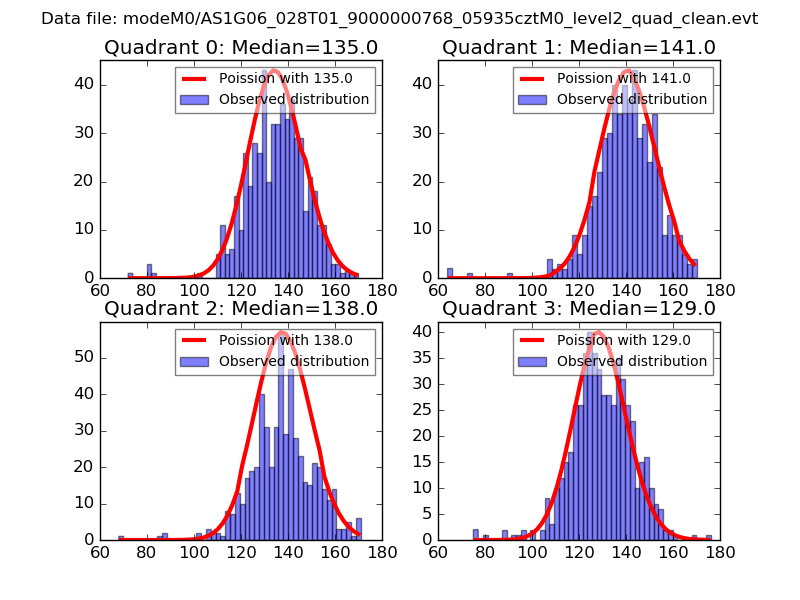
| Comparison with Poisson distribution Blue bars denote a histogram of data divided into 1 sec bins. Red curve is a Poisson curve with rate = median count rate of data. |
 |
 |
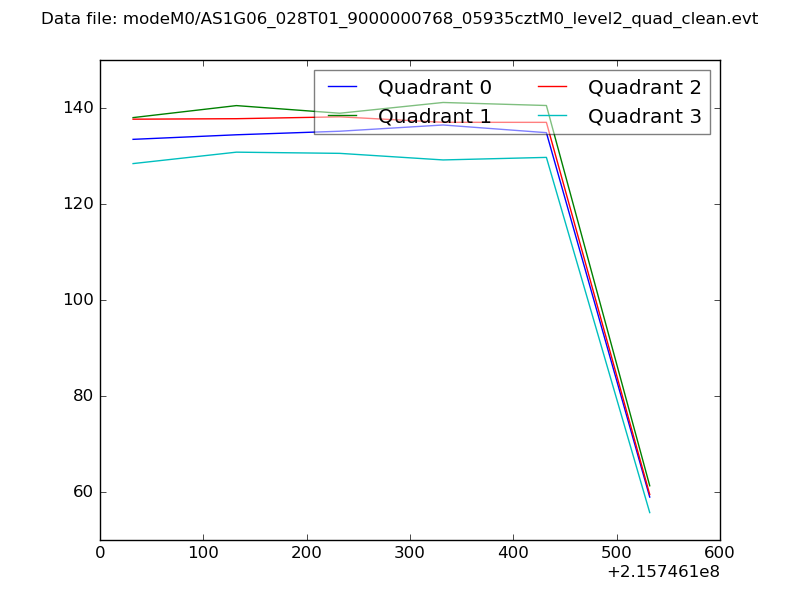
| Quadrant-wise count rates Data is divided into 100 sec bins |
 |
|
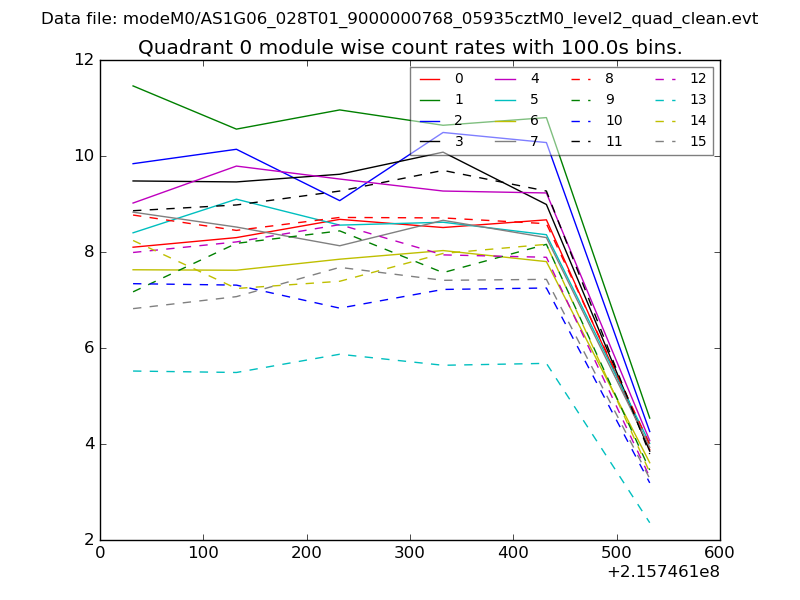
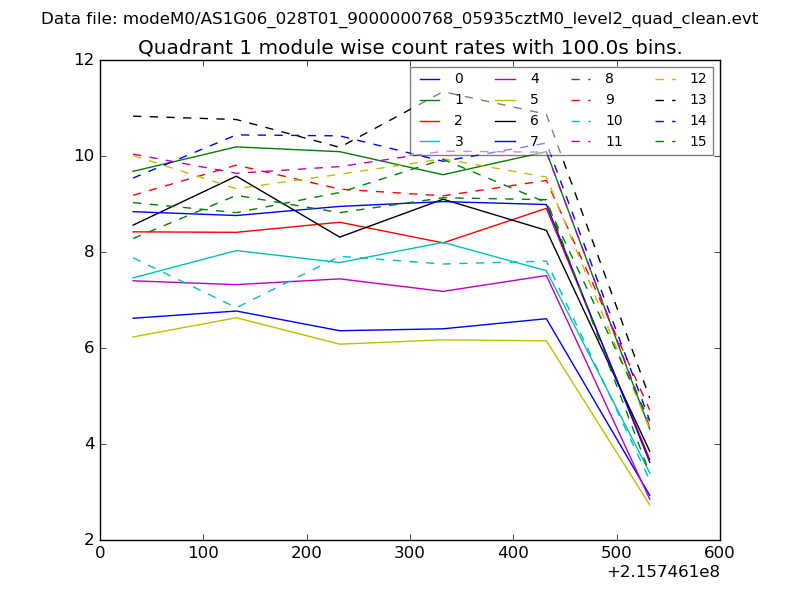
| Module-wise count rates for Quadrant A Data is divided into 100 sec bins |
 |
 |
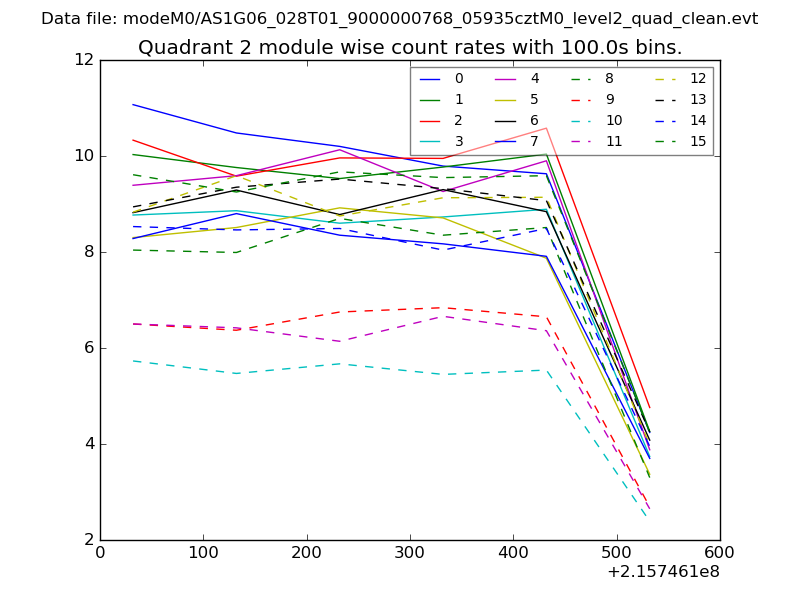
| Module-wise count rates for Quadrant B Data is divided into 100 sec bins |
 |
 |
| Module-wise count rates for Quadrant C Data is divided into 100 sec bins |
 |
 |
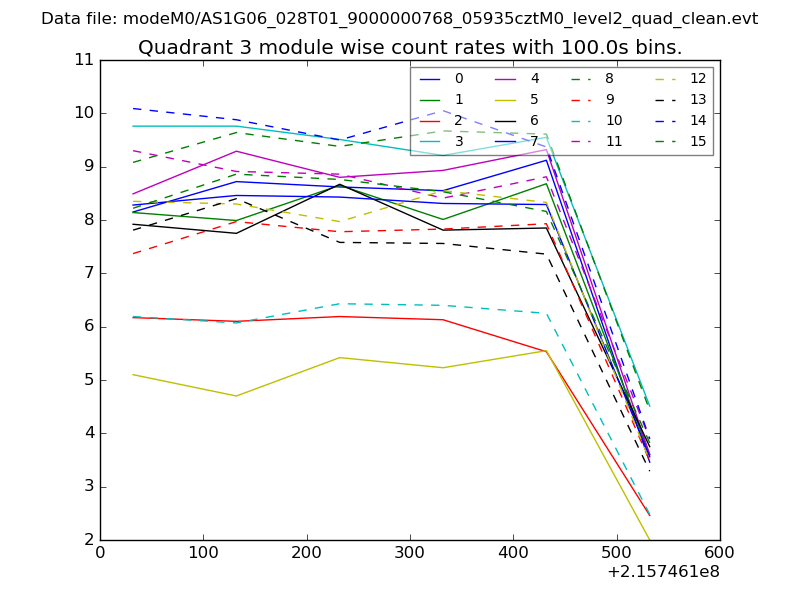
| Module-wise count rates for Quadrant D Data is divided into 100 sec bins |
 |
 |
| Parameter | Plot |
|---|---|
| CZT HV Monitor | 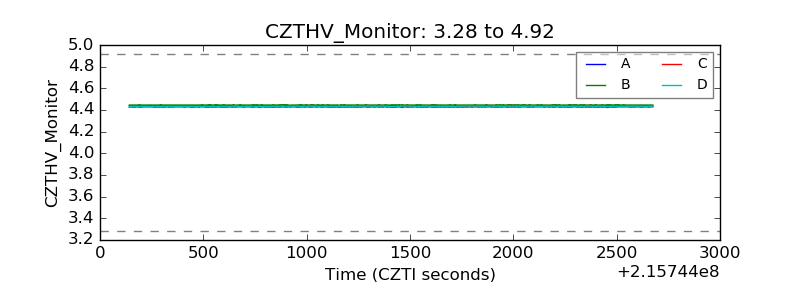 |
| D_VDD | 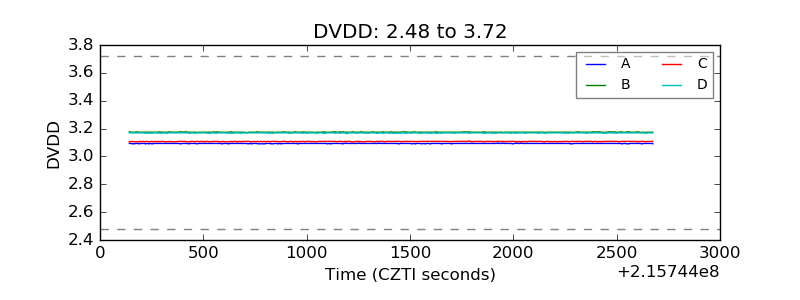 |
| Temperature 1 | 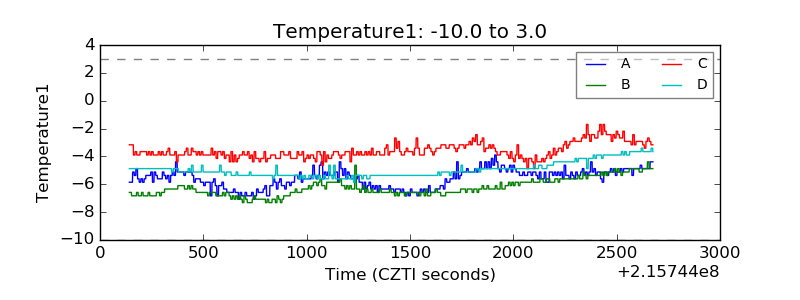 |
| Veto HV Monitor | 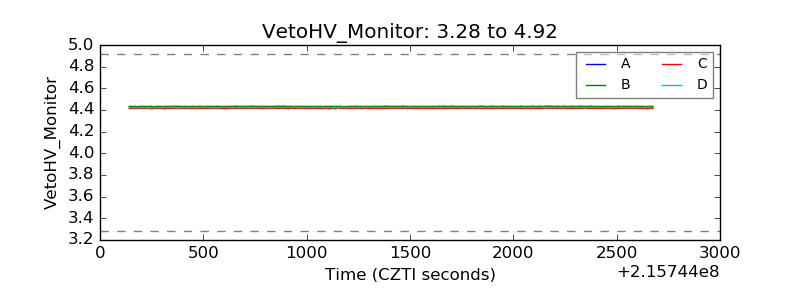 |
| Veto LLD | 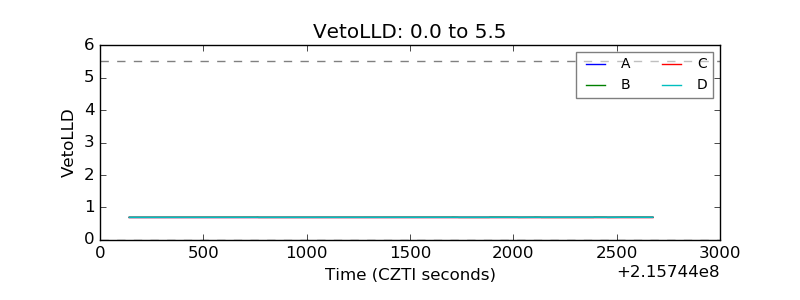 |
| Alpha Counter | 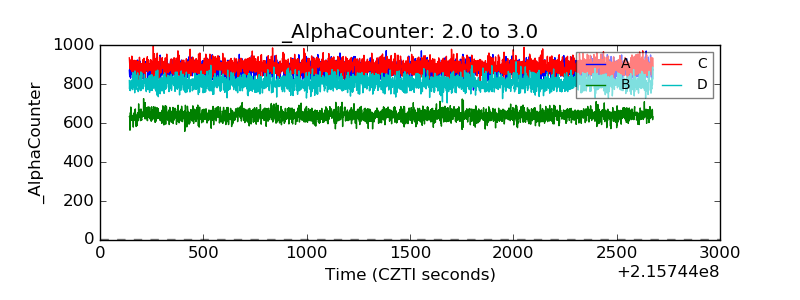 |
| _CPM_Rate | 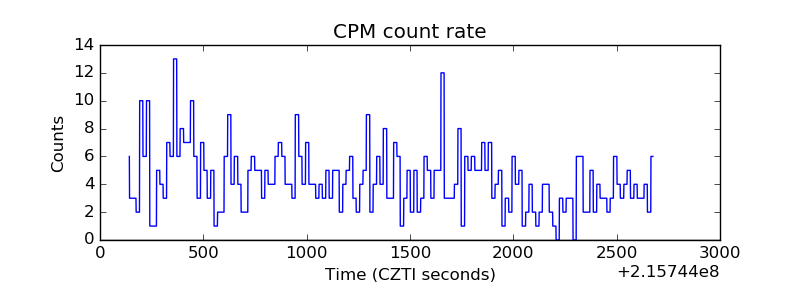 |
| CZT Counter | 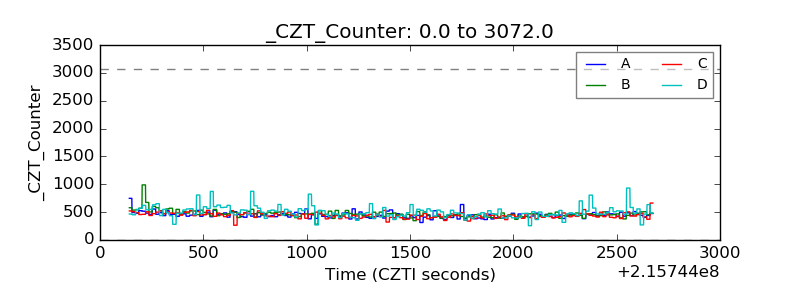 |
| +2.5 Volts monitor | 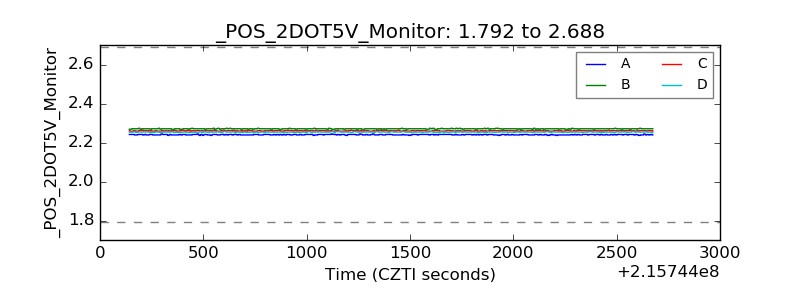 |
| +5 Volts monitor | 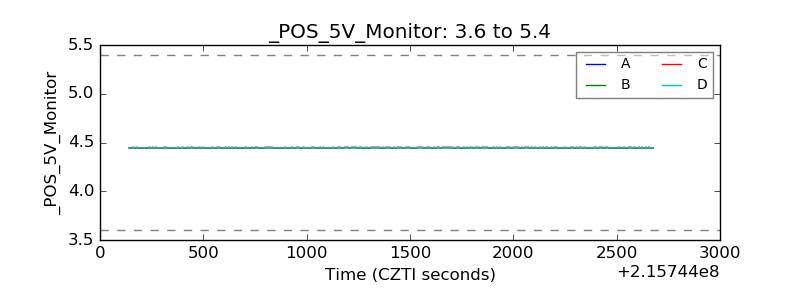 |
| _ROLL_ROT | 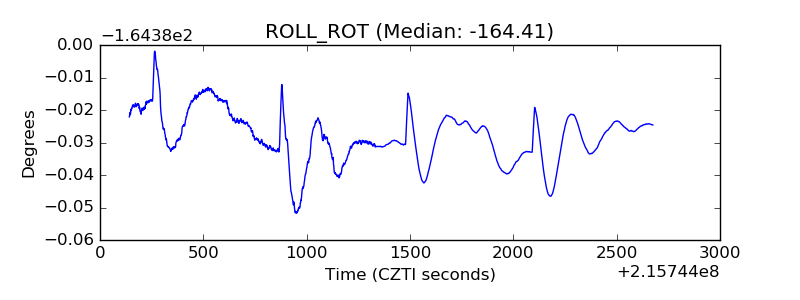 |
| _Roll_DEC | 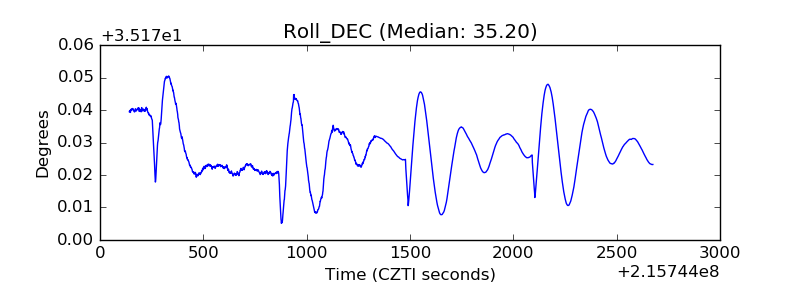 |
| _Roll_RA | 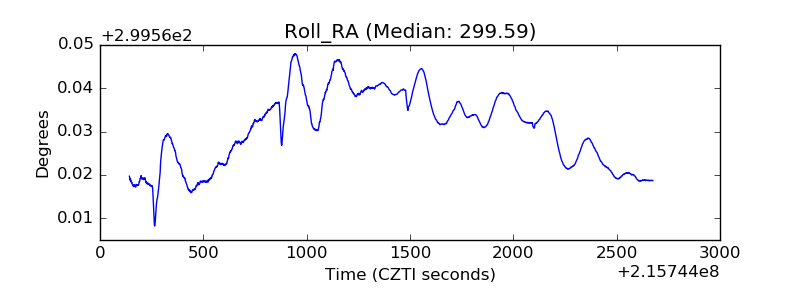 |
| Veto Counter | 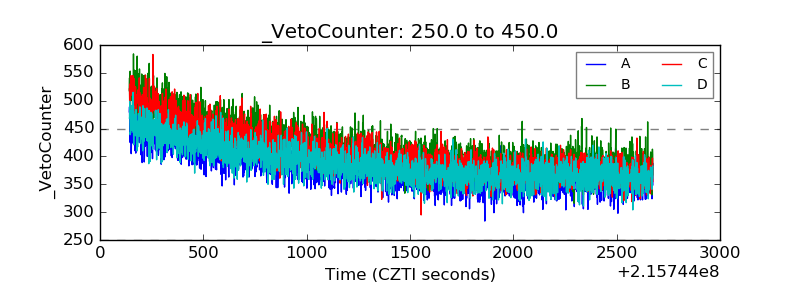 |