| Param | Original file | Final file |
|---|---|---|
| Filename | modeM0/AS1G06_027T01_9000000770cztM0_level2.fits | modeM0/AS1G06_027T01_9000000770cztM0_level2_quad_clean.evt |
| Size (bytes) | 260,291,520 | 243,498,240 |
| Size | 248.2 MB | 232.2 MB |
| Events in quadrant A | 1,580,498 | 1,439,670 |
| Events in quadrant B | 1,552,784 | 1,490,378 |
| Events in quadrant C | 1,580,254 | 1,450,782 |
| Events in quadrant D | 1,192,469 | 1,020,968 |
| Mode M0 | |||
|---|---|---|---|
| Quadrant | BADHDUFLAG | Total packets | Discarded packets |
| A | 0 | 64267 | 0 |
| B | 0 | 61992 | 0 |
| C | 0 | 60266 | 0 |
| D | 0 | 89852 | 0 |
| Mode M9 | |||
|---|---|---|---|
| Quadrant | BADHDUFLAG | Total packets | Discarded packets |
| A | 0 | 42 | 0 |
| B | 0 | 40 | 0 |
| C | 0 | 41 | 0 |
| D | 0 | 41 | 0 |
| Mode SS | |||
|---|---|---|---|
| Quadrant | BADHDUFLAG | Total packets | Discarded packets |
| A | 0 | 614 | 0 |
| B | 0 | 596 | 0 |
| C | 0 | 609 | 0 |
| D | 0 | 611 | 0 |
| Quadrant | Total seconds | Saturated seconds | Saturation percentage |
|---|---|---|---|
| A | 29090 | 1001 | 3.441045% |
| B | 29213 | 636 | 2.177113% |
| C | 29198 | 344 | 1.178163% |
| D | 26765 | 2744 | 10.252195% |
Noise dominated data is calculated using 1-second bins in cleaned event files. If a bin has >2000 counts, and if more than 50% of those come from <1% of pixels, then it is considered to be noise-dominated and hence unusable.
| Quadrant | # 1 sec bins | Bins with >0 counts | Bins with >2000 counts | High rate bins dominated by noise | Noise dominated (total time) | Noise dominated (detector-on time) | Marked lightcurve |
|---|---|---|---|---|---|---|---|
| A | 46104 | 32157 | 0 | 0 | 0.00% | 0.00% | 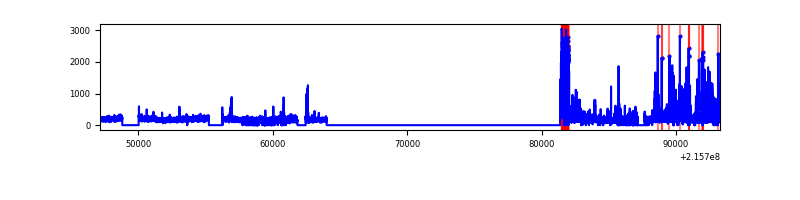 |
| B | 46104 | 32201 | 0 | 0 | 0.00% | 0.00% | 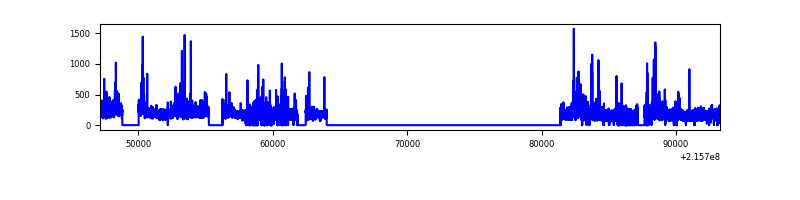 |
| C | 46104 | 32172 | 0 | 0 | 0.00% | 0.00% | 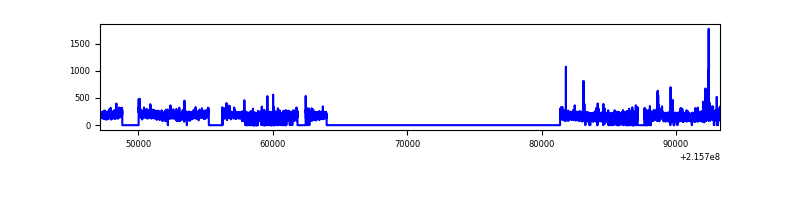 |
| D | 46103 | 29783 | 0 | 0 | 0.00% | 0.00% | 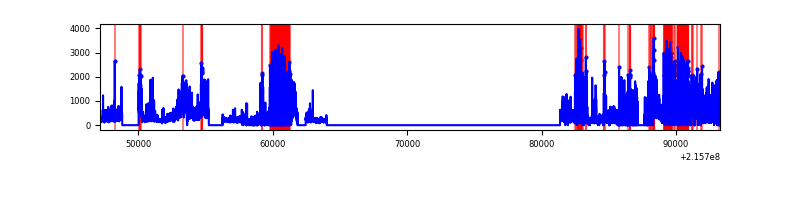 |
Top three noisy pixels from each quadrant. If the there are fewer than three noisy pixels in the level2.evt file, extra rows are filled as -1
| Pixel properties | Quadrant properties | ||||||
|---|---|---|---|---|---|---|---|
| Quadrant | DetID | PixID | Counts | Sigma | Mean | Median | Sigma |
| A | 0 | 29 | 1541 | 10.9 | 409 | 381 | 106.4 |
| A | 14 | 188 | 1480 | 10.33 | 409 | 381 | 106.4 |
| A | 7 | 110 | 1292 | 8.56 | 409 | 381 | 106.4 |
| B | 2 | 9 | 1324 | 10.82 | 409 | 386 | 86.7 |
| B | 12 | 226 | 1078 | 7.98 | 409 | 386 | 86.7 |
| B | 5 | 128 | 1063 | 7.81 | 409 | 386 | 86.7 |
| C | 12 | 241 | 1217 | 7.41 | 417 | 385 | 112.3 |
| C | 1 | 65 | 1088 | 6.26 | 417 | 385 | 112.3 |
| C | 2 | 191 | 1087 | 6.25 | 417 | 385 | 112.3 |
| D | 3 | 14 | 881 | 6.06 | 340 | 306 | 95.0 |
| D | 6 | 83 | 874 | 5.98 | 340 | 306 | 95.0 |
| D | 11 | 82 | 852 | 5.75 | 340 | 306 | 95.0 |
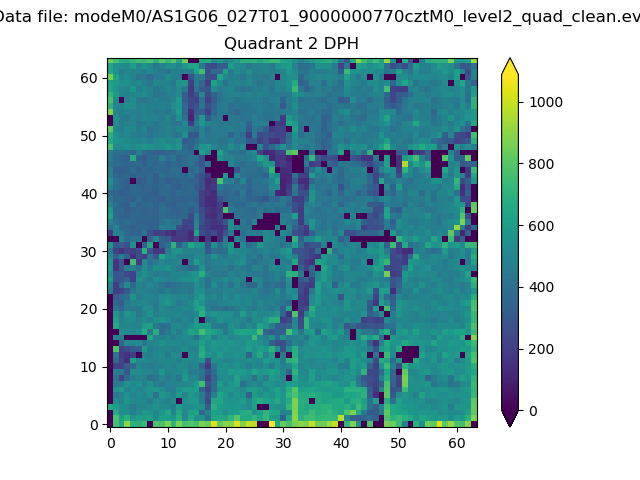
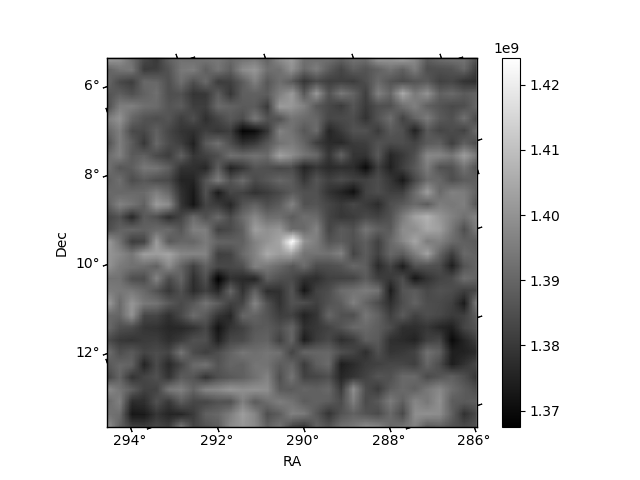
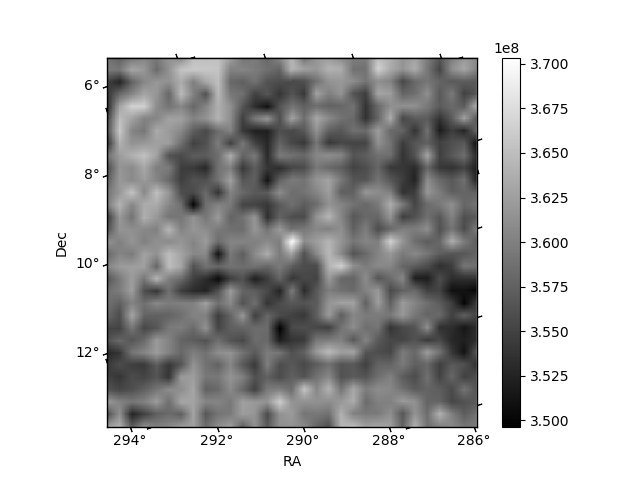
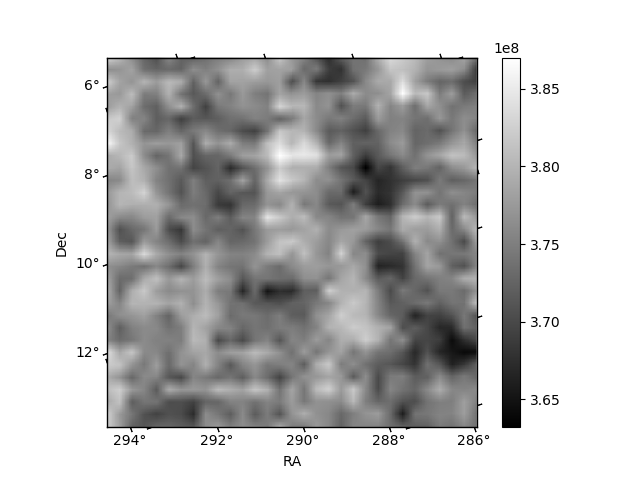
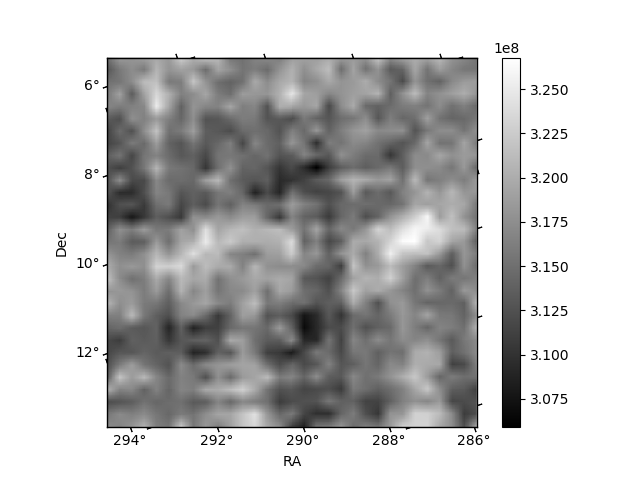
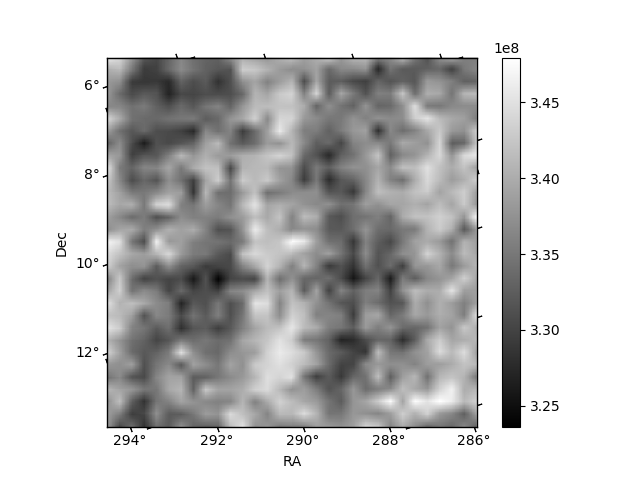
Histogram calculated using DETX and DETY for each event in the final _common_clean file
| Quadrant A | 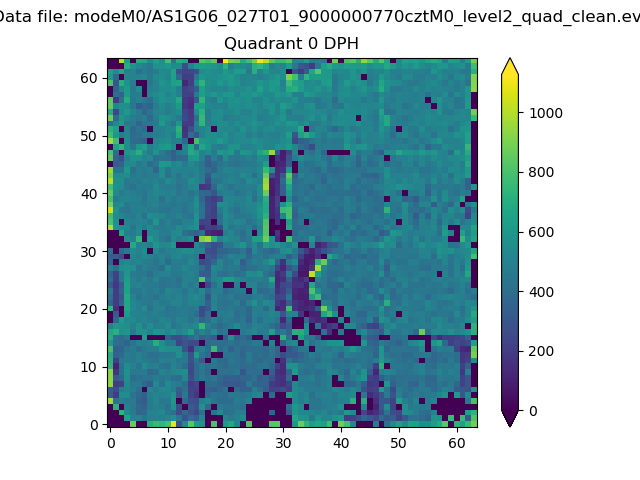 |
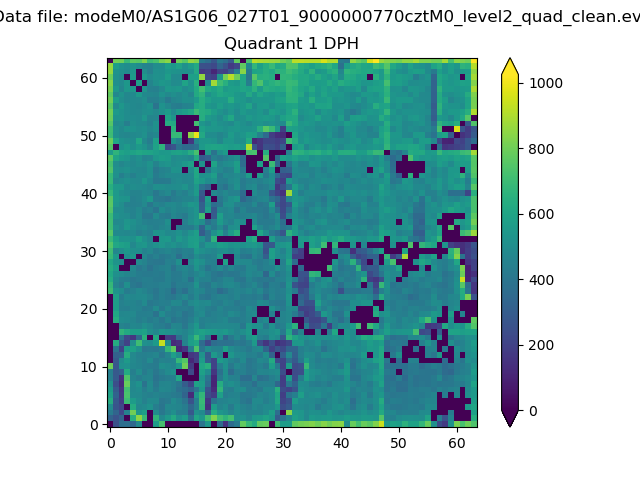 |
Quadrant B |
|---|---|---|---|
| Quadrant D | 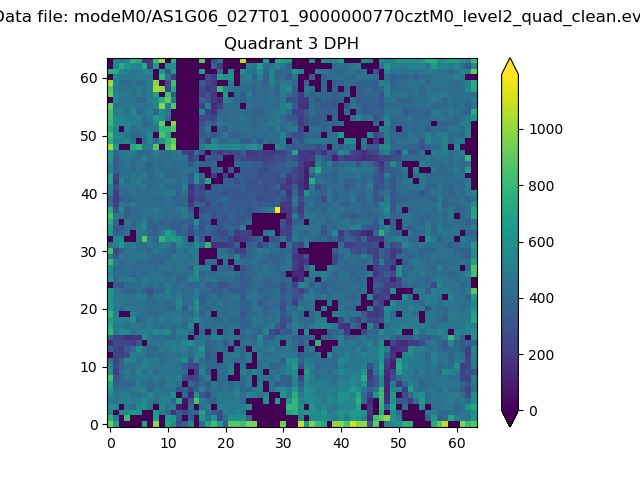 |
 |
Quadrant C |
| Plot type | Count rate plots | Images |
|---|---|---|
| Comparison with Poisson distribution Blue bars denote a histogram of data divided into 1 sec bins. Red curve is a Poisson curve with rate = median count rate of data. |
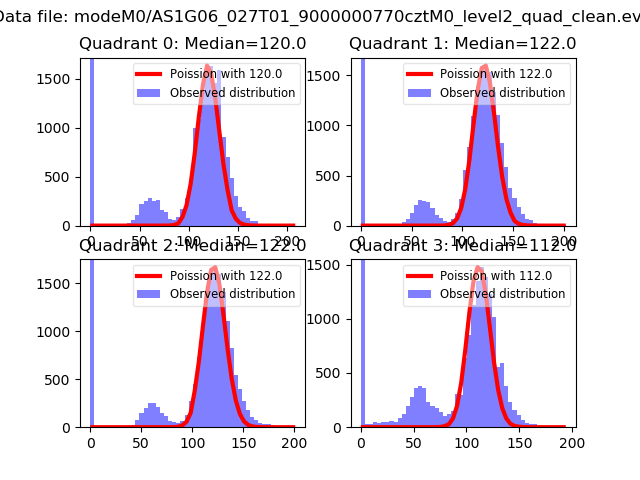 |
 |
| Quadrant-wise count rates Data is divided into 100 sec bins |
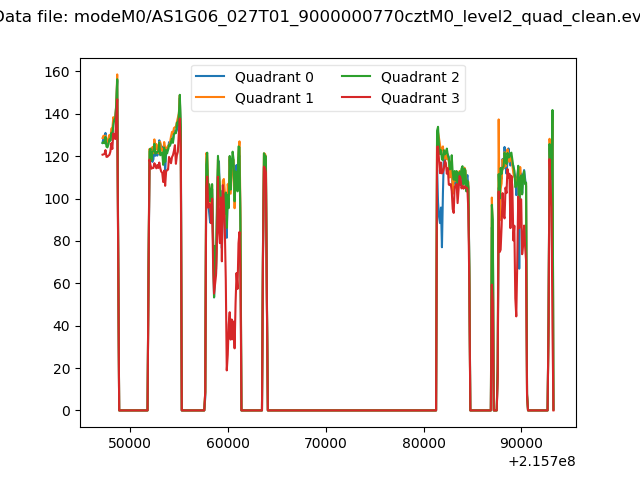 |
|
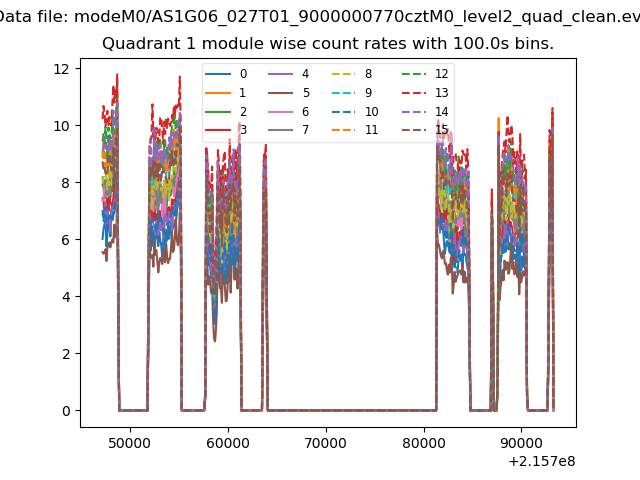
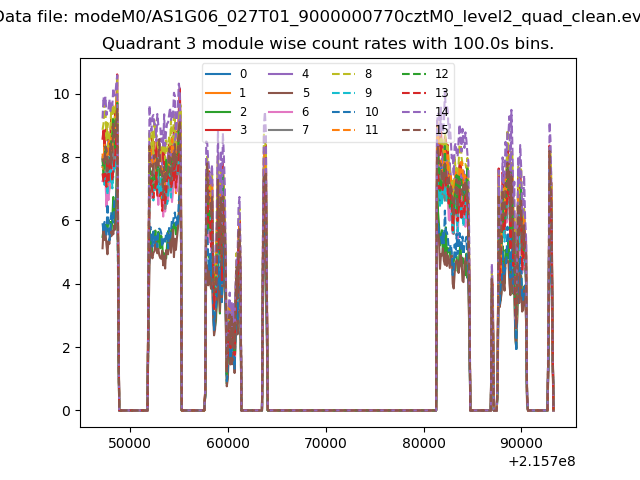
| Module-wise count rates for Quadrant A Data is divided into 100 sec bins |
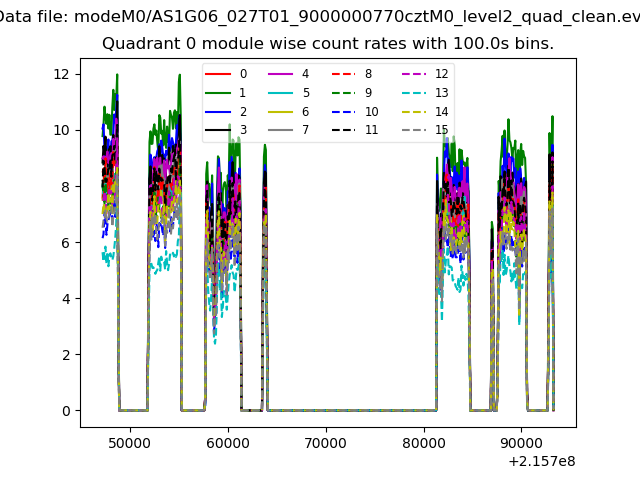 |
 |
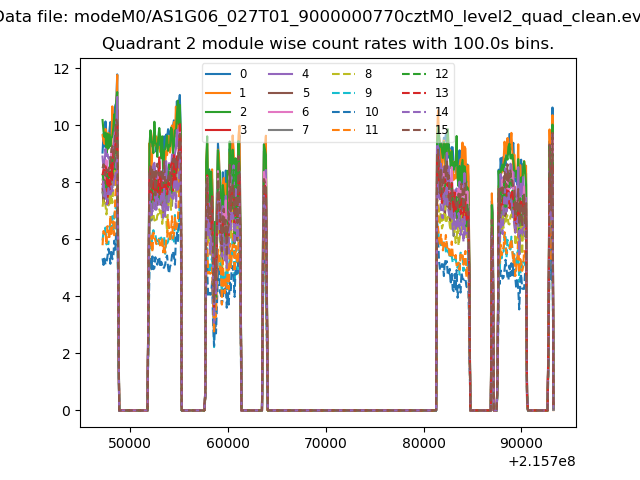
| Module-wise count rates for Quadrant B Data is divided into 100 sec bins |
 |
 |
| Module-wise count rates for Quadrant C Data is divided into 100 sec bins |
 |
 |
| Module-wise count rates for Quadrant D Data is divided into 100 sec bins |
 |
 |
| Parameter | Plot |
|---|---|
| CZT HV Monitor | 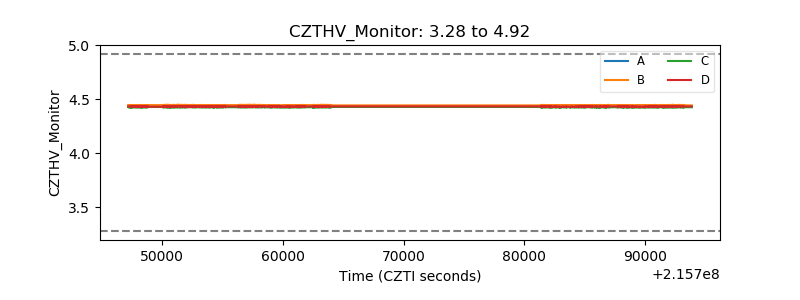 |
| D_VDD | 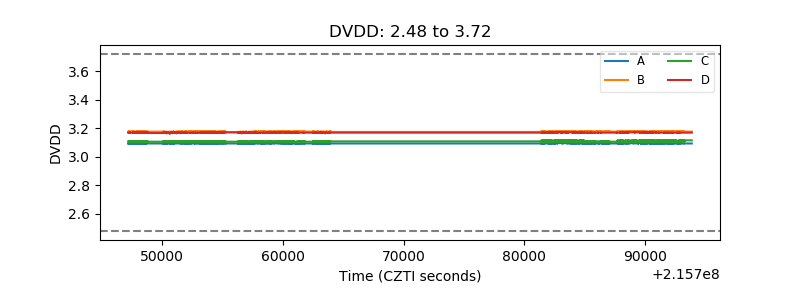 |
| Temperature 1 | 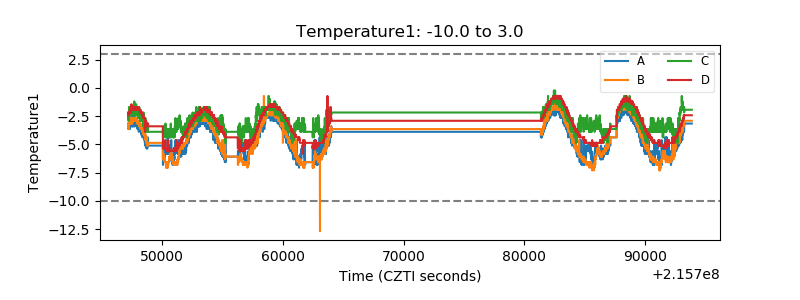 |
| Veto HV Monitor | 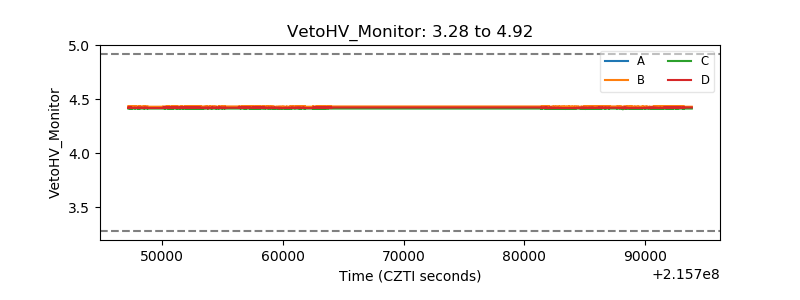 |
| Veto LLD | 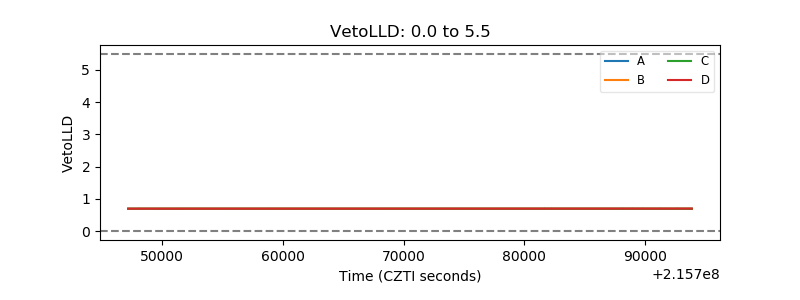 |
| Alpha Counter | 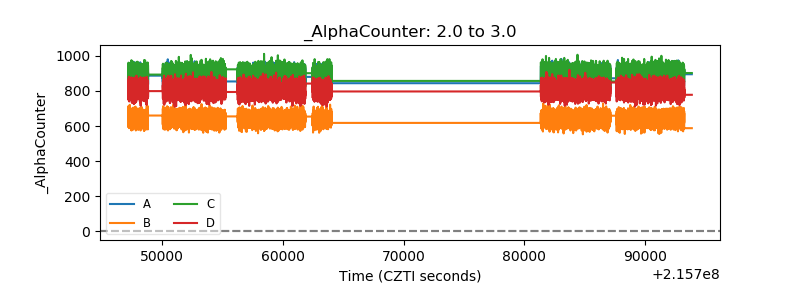 |
| _CPM_Rate | 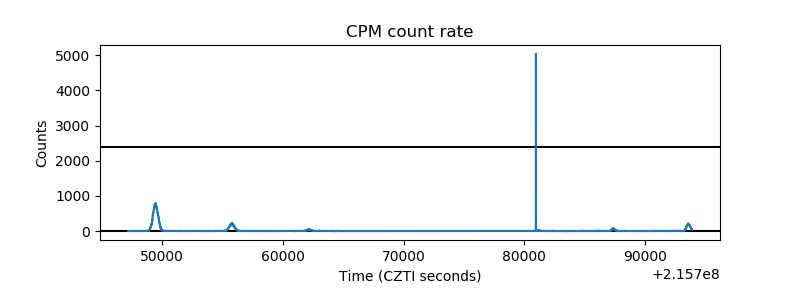 |
| CZT Counter | 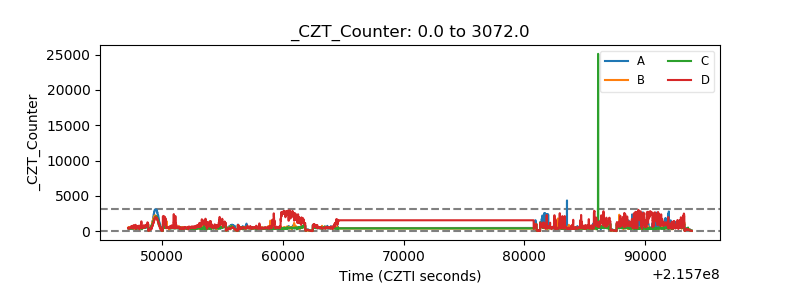 |
| +2.5 Volts monitor | 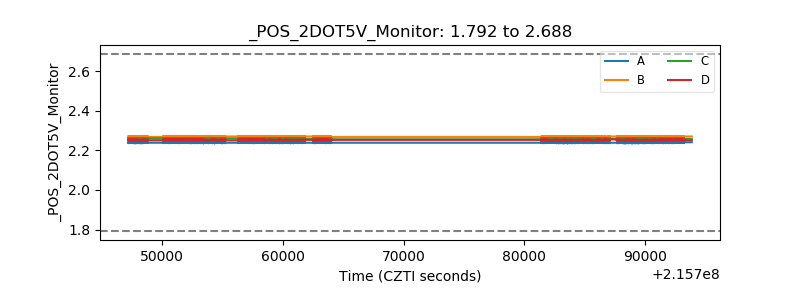 |
| +5 Volts monitor | 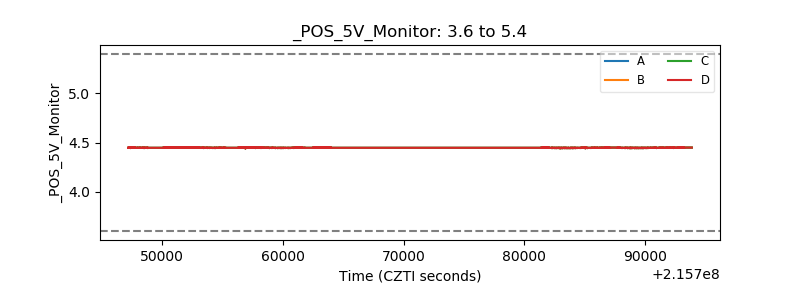 |
| _ROLL_ROT | 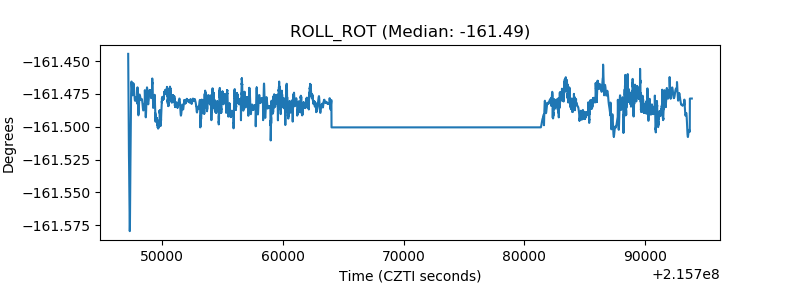 |
| _Roll_DEC | 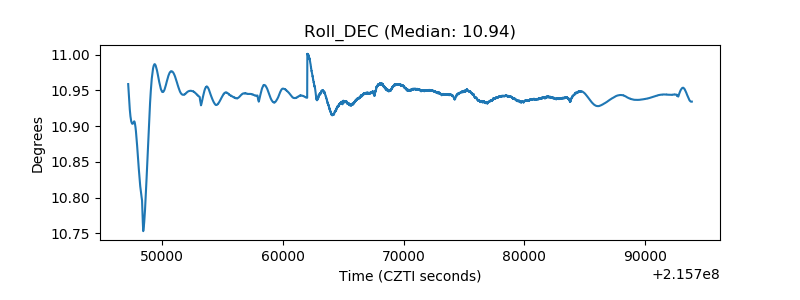 |
| _Roll_RA | 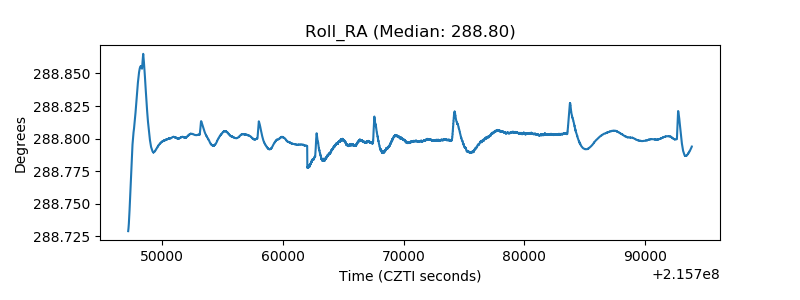 |
| Veto Counter | 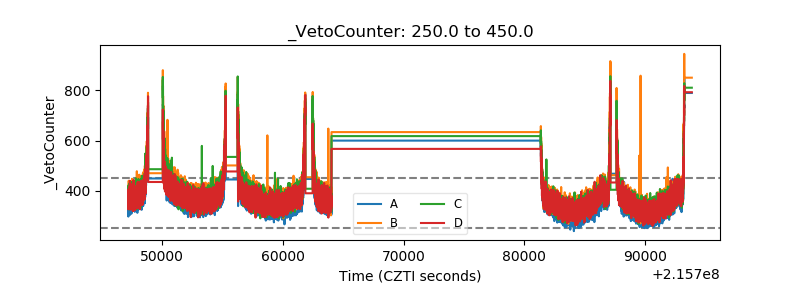 |