| Param | Original file | Final file |
|---|---|---|
| Filename | modeM0/AS1G06_027T01_9000000770_05935cztM0_level2.evt | modeM0/AS1G06_027T01_9000000770_05935cztM0_level2_quad_clean.evt |
| Size (bytes) | 233,472,960 | 36,123,840 |
| Size | 222.7 MB | 34.5 MB |
| Events in quadrant A | 1,561,286 | 219,594 |
| Events in quadrant B | 1,684,678 | 221,218 |
| Events in quadrant C | 1,547,167 | 219,772 |
| Events in quadrant D | 2,061,406 | 208,220 |
| Mode M0 | |||
|---|---|---|---|
| Quadrant | BADHDUFLAG | Total packets | Discarded packets |
| A | 0 | 6647 | 2 |
| B | 0 | 6953 | 1 |
| C | 0 | 6639 | 1 |
| D | 0 | 8157 | 1 |
| Mode M9 | |||
|---|---|---|---|
| Quadrant | BADHDUFLAG | Total packets | Discarded packets |
| A | 0 | 12 | 0 |
| B | 0 | 12 | 0 |
| C | 0 | 12 | 0 |
| D | 0 | 12 | 0 |
| Mode SS | |||
|---|---|---|---|
| Quadrant | BADHDUFLAG | Total packets | Discarded packets |
| A | 0 | 66 | 0 |
| B | 0 | 66 | 0 |
| C | 0 | 66 | 0 |
| D | 0 | 66 | 0 |
| Quadrant | Total seconds | Saturated seconds | Saturation percentage |
|---|---|---|---|
| A | 3154 | 55 | 1.743817% |
| B | 3154 | 86 | 2.726696% |
| C | 3154 | 49 | 1.553583% |
| D | 3154 | 102 | 3.233989% |
Noise dominated data is calculated using 1-second bins in cleaned event files. If a bin has >2000 counts, and if more than 50% of those come from <1% of pixels, then it is considered to be noise-dominated and hence unusable.
| Quadrant | # 1 sec bins | Bins with >0 counts | Bins with >2000 counts | High rate bins dominated by noise | Noise dominated (total time) | Noise dominated (detector-on time) | Marked lightcurve |
|---|---|---|---|---|---|---|---|
| A | 4374 | 3155 | 0 | 0 | 0.00% | 0.00% | 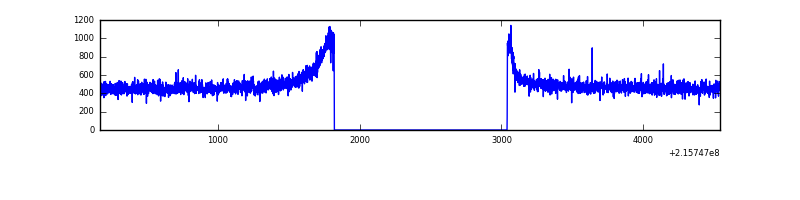 |
| B | 4374 | 3155 | 4 | 4 | 0.09% | 0.13% | 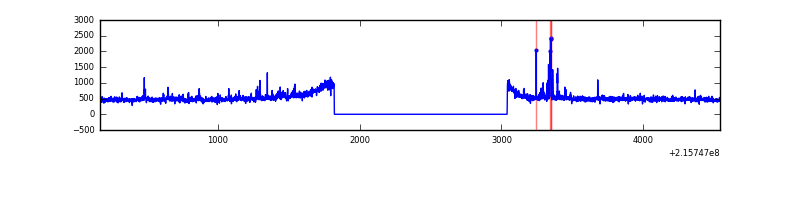 |
| C | 4374 | 3155 | 0 | 0 | 0.00% | 0.00% | 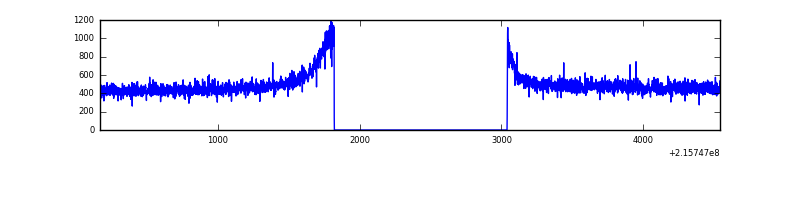 |
| D | 4374 | 3155 | 32 | 32 | 0.73% | 1.01% | 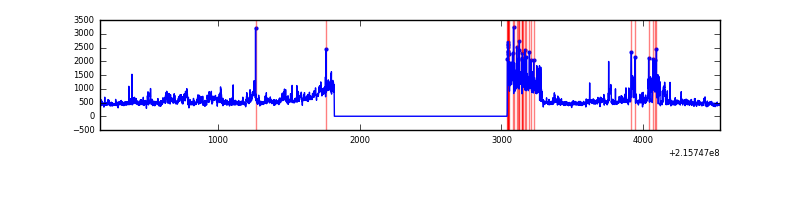 |
Top three noisy pixels from each quadrant. If the there are fewer than three noisy pixels in the level2.evt file, extra rows are filled as -1
| Pixel properties | Quadrant properties | ||||||
|---|---|---|---|---|---|---|---|
| Quadrant | DetID | PixID | Counts | Sigma | Mean | Median | Sigma |
| A | 0 | 226 | 3849 | 40.93 | 403 | 393 | 84.4 |
| A | 12 | 194 | 3779 | 40.1 | 403 | 393 | 84.4 |
| A | 7 | 16 | 3528 | 37.13 | 403 | 393 | 84.4 |
| B | 15 | 204 | 36566 | 448.34 | 408 | 398 | 80.7 |
| B | 15 | 85 | 29090 | 355.66 | 408 | 398 | 80.7 |
| B | 0 | 229 | 12809 | 153.85 | 408 | 398 | 80.7 |
| C | 9 | 68 | 8771 | 90.01 | 393 | 396 | 93.0 |
| C | 13 | 61 | 3172 | 29.83 | 393 | 396 | 93.0 |
| C | 12 | 4 | 1530 | 12.18 | 393 | 396 | 93.0 |
| D | 2 | 63 | 339180 | 3474.36 | 389 | 377 | 97.5 |
| D | 8 | 195 | 178774 | 1829.42 | 389 | 377 | 97.5 |
| D | 1 | 20 | 30703 | 310.99 | 389 | 377 | 97.5 |
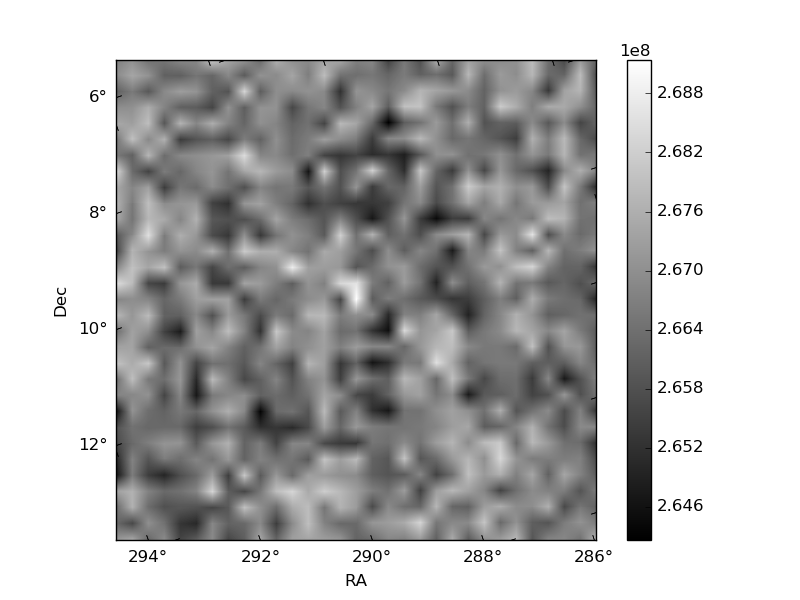
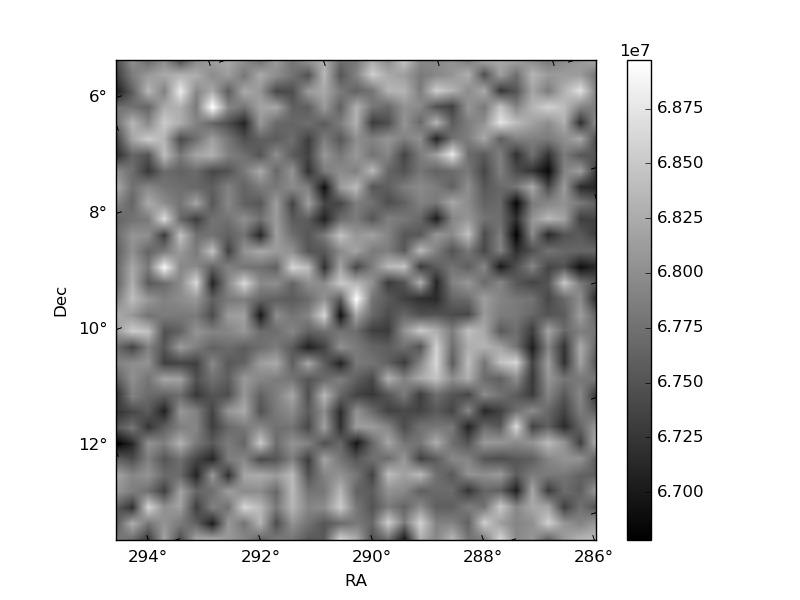
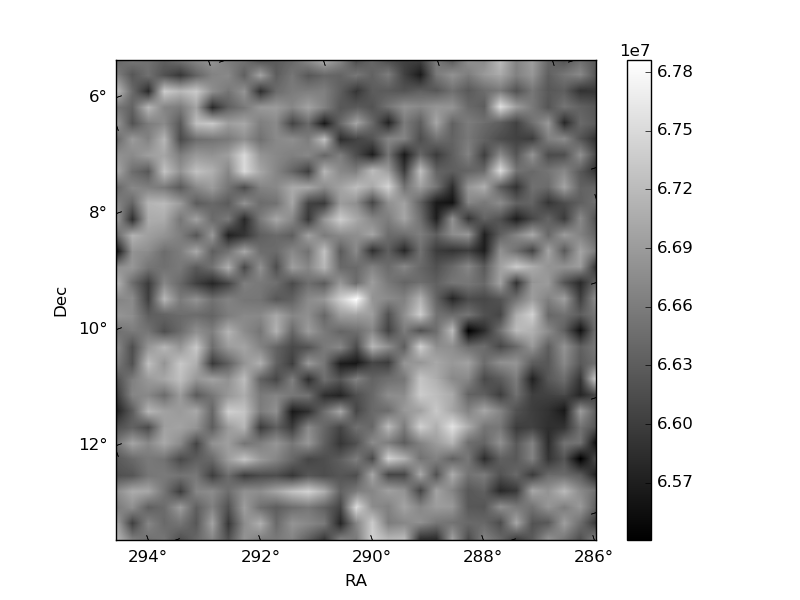
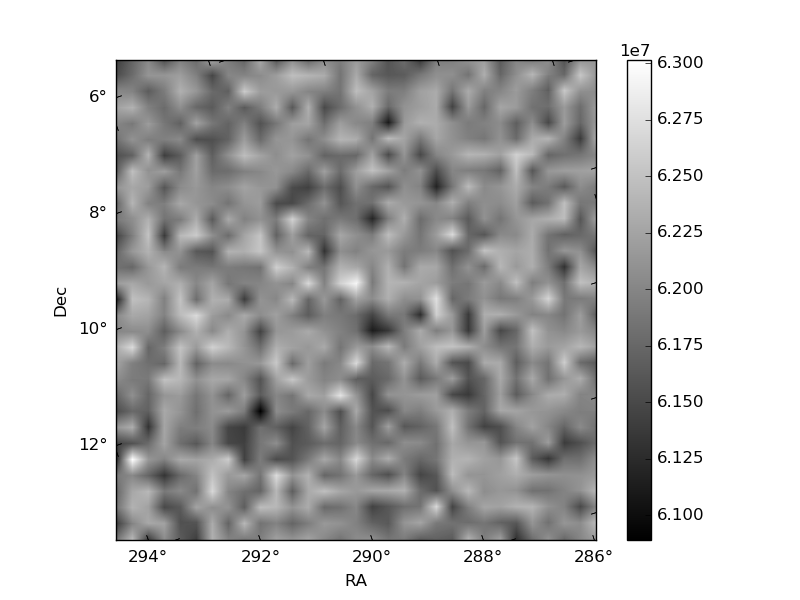
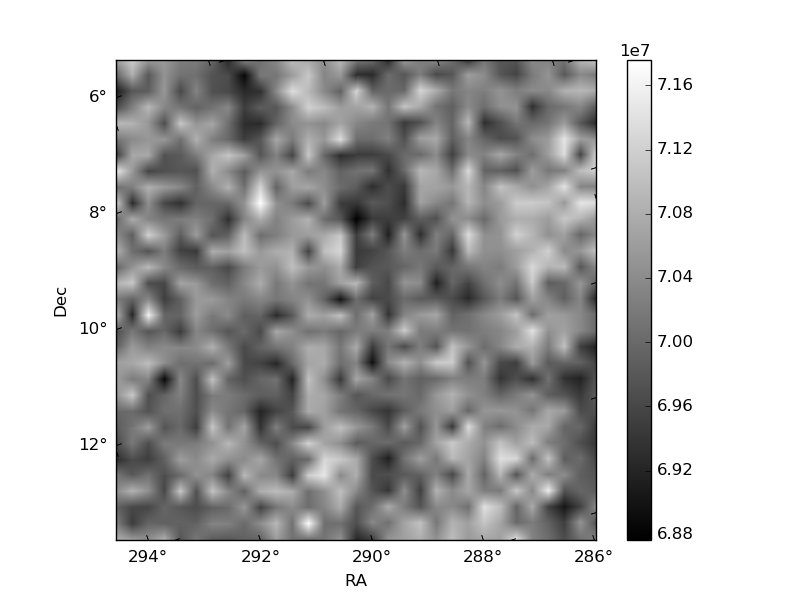
Histogram calculated using DETX and DETY for each event in the final _common_clean file
| Quadrant A | 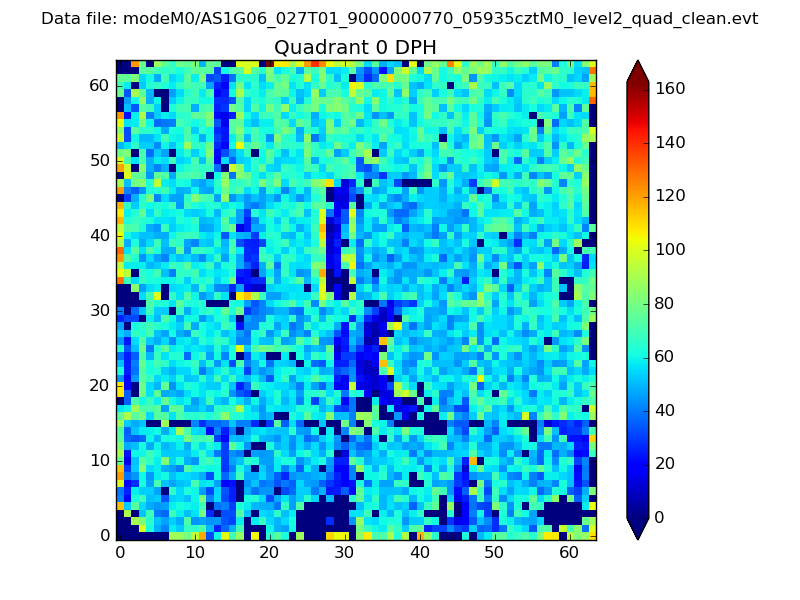 |
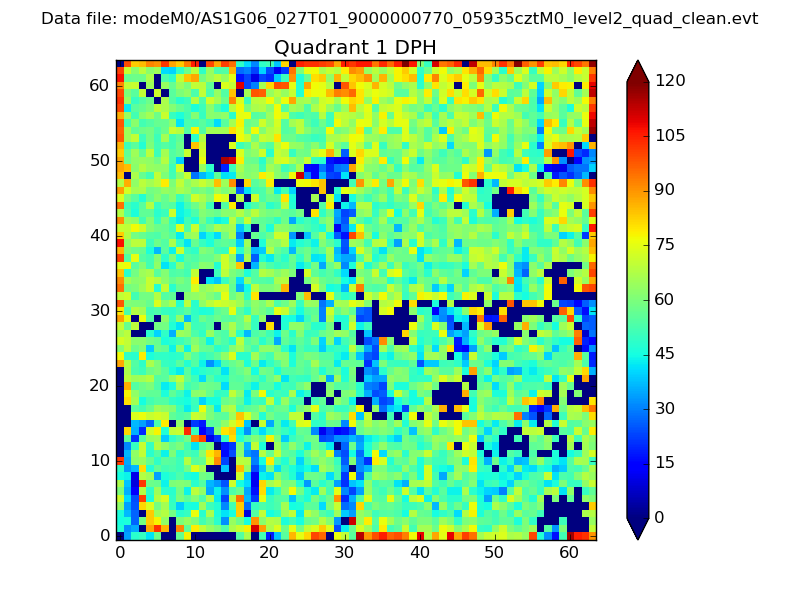 |
Quadrant B |
|---|---|---|---|
| Quadrant D |  |
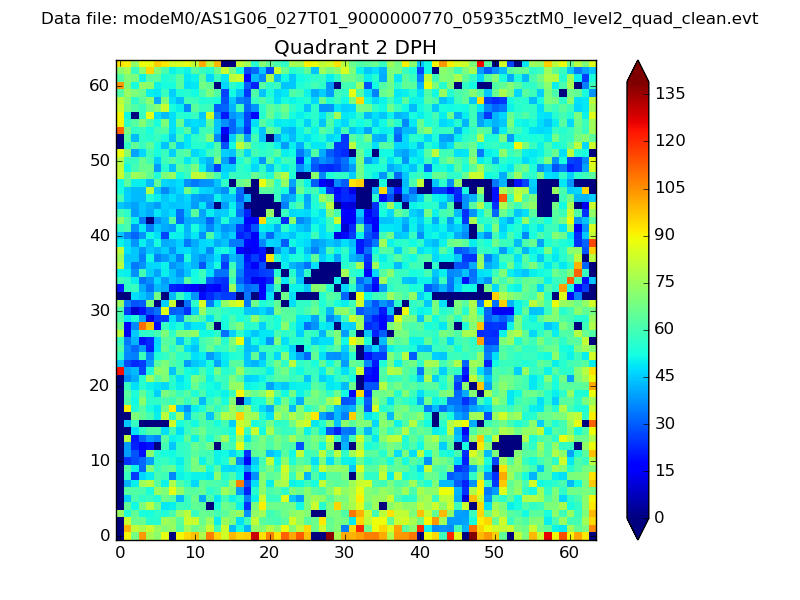 |
Quadrant C |
| Plot type | Count rate plots | Images |
|---|---|---|
| Comparison with Poisson distribution Blue bars denote a histogram of data divided into 1 sec bins. Red curve is a Poisson curve with rate = median count rate of data. |
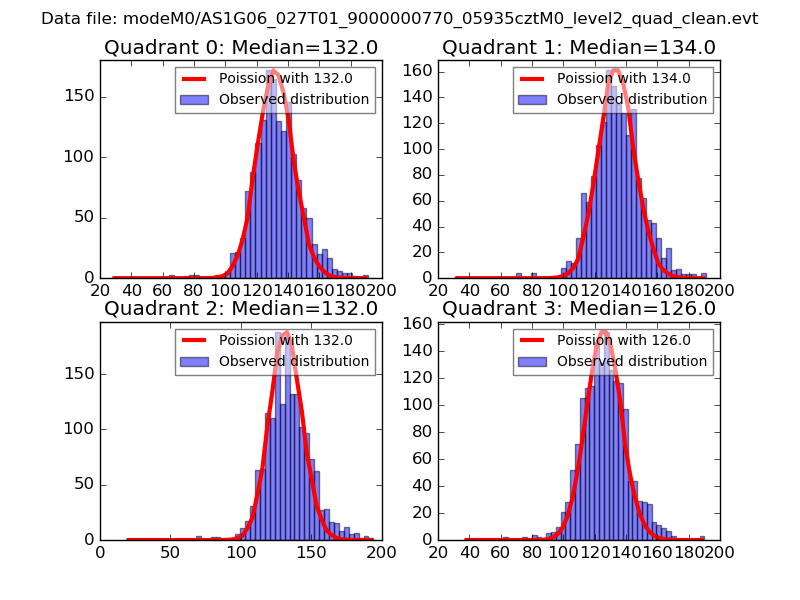 |
 |
| Quadrant-wise count rates Data is divided into 100 sec bins |
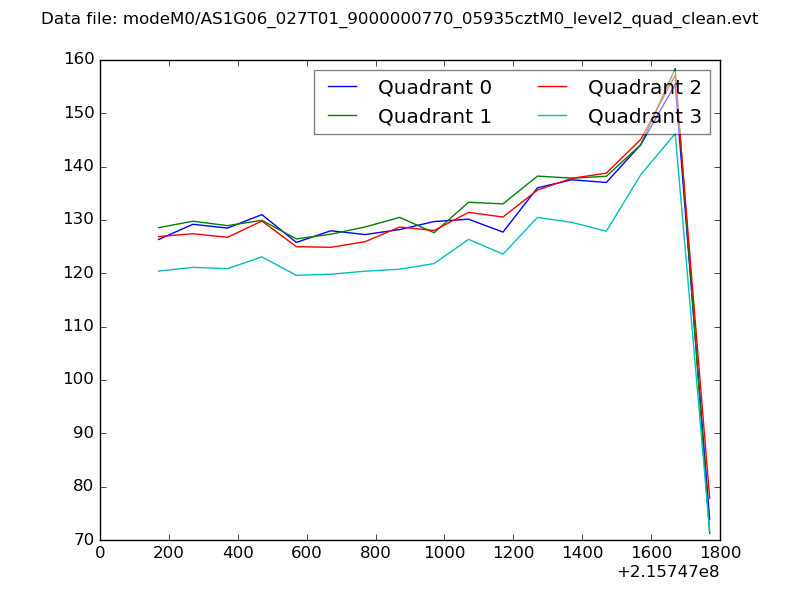 |
|
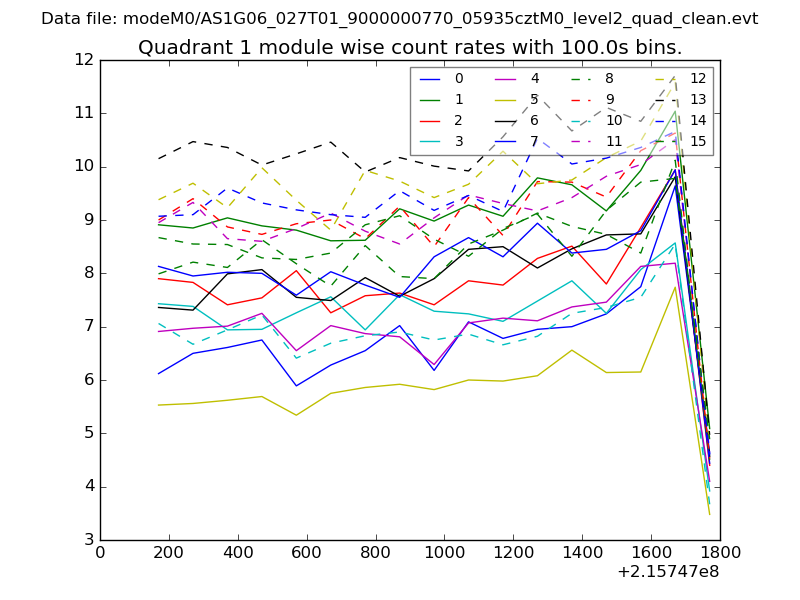
| Module-wise count rates for Quadrant A Data is divided into 100 sec bins |
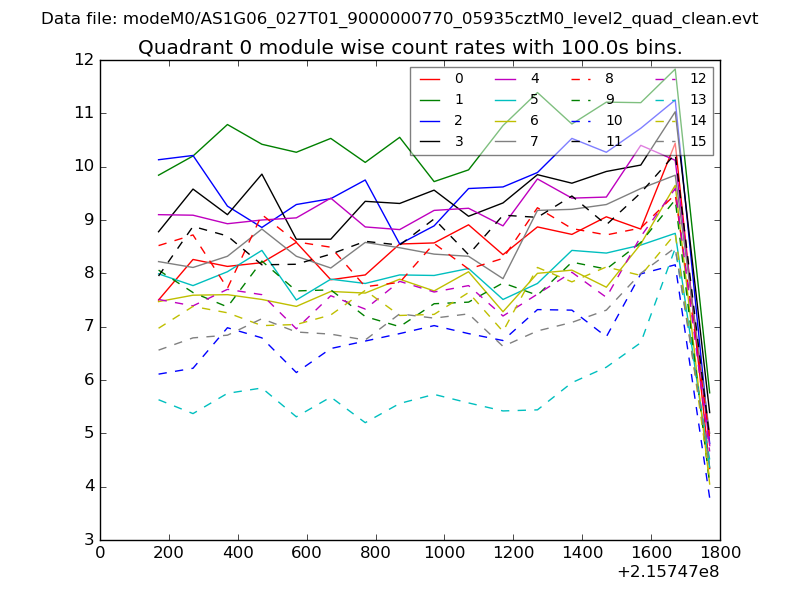 |
 |
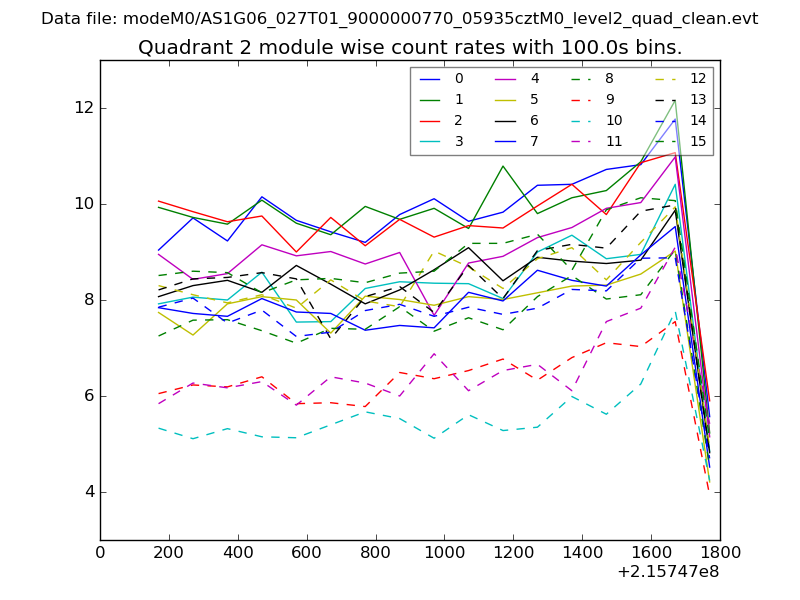
| Module-wise count rates for Quadrant B Data is divided into 100 sec bins |
 |
 |
| Module-wise count rates for Quadrant C Data is divided into 100 sec bins |
 |
 |
| Module-wise count rates for Quadrant D Data is divided into 100 sec bins |
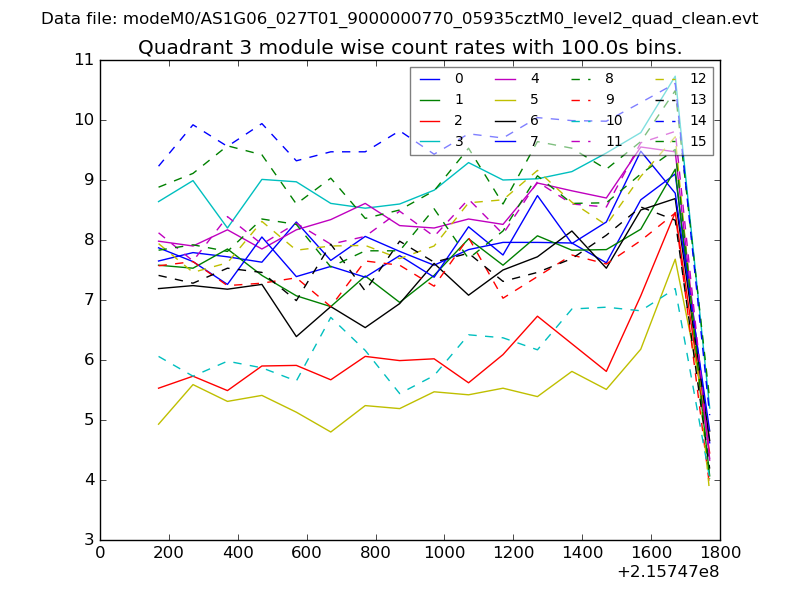 |
 |
| Parameter | Plot |
|---|---|
| CZT HV Monitor | 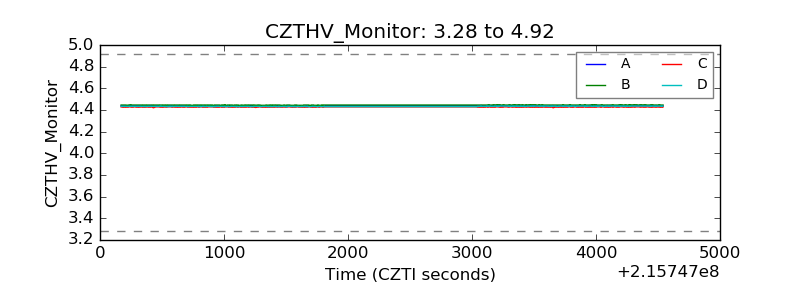 |
| D_VDD | 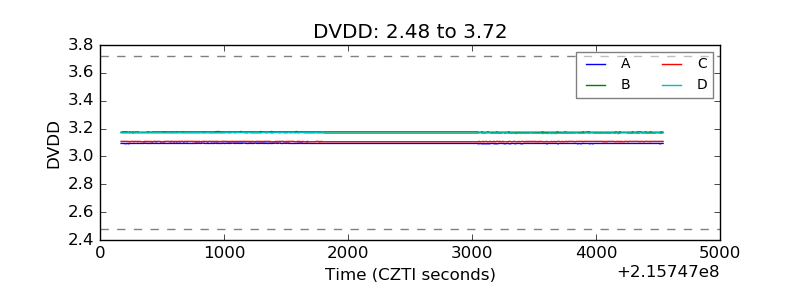 |
| Temperature 1 | 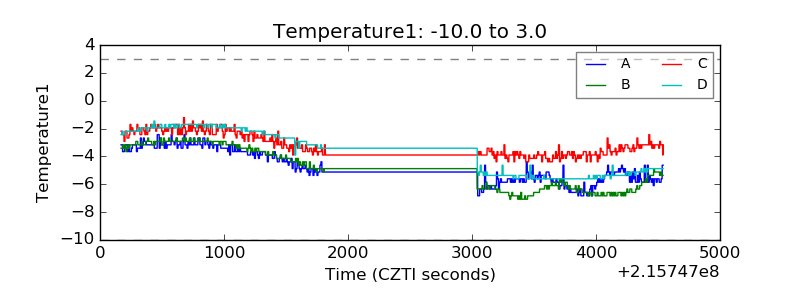 |
| Veto HV Monitor | 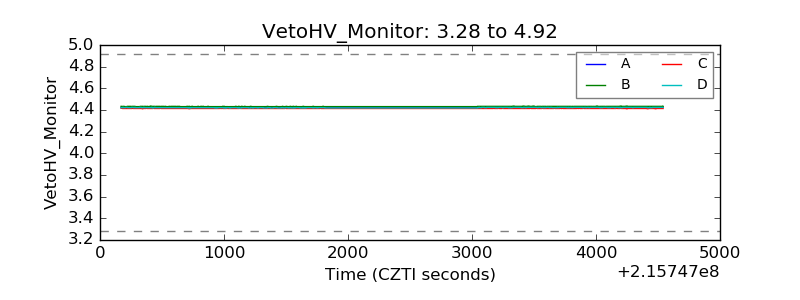 |
| Veto LLD | 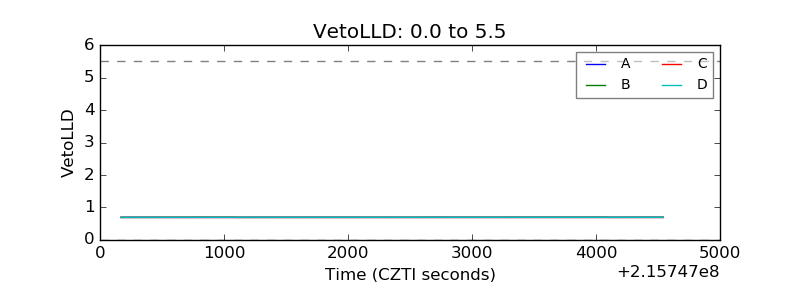 |
| Alpha Counter | 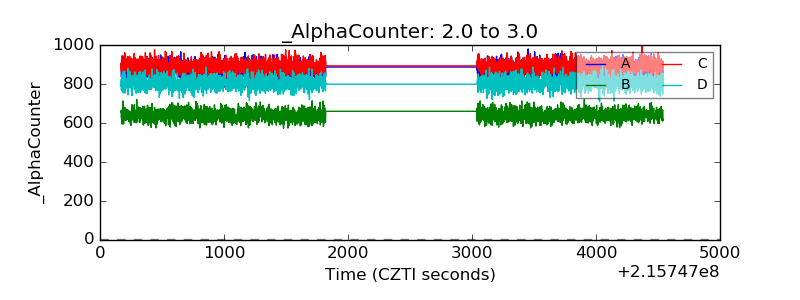 |
| _CPM_Rate | 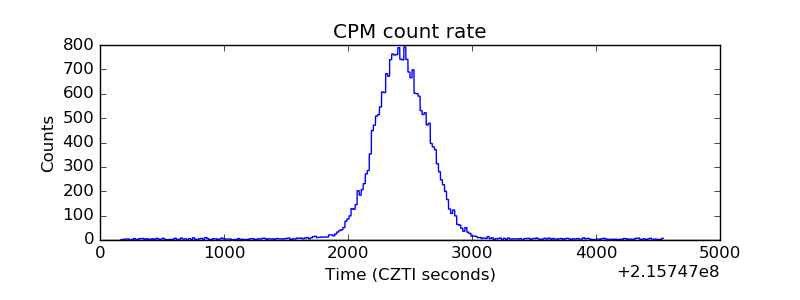 |
| CZT Counter | 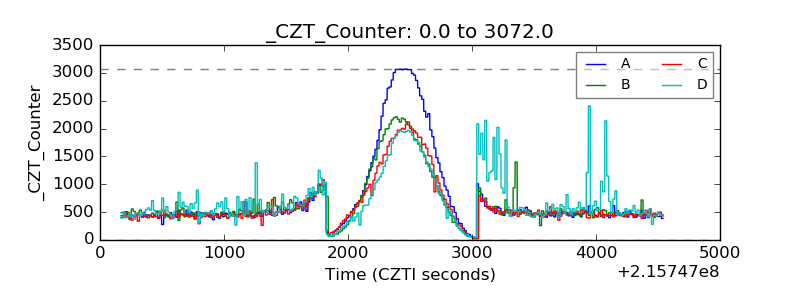 |
| +2.5 Volts monitor |  |
| +5 Volts monitor |  |
| _ROLL_ROT | 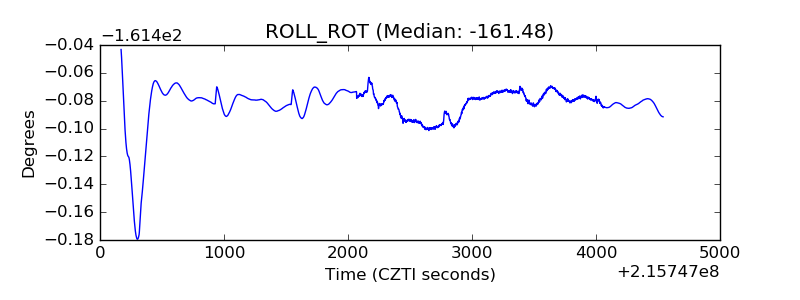 |
| _Roll_DEC | 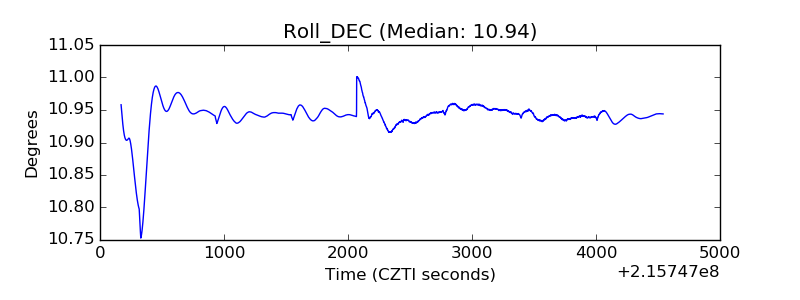 |
| _Roll_RA | 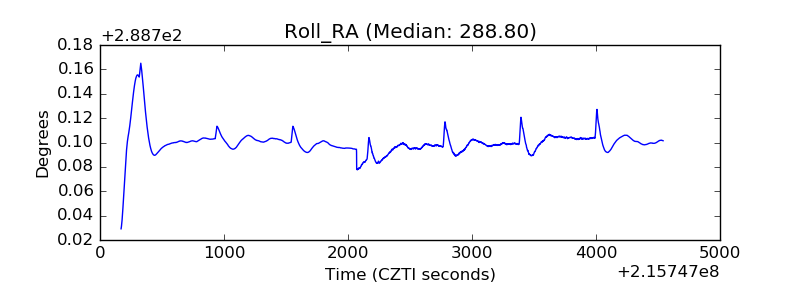 |
| Veto Counter | 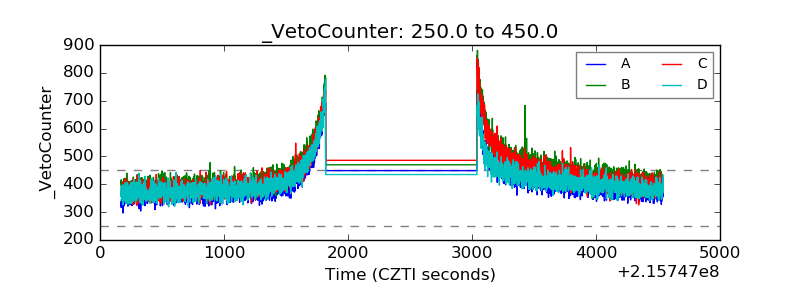 |