| Param | Original file | Final file |
|---|---|---|
| Filename | modeM0/AS1G06_027T01_9000000770_05936cztM0_level2.evt | modeM0/AS1G06_027T01_9000000770_05936cztM0_level2_quad_clean.evt |
| Size (bytes) | 476,913,600 | 70,084,800 |
| Size | 454.8 MB | 66.8 MB |
| Events in quadrant A | 3,085,358 | 421,304 |
| Events in quadrant B | 3,285,028 | 428,009 |
| Events in quadrant C | 3,034,153 | 423,081 |
| Events in quadrant D | 4,595,052 | 393,992 |
| Mode M0 | |||
|---|---|---|---|
| Quadrant | BADHDUFLAG | Total packets | Discarded packets |
| A | 0 | 13560 | 79 |
| B | 0 | 13938 | 70 |
| C | 0 | 13504 | 80 |
| D | 0 | 18124 | 137 |
| Mode M9 | |||
|---|---|---|---|
| Quadrant | BADHDUFLAG | Total packets | Discarded packets |
| A | 0 | 10 | 0 |
| B | 0 | 10 | 0 |
| C | 0 | 10 | 0 |
| D | 0 | 10 | 0 |
| Mode SS | |||
|---|---|---|---|
| Quadrant | BADHDUFLAG | Total packets | Discarded packets |
| A | 0 | 134 | 0 |
| B | 0 | 134 | 0 |
| C | 0 | 134 | 0 |
| D | 0 | 134 | 0 |
| Quadrant | Total seconds | Saturated seconds | Saturation percentage |
|---|---|---|---|
| A | 6528 | 91 | 1.393995% |
| B | 6534 | 115 | 1.760024% |
| C | 6526 | 76 | 1.164572% |
| D | 6525 | 129 | 1.977011% |
Noise dominated data is calculated using 1-second bins in cleaned event files. If a bin has >2000 counts, and if more than 50% of those come from <1% of pixels, then it is considered to be noise-dominated and hence unusable.
| Quadrant | # 1 sec bins | Bins with >0 counts | Bins with >2000 counts | High rate bins dominated by noise | Noise dominated (total time) | Noise dominated (detector-on time) | Marked lightcurve |
|---|---|---|---|---|---|---|---|
| A | 7576 | 6565 | 0 | 0 | 0.00% | 0.00% | 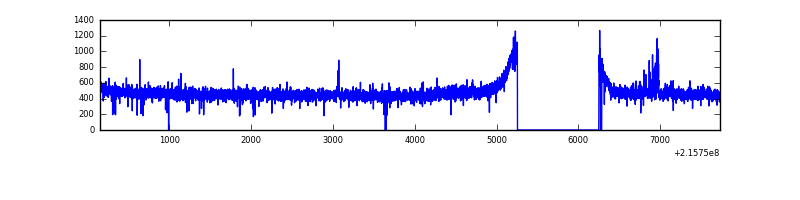 |
| B | 7576 | 6567 | 5 | 5 | 0.07% | 0.08% | 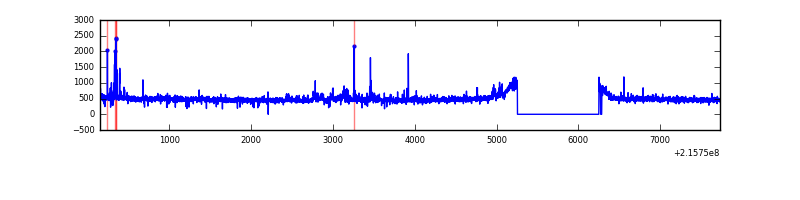 |
| C | 7576 | 6565 | 0 | 0 | 0.00% | 0.00% |  |
| D | 7576 | 6565 | 38 | 38 | 0.50% | 0.58% | 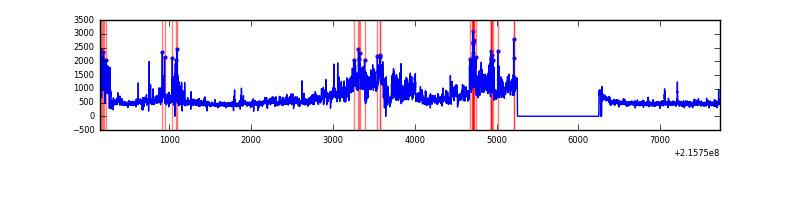 |
Top three noisy pixels from each quadrant. If the there are fewer than three noisy pixels in the level2.evt file, extra rows are filled as -1
| Pixel properties | Quadrant properties | ||||||
|---|---|---|---|---|---|---|---|
| Quadrant | DetID | PixID | Counts | Sigma | Mean | Median | Sigma |
| A | 7 | 16 | 21666 | 127.23 | 795 | 776 | 164.2 |
| A | 12 | 194 | 7711 | 42.24 | 795 | 776 | 164.2 |
| A | 0 | 226 | 7606 | 41.6 | 795 | 776 | 164.2 |
| B | 15 | 204 | 65432 | 414.74 | 804 | 786 | 155.9 |
| B | 15 | 85 | 29019 | 181.13 | 804 | 786 | 155.9 |
| B | 4 | 48 | 19374 | 119.25 | 804 | 786 | 155.9 |
| C | 9 | 68 | 20024 | 106.36 | 772 | 775 | 181.0 |
| C | 13 | 61 | 6294 | 30.5 | 772 | 775 | 181.0 |
| C | 1 | 16 | 2049 | 7.04 | 772 | 775 | 181.0 |
| D | 2 | 63 | 475056 | 2524.52 | 763 | 741 | 187.9 |
| D | 1 | 20 | 472228 | 2509.47 | 763 | 741 | 187.9 |
| D | 1 | 239 | 368464 | 1957.19 | 763 | 741 | 187.9 |
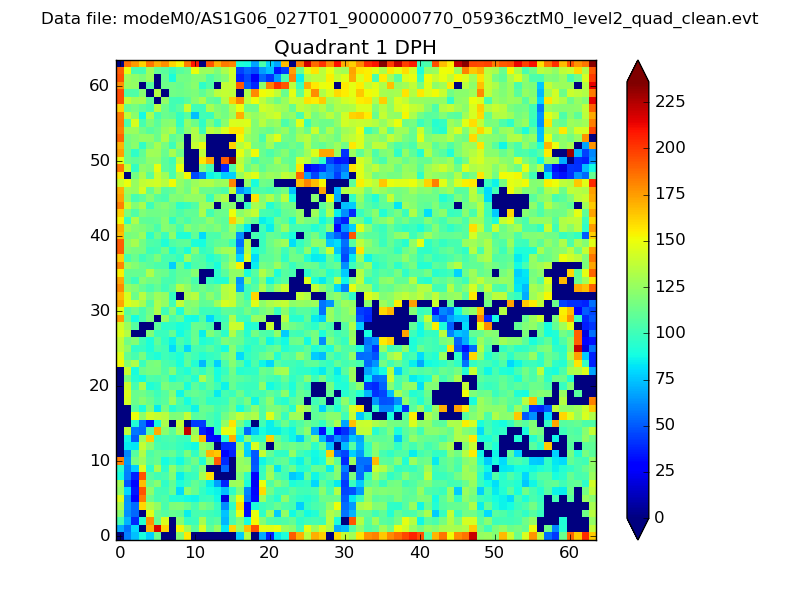
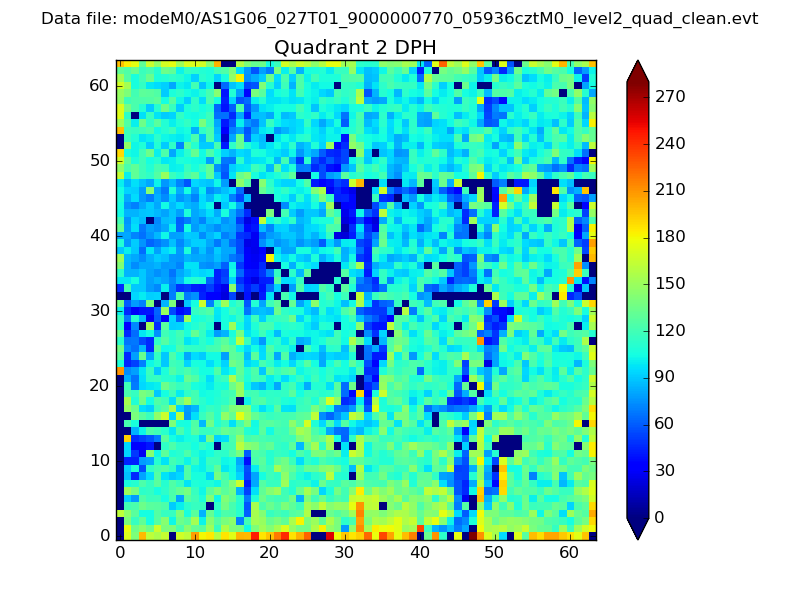
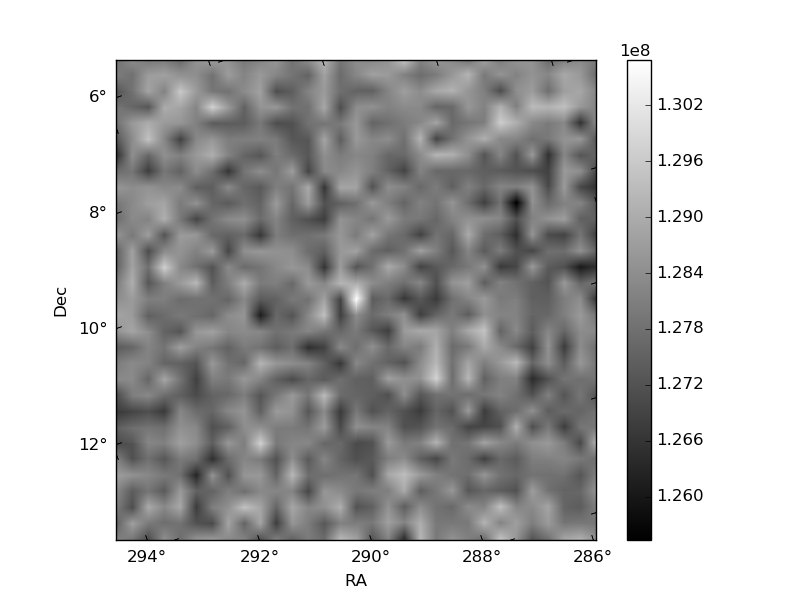
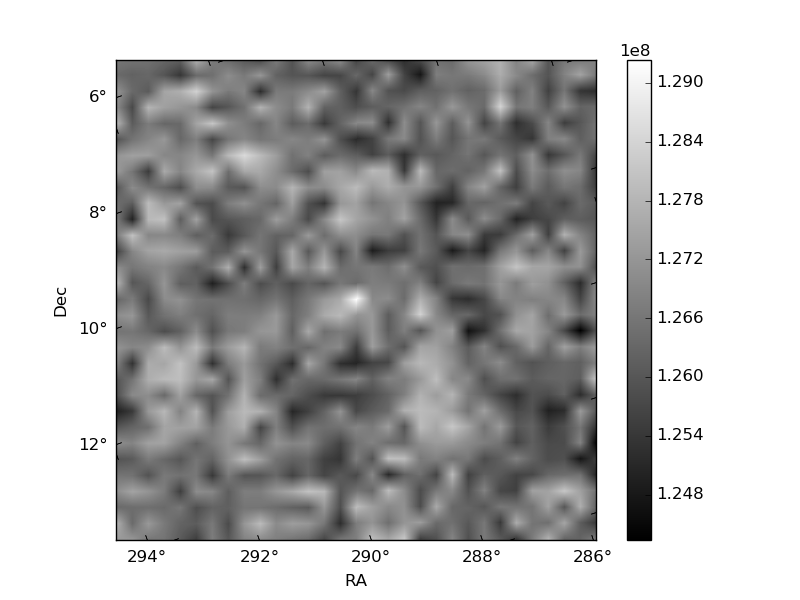
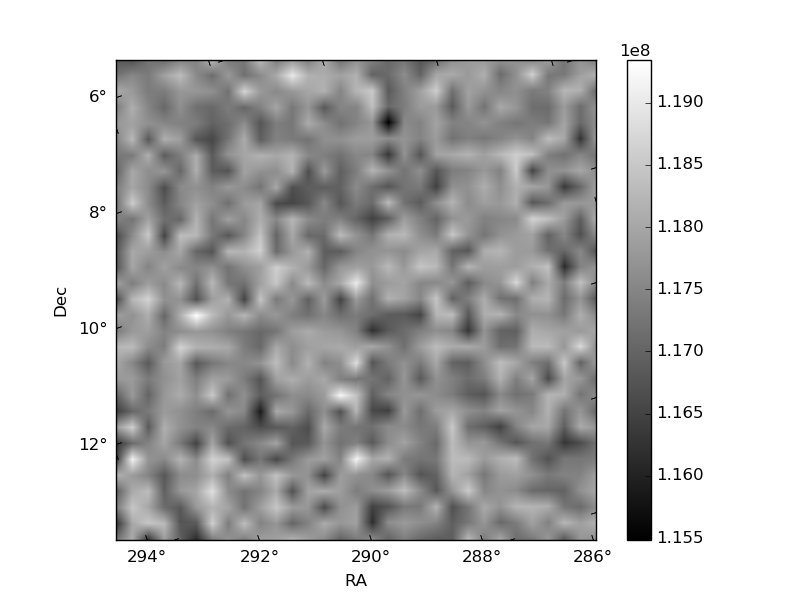
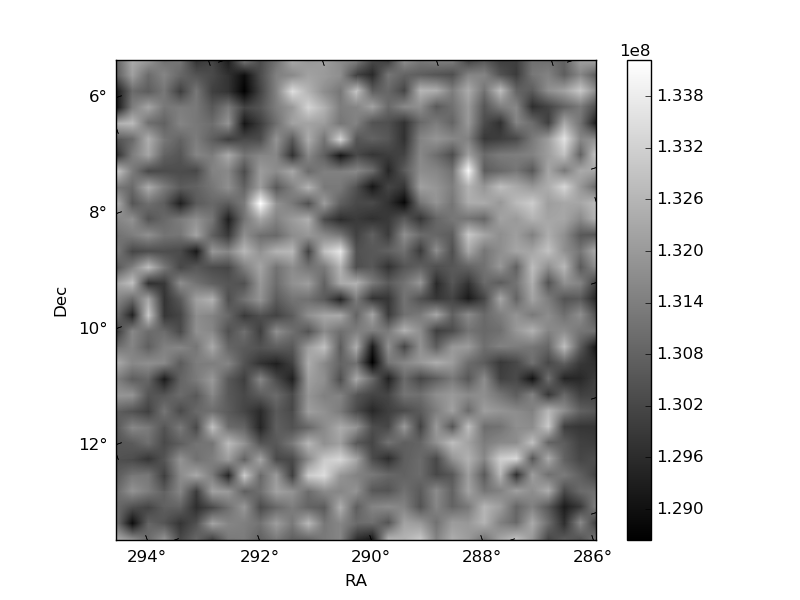
Histogram calculated using DETX and DETY for each event in the final _common_clean file
| Quadrant A | 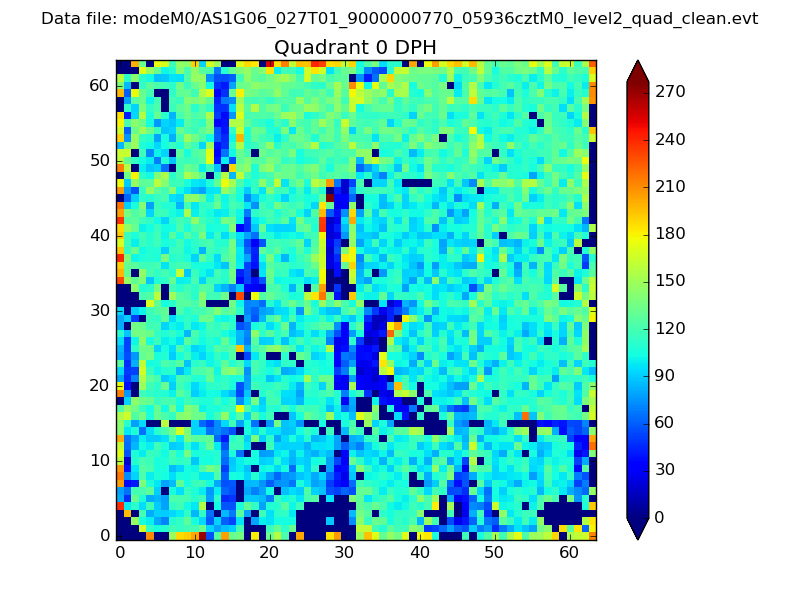 |
 |
Quadrant B |
|---|---|---|---|
| Quadrant D | 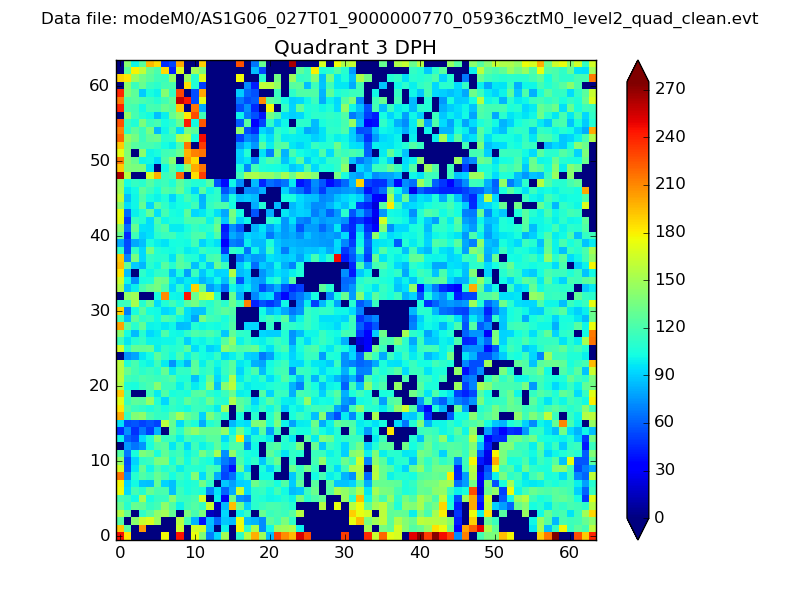 |
 |
Quadrant C |
| Plot type | Count rate plots | Images |
|---|---|---|
| Comparison with Poisson distribution Blue bars denote a histogram of data divided into 1 sec bins. Red curve is a Poisson curve with rate = median count rate of data. |
 |
 |
| Quadrant-wise count rates Data is divided into 100 sec bins |
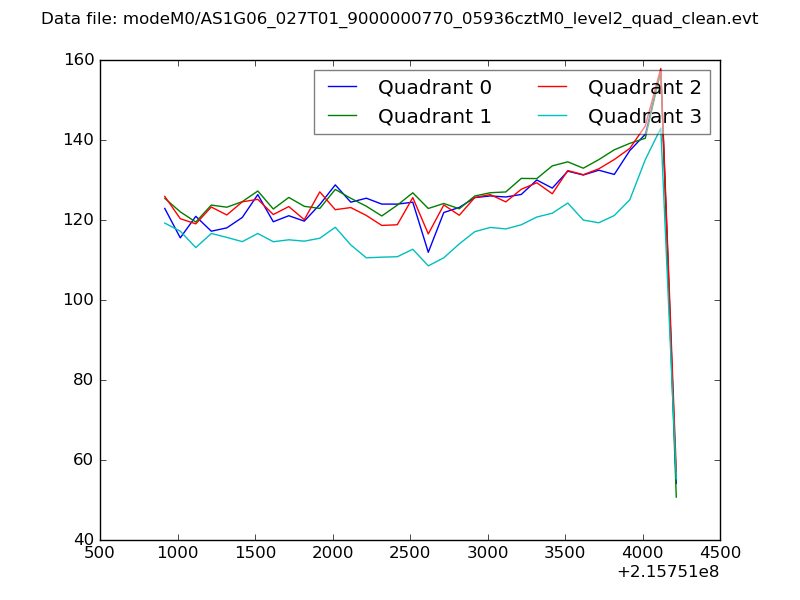 |
|
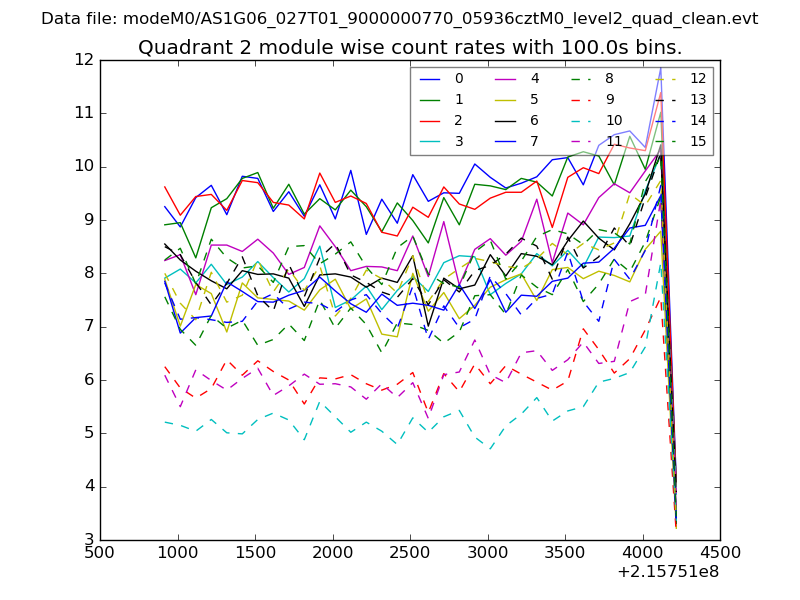
| Module-wise count rates for Quadrant A Data is divided into 100 sec bins |
 |
 |
| Module-wise count rates for Quadrant B Data is divided into 100 sec bins |
 |
 |
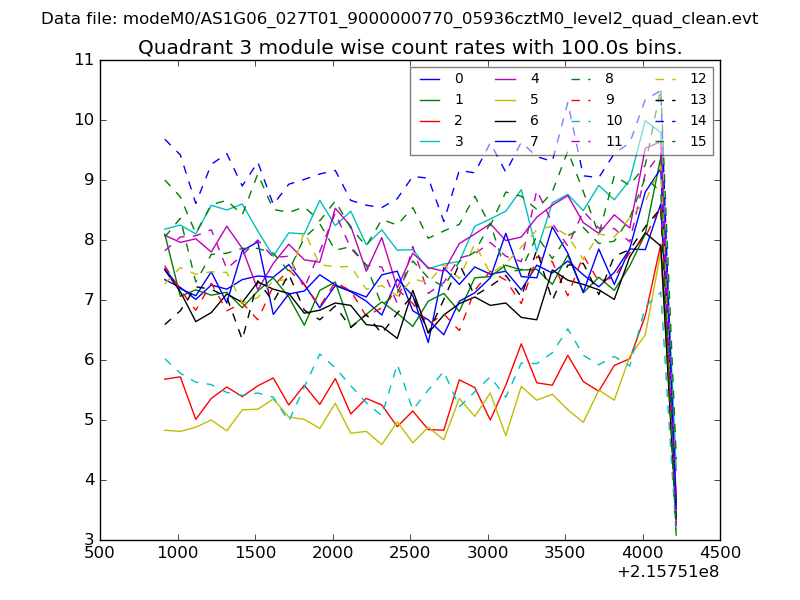
| Module-wise count rates for Quadrant C Data is divided into 100 sec bins |
 |
 |
| Module-wise count rates for Quadrant D Data is divided into 100 sec bins |
 |
 |
| Parameter | Plot |
|---|---|
| CZT HV Monitor | 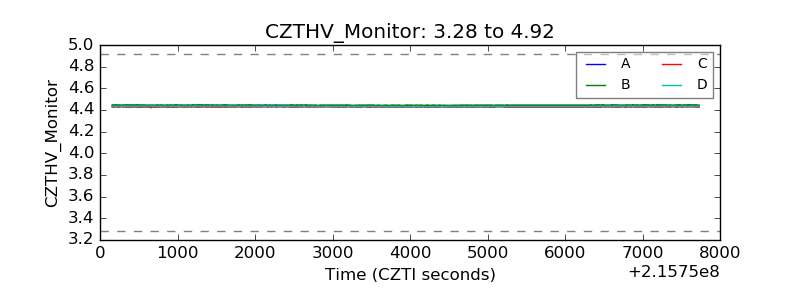 |
| D_VDD | 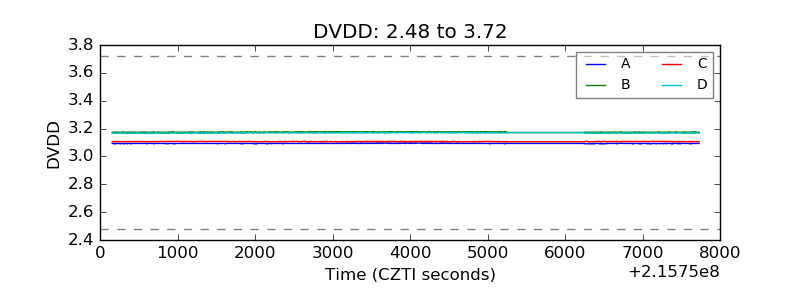 |
| Temperature 1 | 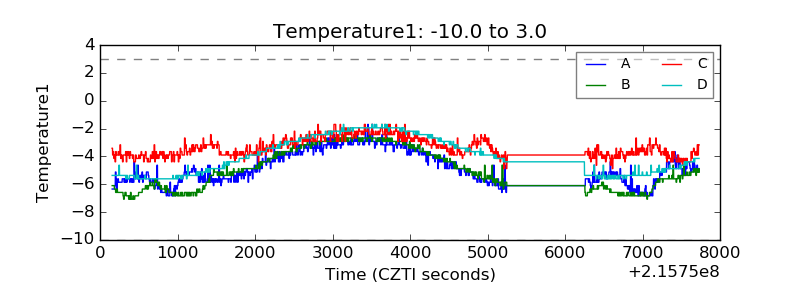 |
| Veto HV Monitor | 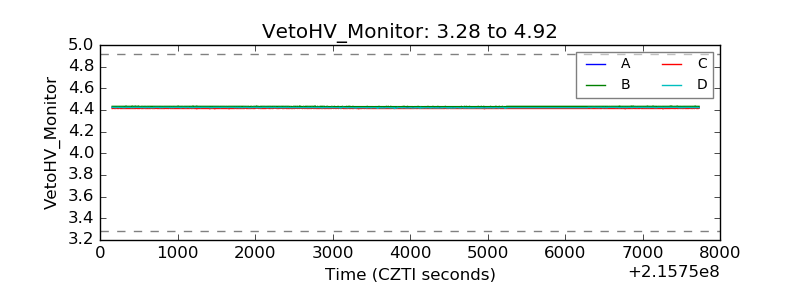 |
| Veto LLD | 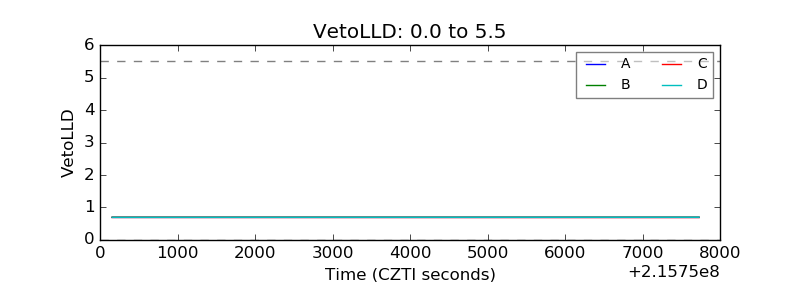 |
| Alpha Counter | 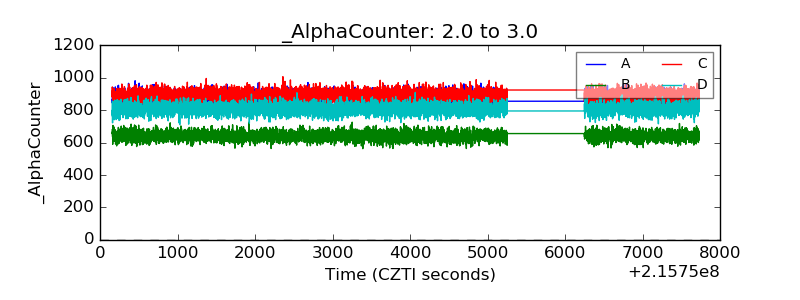 |
| _CPM_Rate | 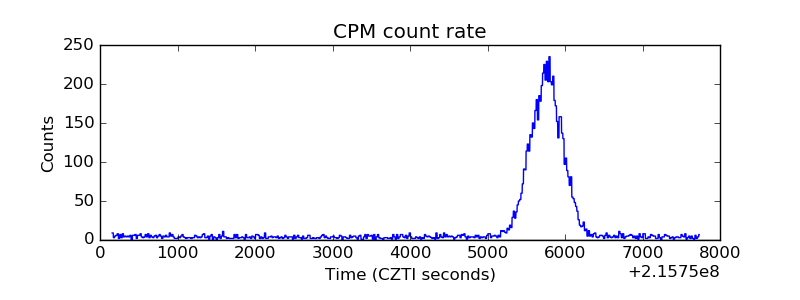 |
| CZT Counter | 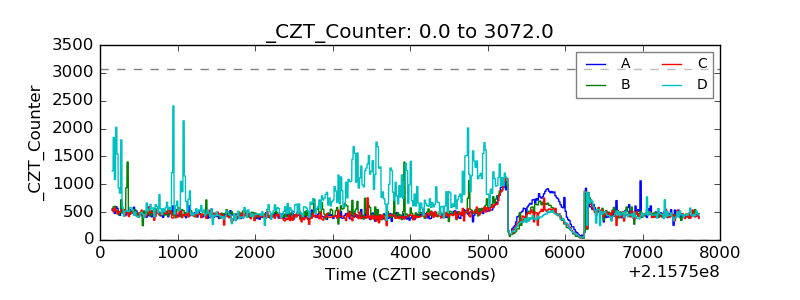 |
| +2.5 Volts monitor |  |
| +5 Volts monitor |  |
| _ROLL_ROT | 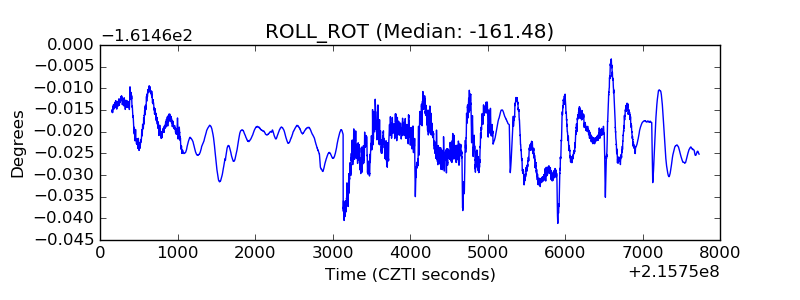 |
| _Roll_DEC | 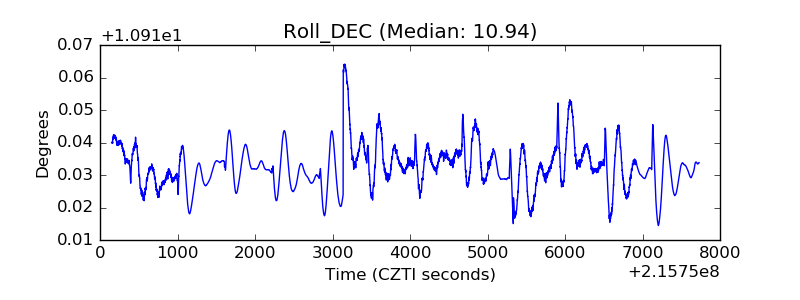 |
| _Roll_RA | 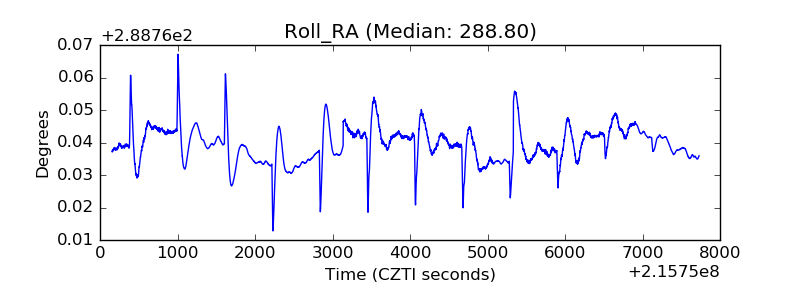 |
| Veto Counter | 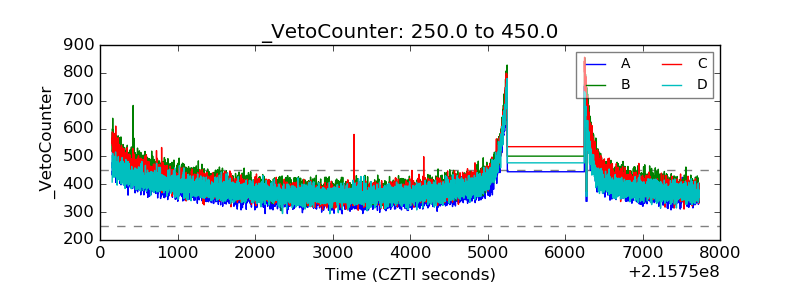 |