| Param | Original file | Final file |
|---|---|---|
| Filename | modeM0/AS1G06_027T01_9000000770_05937cztM0_level2.evt | modeM0/AS1G06_027T01_9000000770_05937cztM0_level2_quad_clean.evt |
| Size (bytes) | 490,331,520 | 65,580,480 |
| Size | 467.6 MB | 62.5 MB |
| Events in quadrant A | 3,020,359 | 406,025 |
| Events in quadrant B | 3,201,066 | 417,620 |
| Events in quadrant C | 3,000,263 | 418,673 |
| Events in quadrant D | 5,196,773 | 300,753 |
| Mode M0 | |||
|---|---|---|---|
| Quadrant | BADHDUFLAG | Total packets | Discarded packets |
| A | 0 | 14736 | 1449 |
| B | 0 | 15049 | 1526 |
| C | 0 | 14669 | 1373 |
| D | 0 | 25496 | 6065 |
| Mode M9 | |||
|---|---|---|---|
| Quadrant | BADHDUFLAG | Total packets | Discarded packets |
| A | 0 | 6 | 0 |
| B | 0 | 6 | 0 |
| C | 0 | 6 | 0 |
| D | 0 | 6 | 0 |
| Mode SS | |||
|---|---|---|---|
| Quadrant | BADHDUFLAG | Total packets | Discarded packets |
| A | 0 | 146 | 8 |
| B | 0 | 146 | 14 |
| C | 0 | 146 | 12 |
| D | 0 | 146 | 8 |
| Quadrant | Total seconds | Saturated seconds | Saturation percentage |
|---|---|---|---|
| A | 6400 | 161 | 2.515625% |
| B | 6413 | 187 | 2.915952% |
| C | 6442 | 112 | 1.738590% |
| D | 5957 | 846 | 14.201779% |
Noise dominated data is calculated using 1-second bins in cleaned event files. If a bin has >2000 counts, and if more than 50% of those come from <1% of pixels, then it is considered to be noise-dominated and hence unusable.
| Quadrant | # 1 sec bins | Bins with >0 counts | Bins with >2000 counts | High rate bins dominated by noise | Noise dominated (total time) | Noise dominated (detector-on time) | Marked lightcurve |
|---|---|---|---|---|---|---|---|
| A | 7729 | 6925 | 0 | 0 | 0.00% | 0.00% | 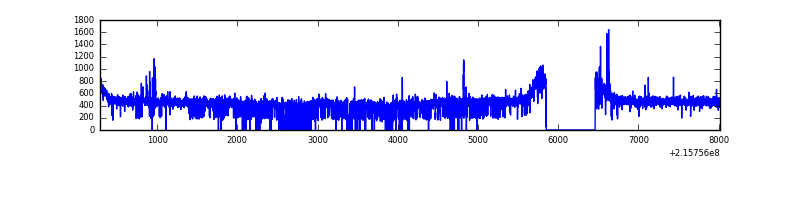 |
| B | 7729 | 6944 | 0 | 0 | 0.00% | 0.00% | 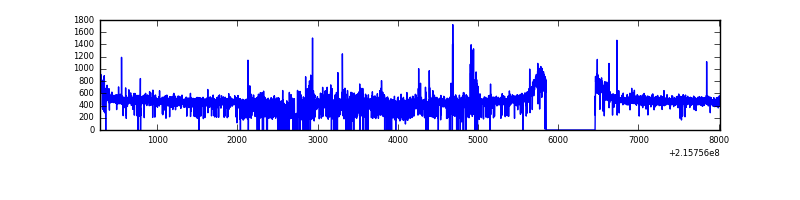 |
| C | 7729 | 6950 | 0 | 0 | 0.00% | 0.00% | 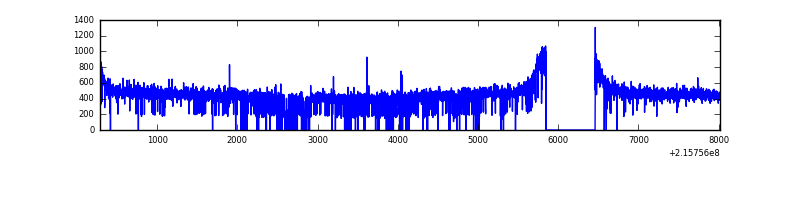 |
| D | 7729 | 6573 | 552 | 552 | 7.14% | 8.40% | 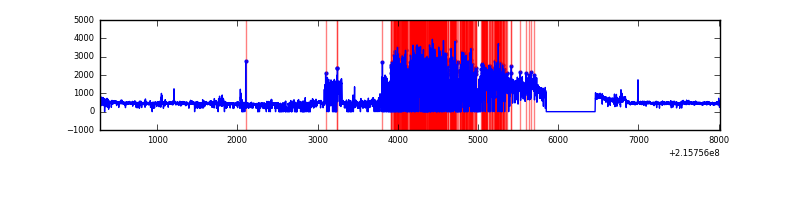 |
Top three noisy pixels from each quadrant. If the there are fewer than three noisy pixels in the level2.evt file, extra rows are filled as -1
| Pixel properties | Quadrant properties | ||||||
|---|---|---|---|---|---|---|---|
| Quadrant | DetID | PixID | Counts | Sigma | Mean | Median | Sigma |
| A | 7 | 16 | 27880 | 168.94 | 775 | 758 | 160.5 |
| A | 4 | 2 | 9515 | 54.55 | 775 | 758 | 160.5 |
| A | 12 | 194 | 7459 | 41.74 | 775 | 758 | 160.5 |
| B | 15 | 204 | 57306 | 369.04 | 785 | 766 | 153.2 |
| B | 4 | 80 | 23949 | 151.32 | 785 | 766 | 153.2 |
| B | 15 | 255 | 20646 | 129.76 | 785 | 766 | 153.2 |
| C | 9 | 68 | 24145 | 129.89 | 762 | 767 | 180.0 |
| C | 13 | 61 | 6160 | 29.97 | 762 | 767 | 180.0 |
| C | 1 | 16 | 2709 | 10.79 | 762 | 767 | 180.0 |
| D | 1 | 20 | 1588620 | 9460.79 | 674 | 654 | 167.8 |
| D | 1 | 239 | 731891 | 4356.57 | 674 | 654 | 167.8 |
| D | 8 | 195 | 156136 | 926.33 | 674 | 654 | 167.8 |
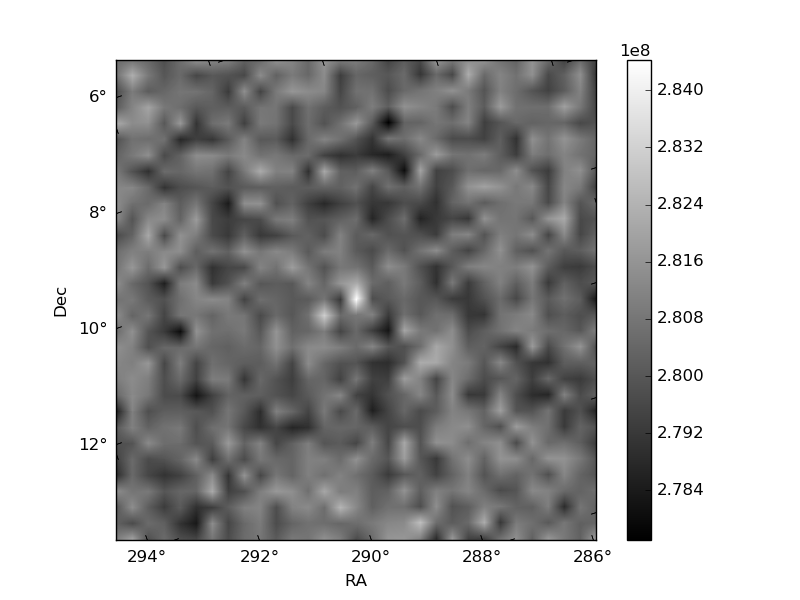
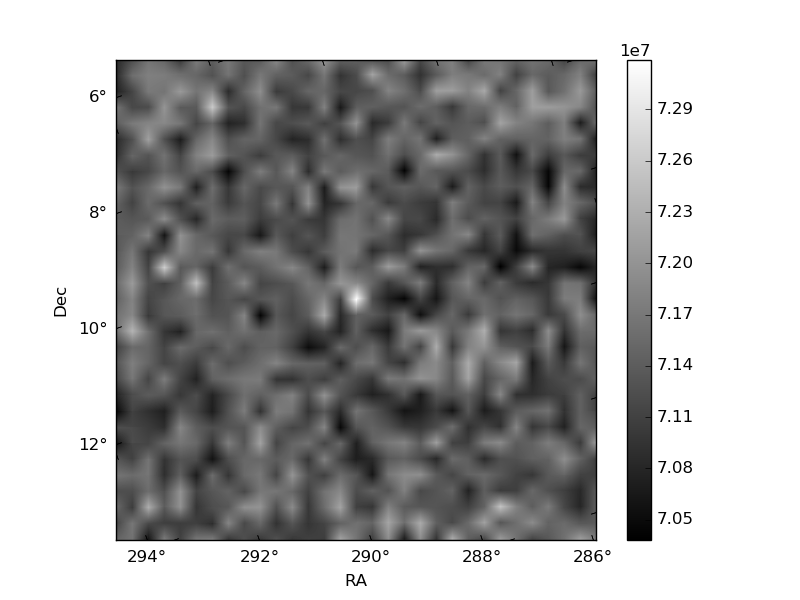
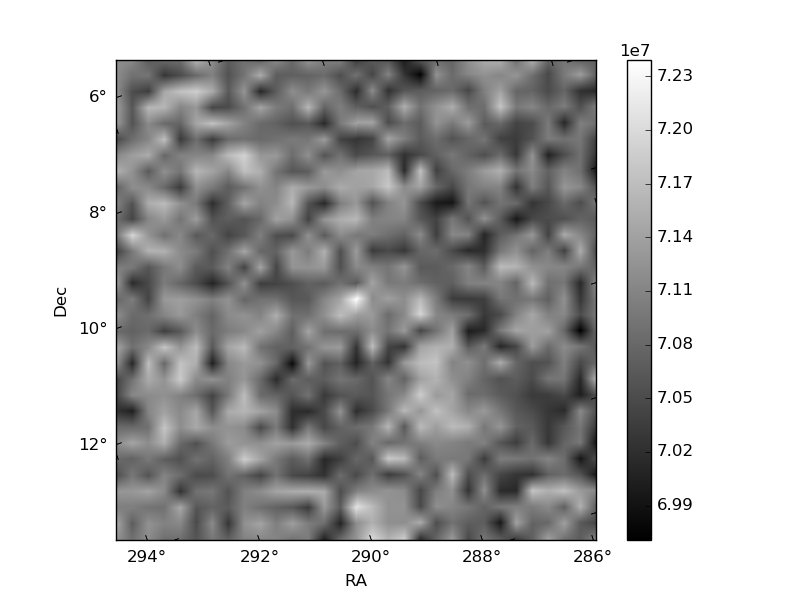
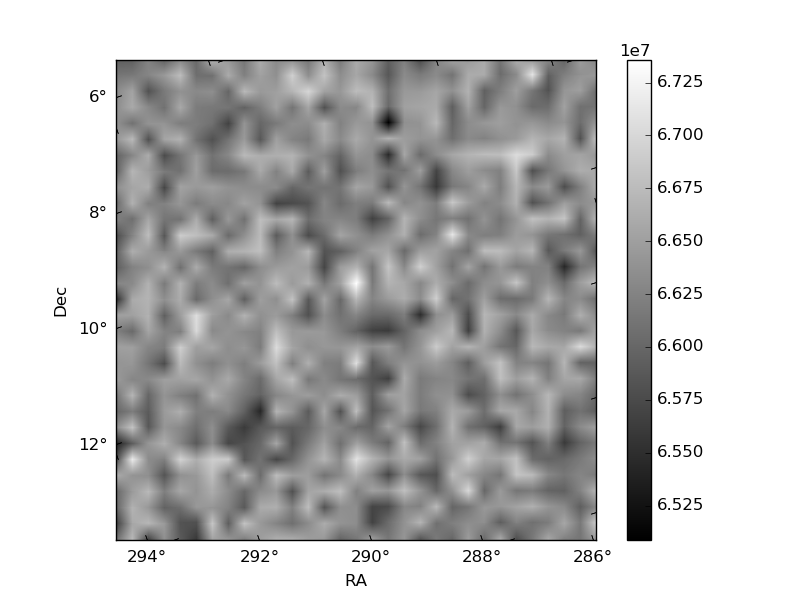
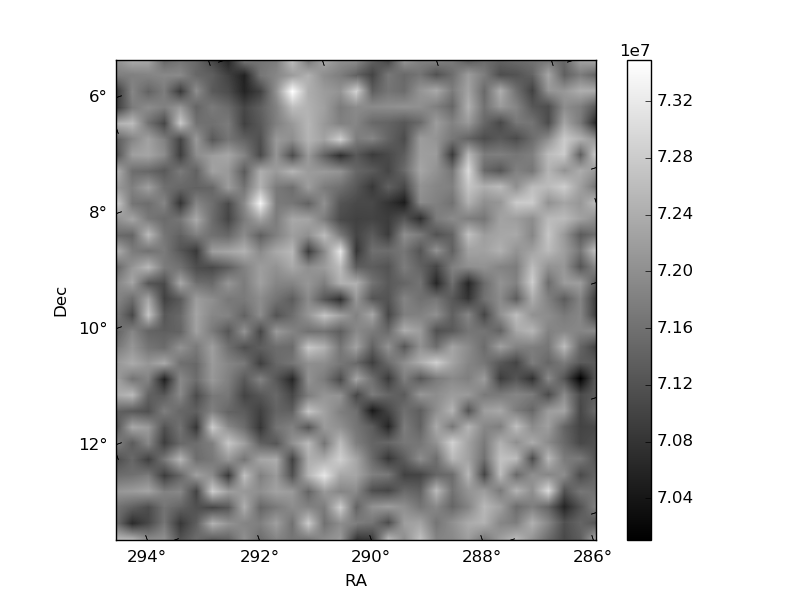
Histogram calculated using DETX and DETY for each event in the final _common_clean file
| Quadrant A | 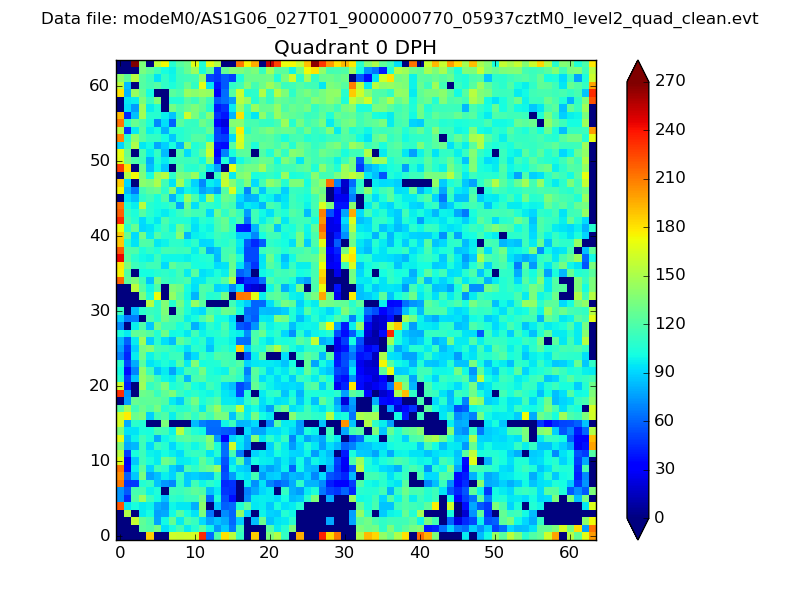 |
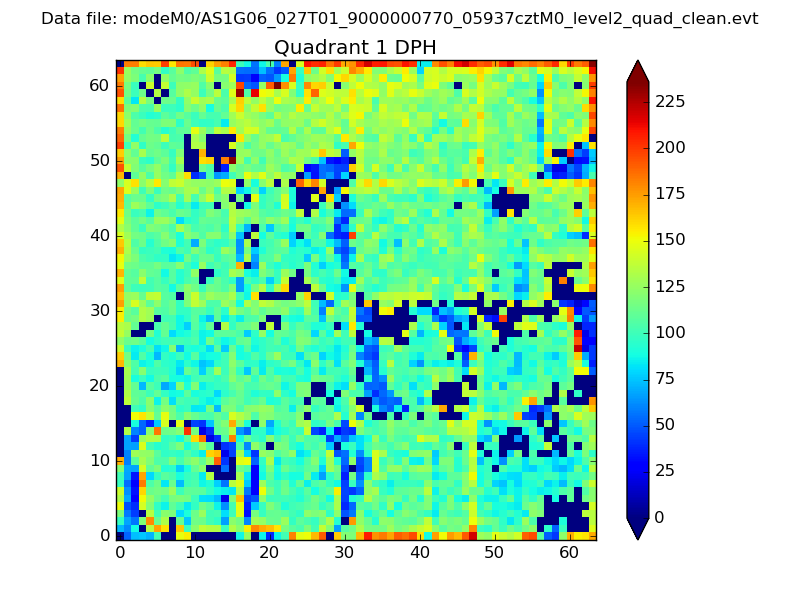 |
Quadrant B |
|---|---|---|---|
| Quadrant D | 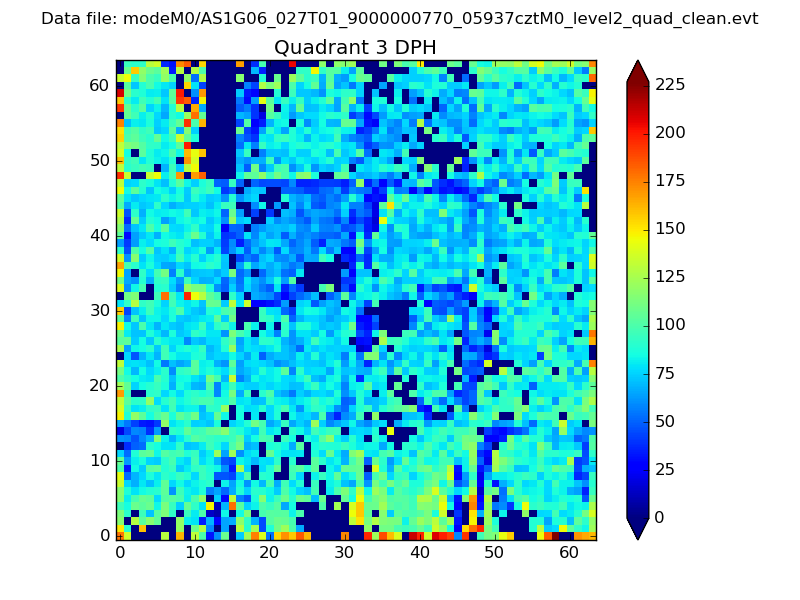 |
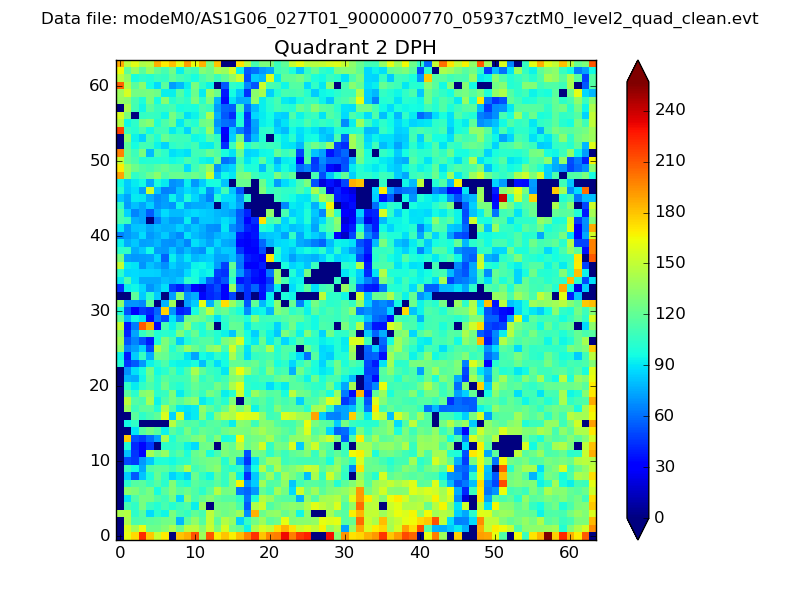 |
Quadrant C |
| Plot type | Count rate plots | Images |
|---|---|---|
| Comparison with Poisson distribution Blue bars denote a histogram of data divided into 1 sec bins. Red curve is a Poisson curve with rate = median count rate of data. |
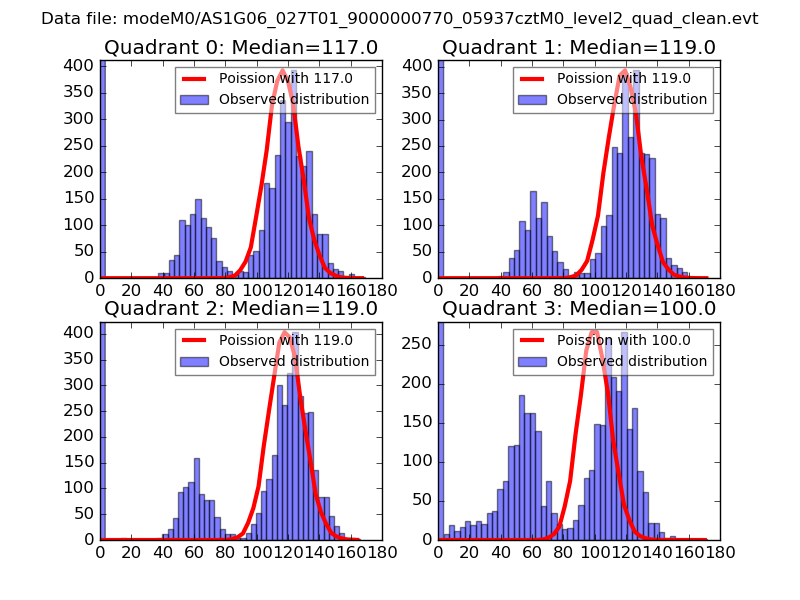 |
 |
| Quadrant-wise count rates Data is divided into 100 sec bins |
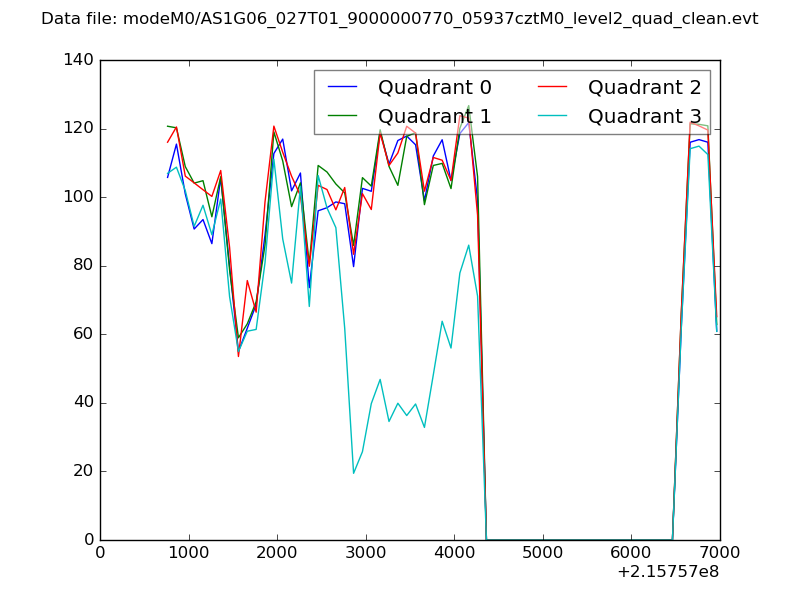 |
|
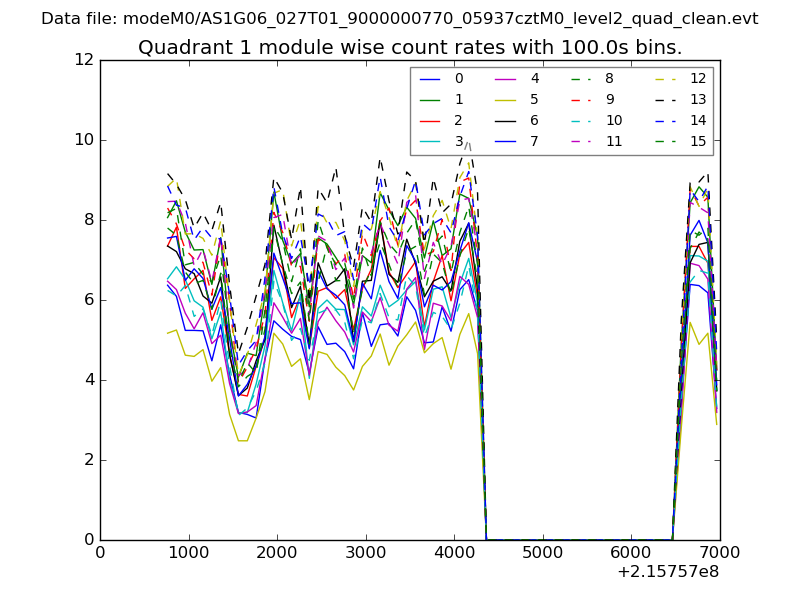
| Module-wise count rates for Quadrant A Data is divided into 100 sec bins |
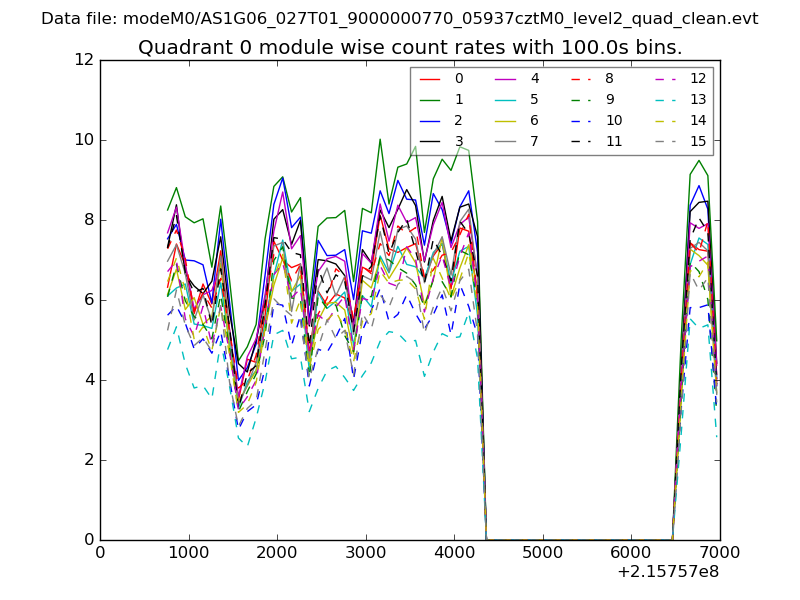 |
 |
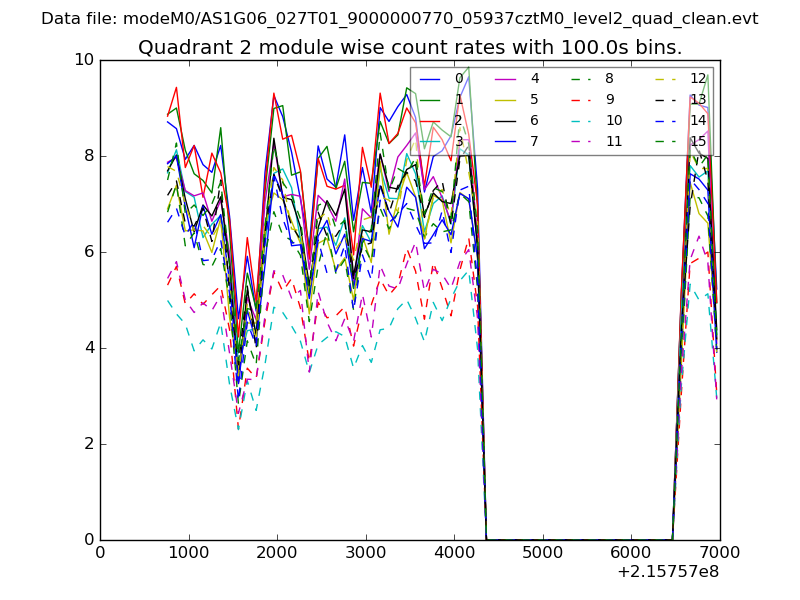
| Module-wise count rates for Quadrant B Data is divided into 100 sec bins |
 |
 |
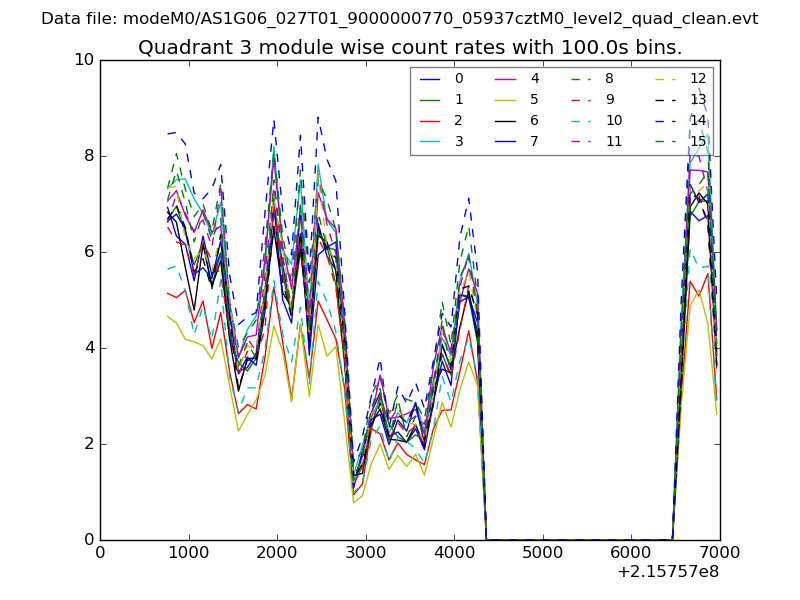
| Module-wise count rates for Quadrant C Data is divided into 100 sec bins |
 |
 |
| Module-wise count rates for Quadrant D Data is divided into 100 sec bins |
 |
 |
| Parameter | Plot |
|---|---|
| CZT HV Monitor | 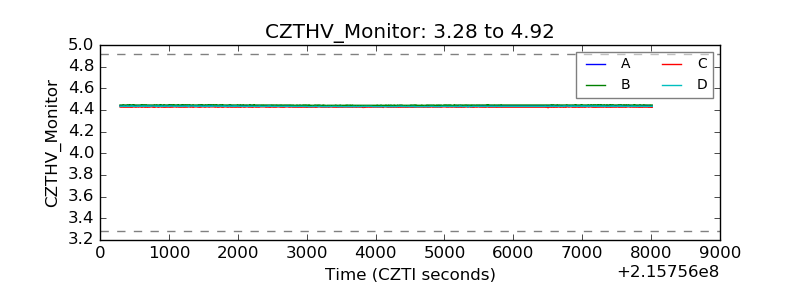 |
| D_VDD | 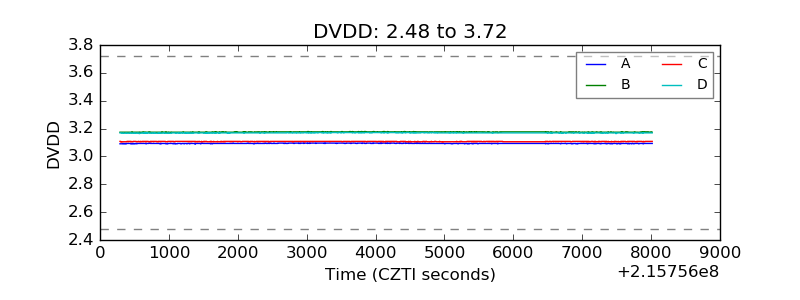 |
| Temperature 1 | 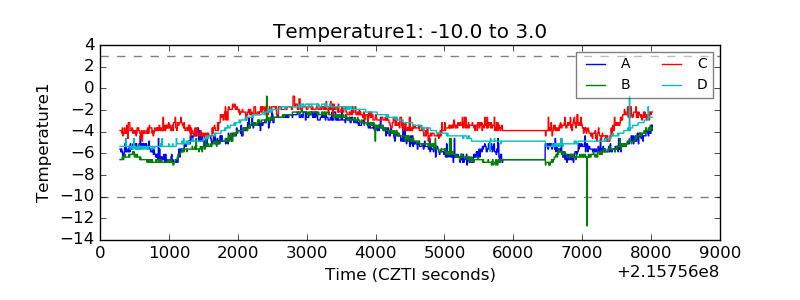 |
| Veto HV Monitor | 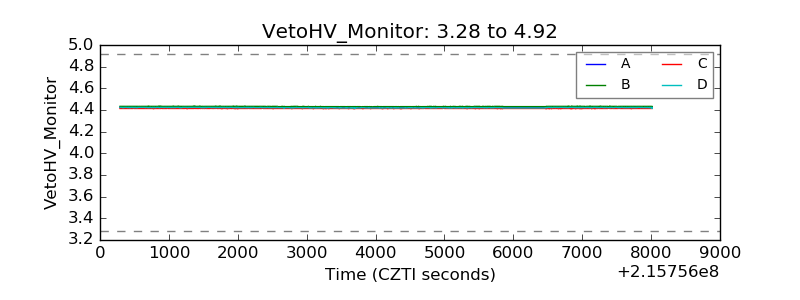 |
| Veto LLD | 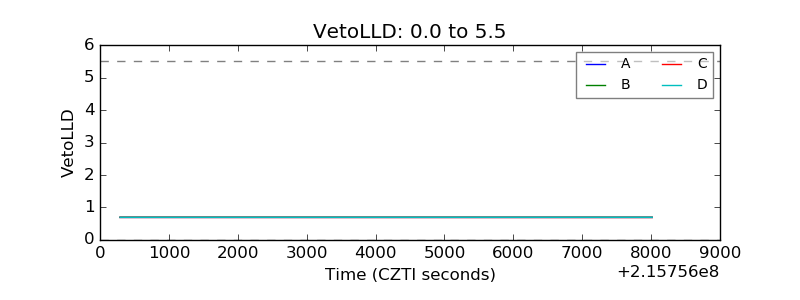 |
| Alpha Counter | 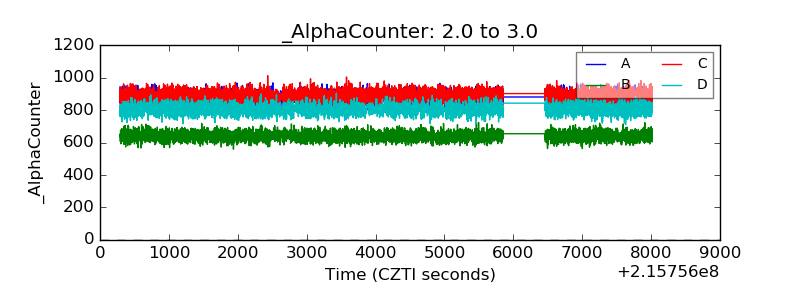 |
| _CPM_Rate | 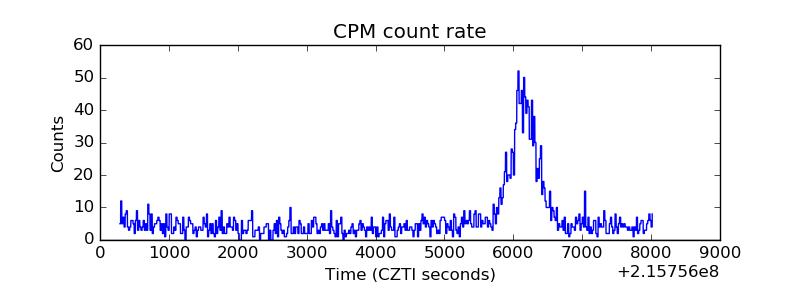 |
| CZT Counter | 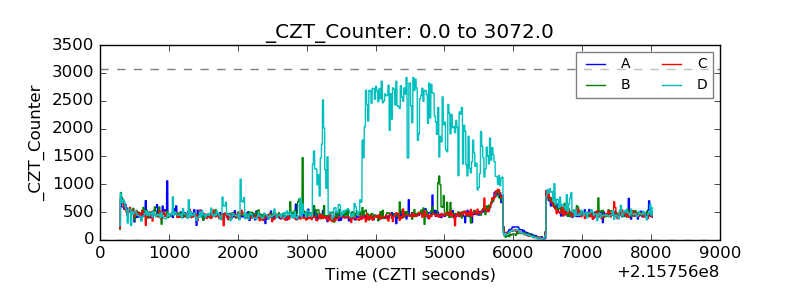 |
| +2.5 Volts monitor |  |
| +5 Volts monitor |  |
| _ROLL_ROT | 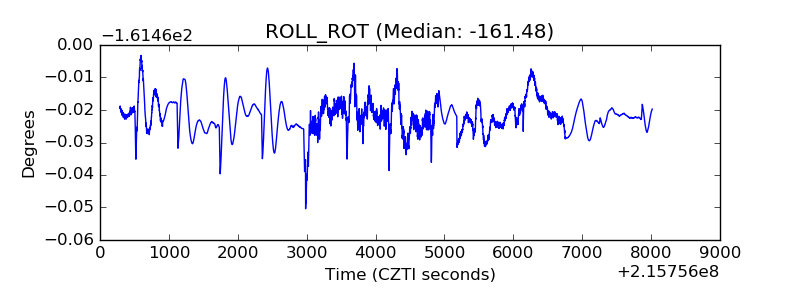 |
| _Roll_DEC | 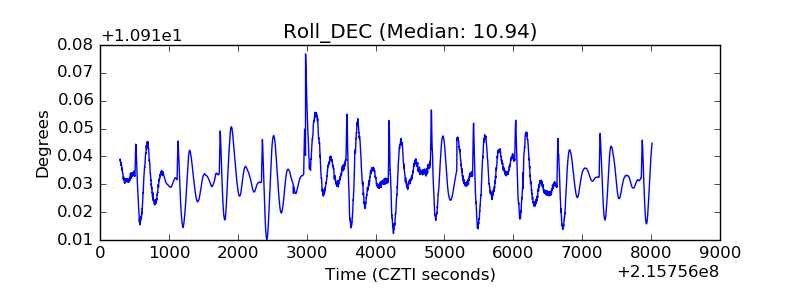 |
| _Roll_RA | 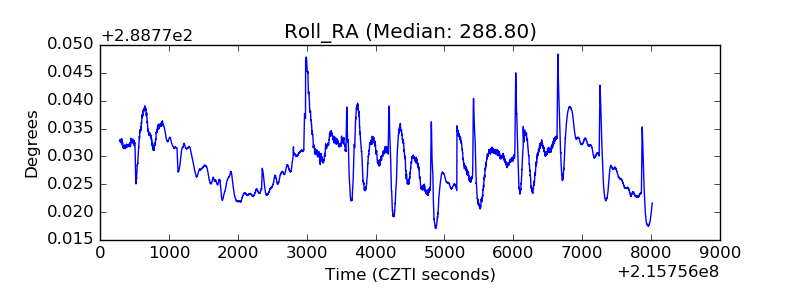 |
| Veto Counter | 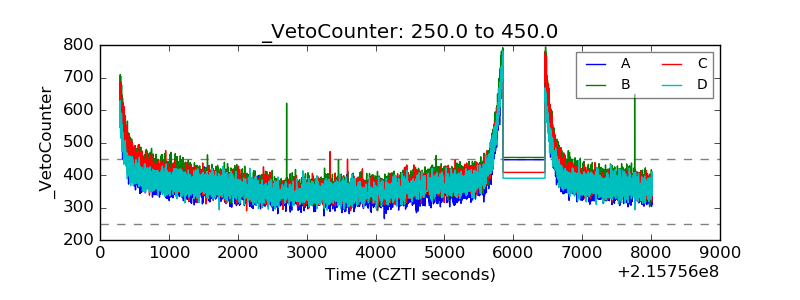 |