| Param | Original file | Final file |
|---|---|---|
| Filename | modeM0/AS1G06_157T01_9000000772cztM0_level2.fits | modeM0/AS1G06_157T01_9000000772cztM0_level2_quad_clean.evt |
| Size (bytes) | 674,254,080 | 710,709,120 |
| Size | 643.0 MB | 677.8 MB |
| Events in quadrant A | 4,305,995 | 4,546,161 |
| Events in quadrant B | 3,708,403 | 4,040,125 |
| Events in quadrant C | 4,098,516 | 4,053,286 |
| Events in quadrant D | 2,668,556 | 3,257,483 |
| Mode M9 | |||
|---|---|---|---|
| Quadrant | BADHDUFLAG | Total packets | Discarded packets |
| A | 0 | 137 | 0 |
| B | 0 | 134 | 0 |
| C | 0 | 138 | 0 |
| D | 0 | 138 | 0 |
| Mode M0 | |||
|---|---|---|---|
| Quadrant | BADHDUFLAG | Total packets | Discarded packets |
| A | 0 | 187586 | 0 |
| B | 0 | 170584 | 0 |
| C | 0 | 237203 | 0 |
| D | 0 | 217531 | 0 |
| Mode SS | |||
|---|---|---|---|
| Quadrant | BADHDUFLAG | Total packets | Discarded packets |
| A | 0 | 1700 | 0 |
| B | 0 | 1700 | 0 |
| C | 0 | 1702 | 0 |
| D | 0 | 1708 | 0 |
| Quadrant | Total seconds | Saturated seconds | Saturation percentage |
|---|---|---|---|
| A | 81894 | 1853 | 2.262681% |
| B | 82388 | 980 | 1.189494% |
| C | 82453 | 9550 | 11.582356% |
| D | 80894 | 4957 | 6.127772% |
Noise dominated data is calculated using 1-second bins in cleaned event files. If a bin has >2000 counts, and if more than 50% of those come from <1% of pixels, then it is considered to be noise-dominated and hence unusable.
| Quadrant | # 1 sec bins | Bins with >0 counts | Bins with >2000 counts | High rate bins dominated by noise | Noise dominated (total time) | Noise dominated (detector-on time) | Marked lightcurve |
|---|---|---|---|---|---|---|---|
| A | 105624 | 85442 | 0 | 0 | 0.00% | 0.00% | 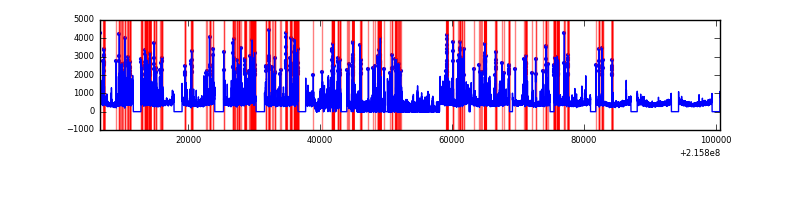 |
| B | 105624 | 85870 | 0 | 0 | 0.00% | 0.00% | 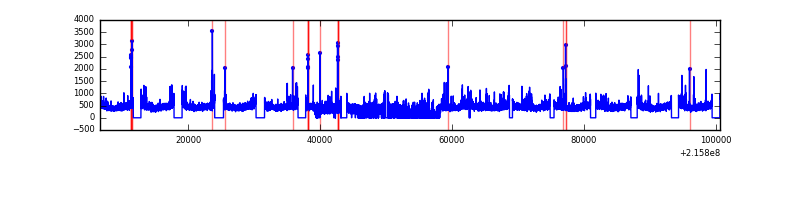 |
| C | 105625 | 85728 | 0 | 0 | 0.00% | 0.00% | 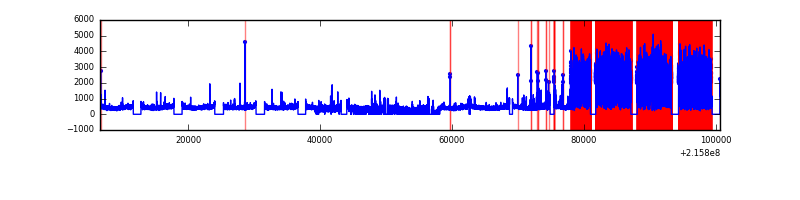 |
| D | 105625 | 83963 | 0 | 0 | 0.00% | 0.00% | 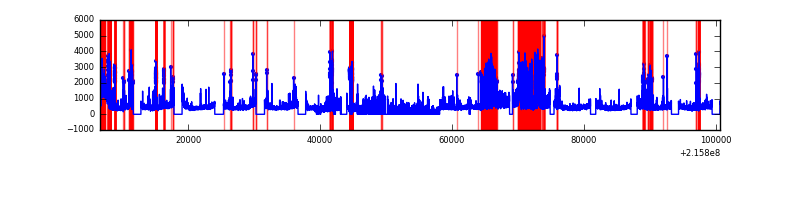 |
Top three noisy pixels from each quadrant. If the there are fewer than three noisy pixels in the level2.evt file, extra rows are filled as -1
| Pixel properties | Quadrant properties | ||||||
|---|---|---|---|---|---|---|---|
| Quadrant | DetID | PixID | Counts | Sigma | Mean | Median | Sigma |
| A | 14 | 188 | 4318 | 11.45 | 1117 | 1041 | 286.2 |
| A | 0 | 29 | 4212 | 11.08 | 1117 | 1041 | 286.2 |
| A | 7 | 110 | 3718 | 9.35 | 1117 | 1041 | 286.2 |
| B | 2 | 9 | 3070 | 11.1 | 978 | 932 | 192.7 |
| B | 14 | 254 | 2620 | 8.76 | 978 | 932 | 192.7 |
| B | 12 | 226 | 2583 | 8.57 | 978 | 932 | 192.7 |
| C | 1 | 81 | 2969 | 6.8 | 1083 | 1002 | 289.1 |
| C | 12 | 241 | 2954 | 6.75 | 1083 | 1002 | 289.1 |
| C | 1 | 80 | 2930 | 6.67 | 1083 | 1002 | 289.1 |
| D | 6 | 231 | 2003 | 7.13 | 761 | 703 | 182.2 |
| D | 11 | 82 | 1908 | 6.61 | 761 | 703 | 182.2 |
| D | 6 | 83 | 1906 | 6.6 | 761 | 703 | 182.2 |
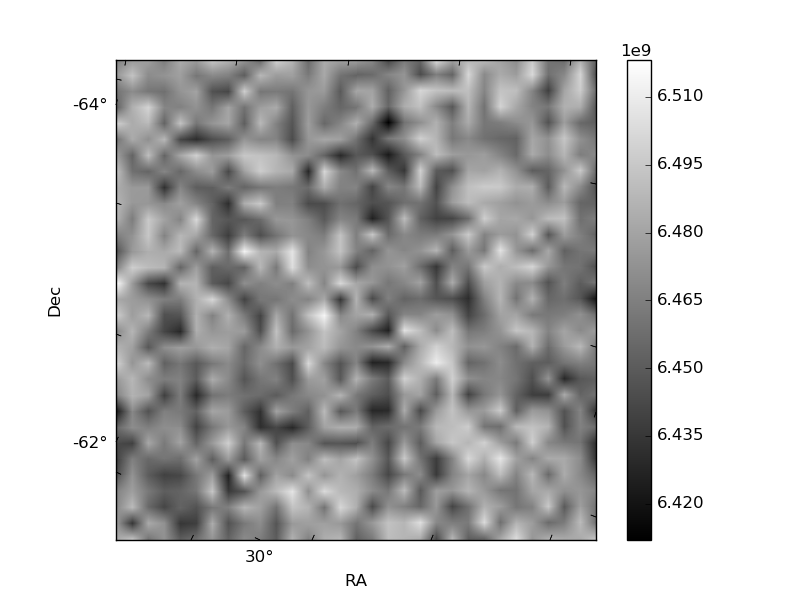
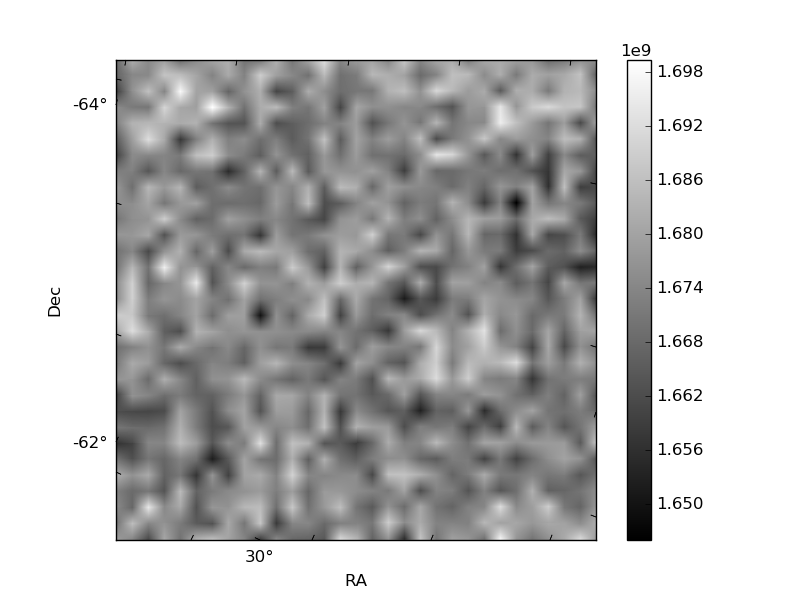
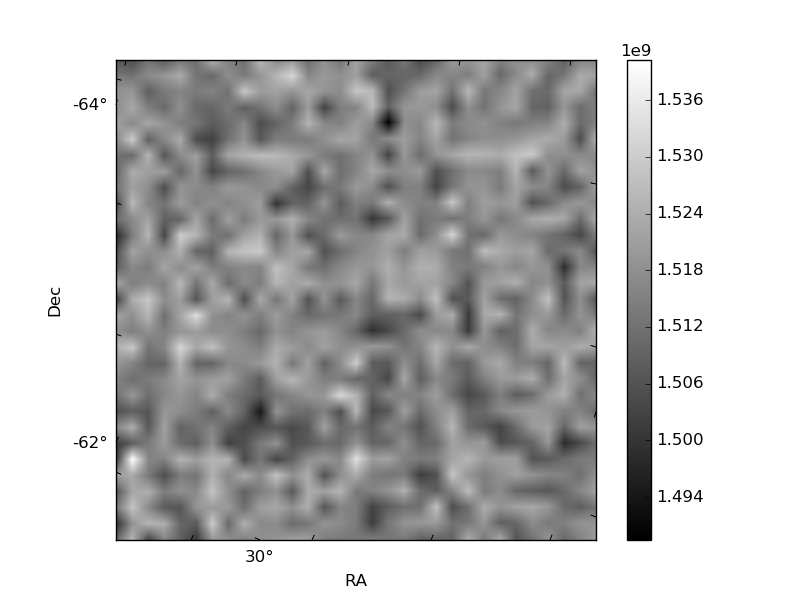
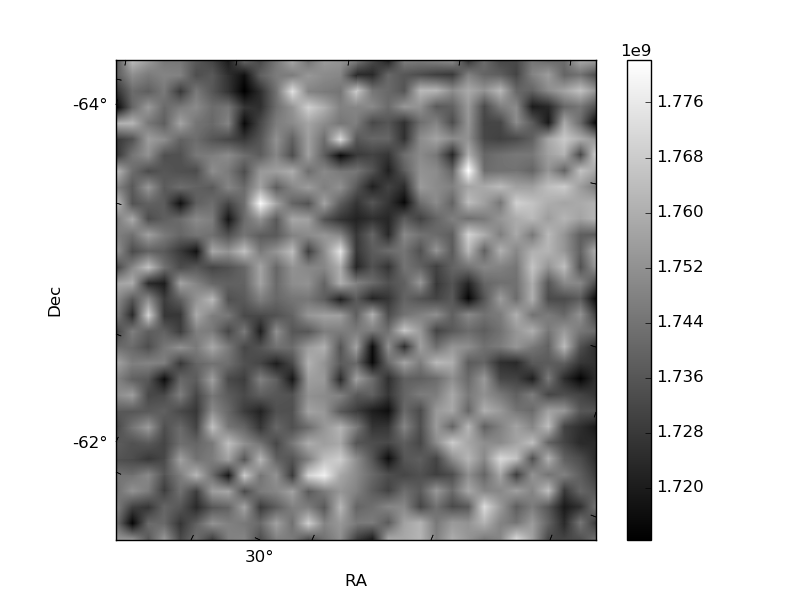
Histogram calculated using DETX and DETY for each event in the final _common_clean file
| Quadrant A | 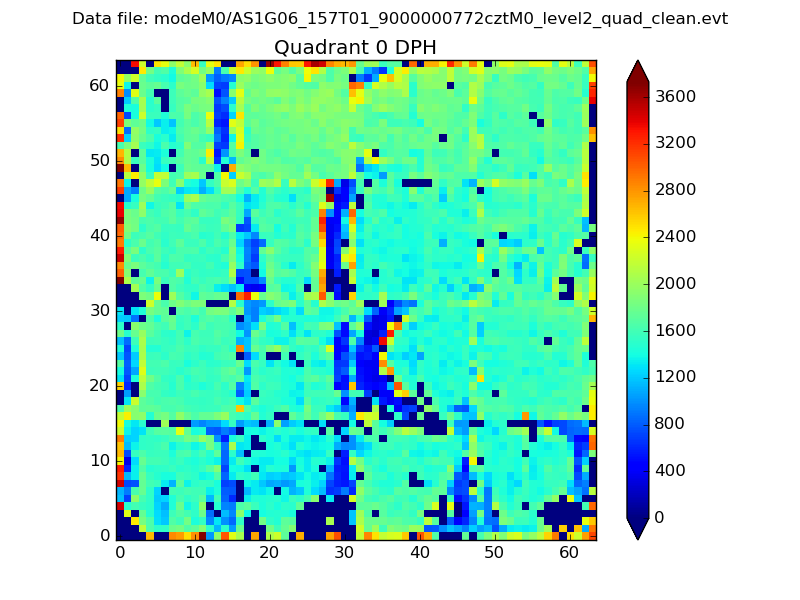 |
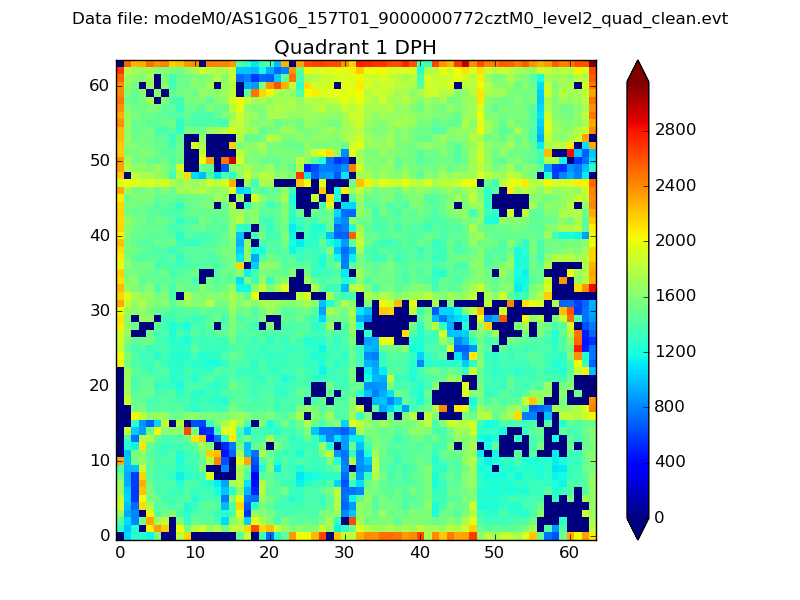 |
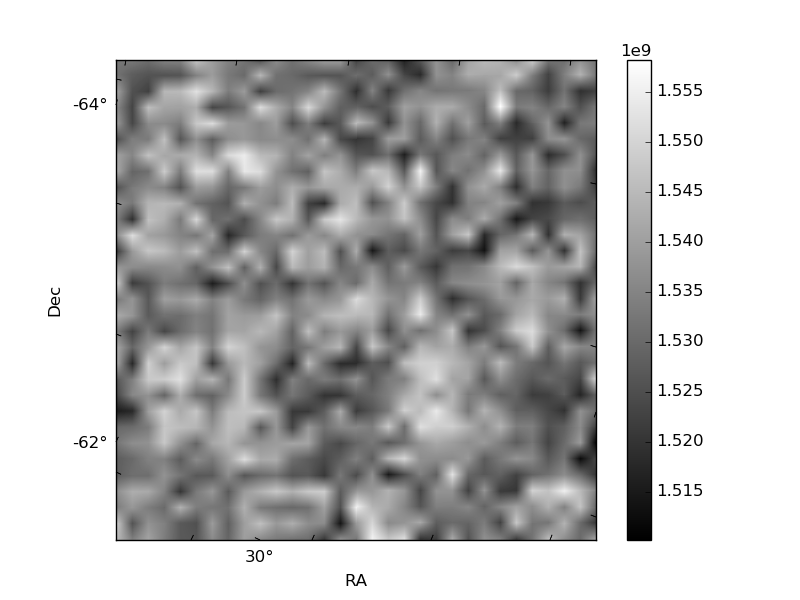
Quadrant B |
|---|---|---|---|
| Quadrant D | 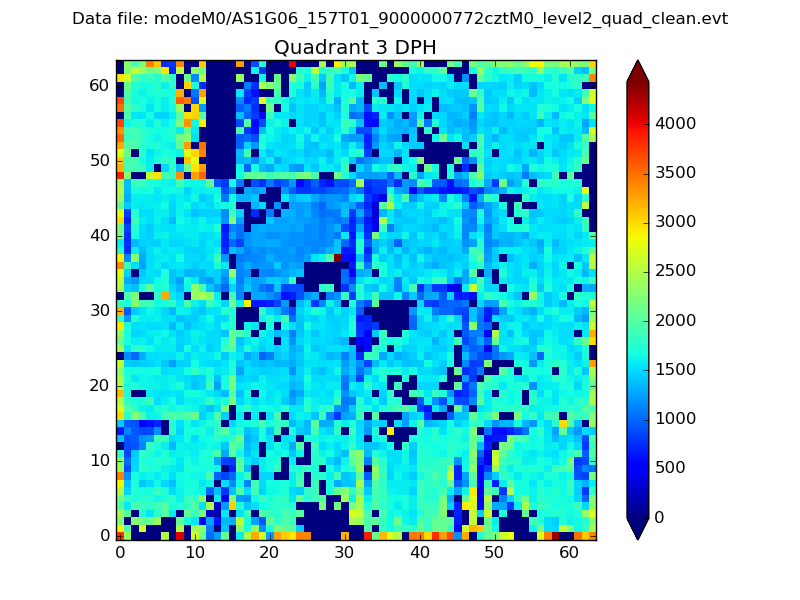 |
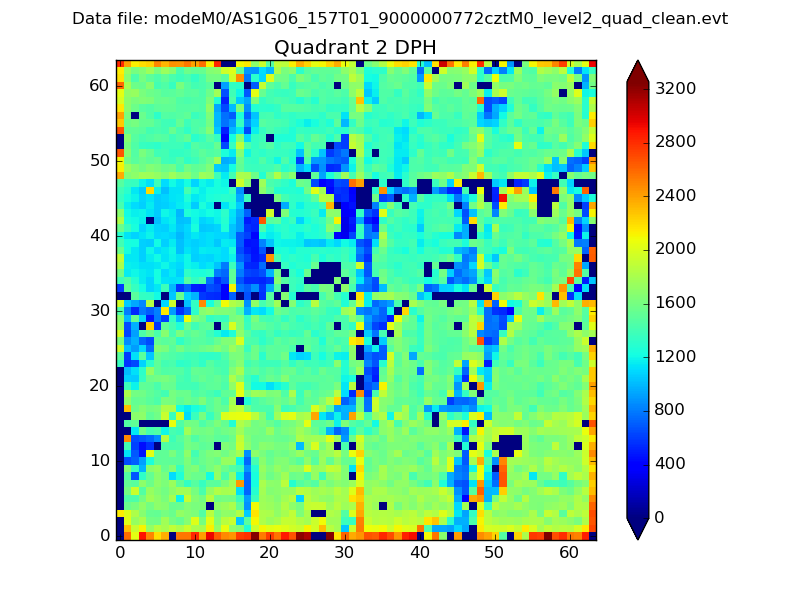 |
Quadrant C |
| Plot type | Count rate plots | Images |
|---|---|---|
| Comparison with Poisson distribution Blue bars denote a histogram of data divided into 1 sec bins. Red curve is a Poisson curve with rate = median count rate of data. |
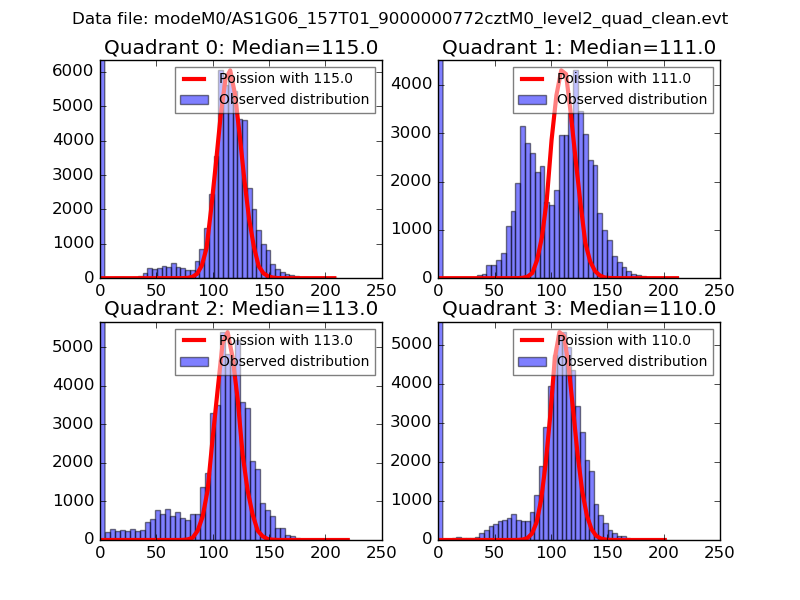 |
 |
| Quadrant-wise count rates Data is divided into 100 sec bins |
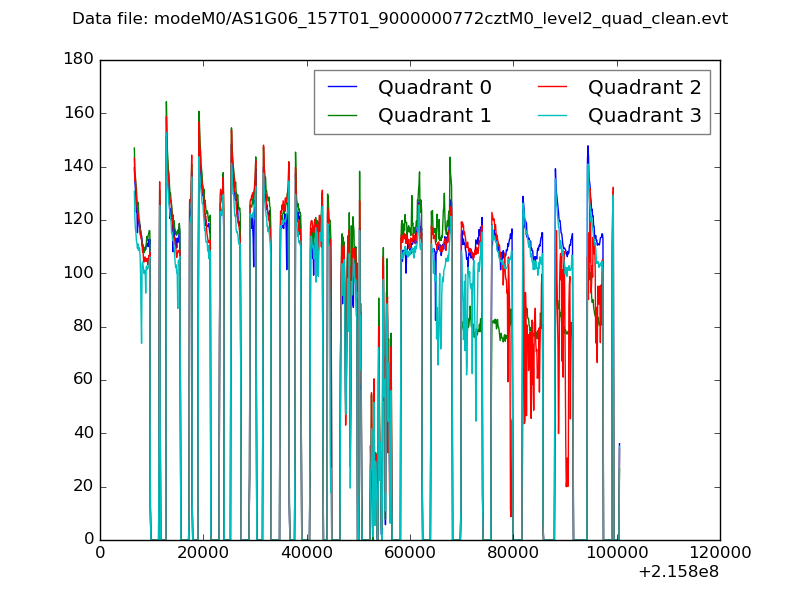 |
|
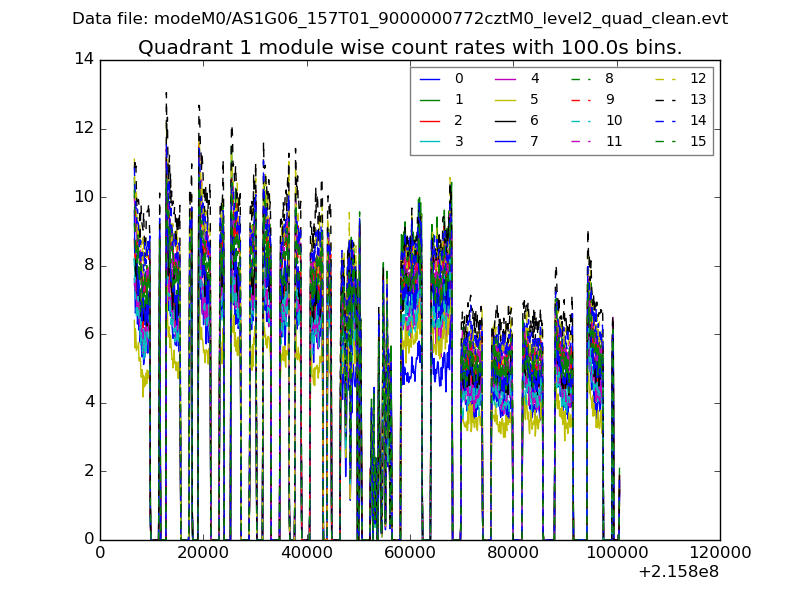
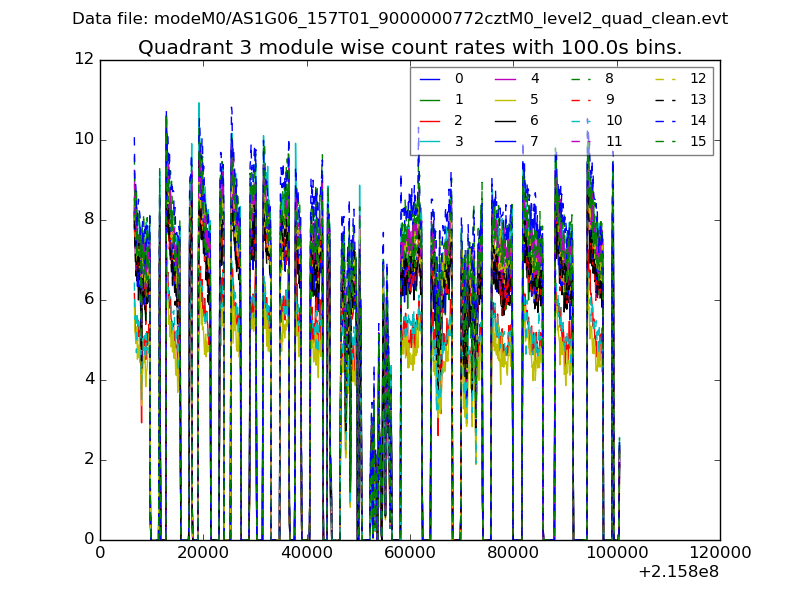
| Module-wise count rates for Quadrant A Data is divided into 100 sec bins |
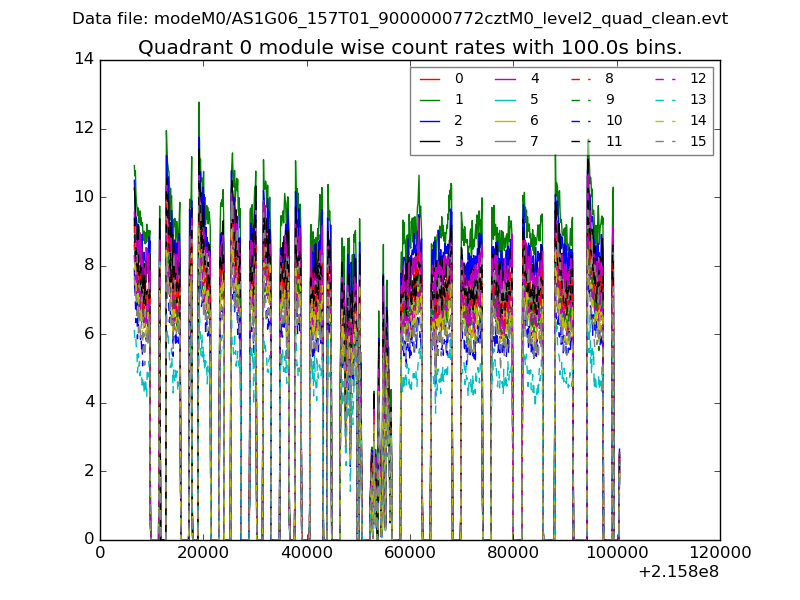 |
 |
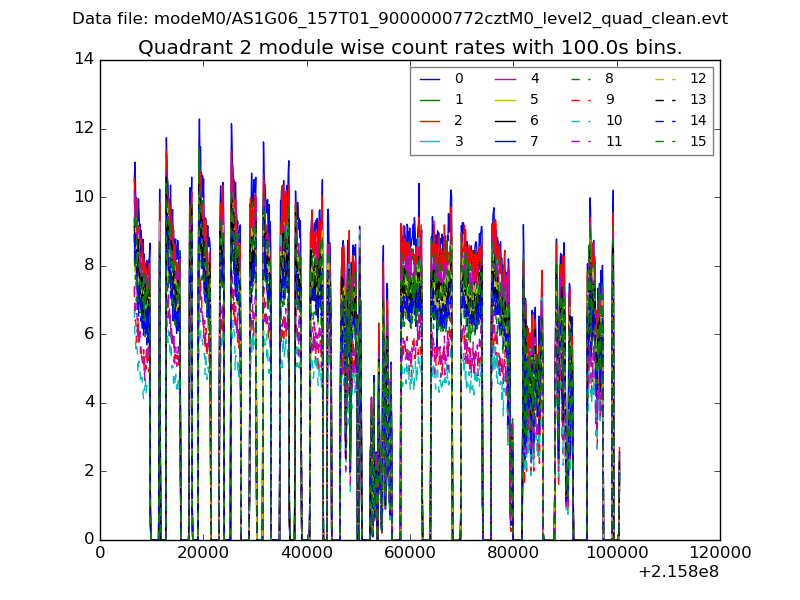
| Module-wise count rates for Quadrant B Data is divided into 100 sec bins |
 |
 |
| Module-wise count rates for Quadrant C Data is divided into 100 sec bins |
 |
 |
| Module-wise count rates for Quadrant D Data is divided into 100 sec bins |
 |
 |
| Parameter | Plot |
|---|---|
| CZT HV Monitor | 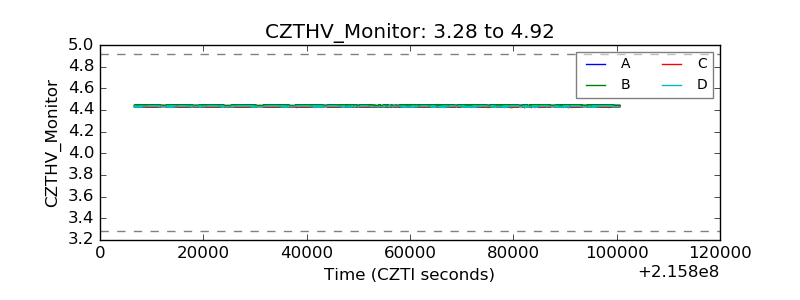 |
| D_VDD | 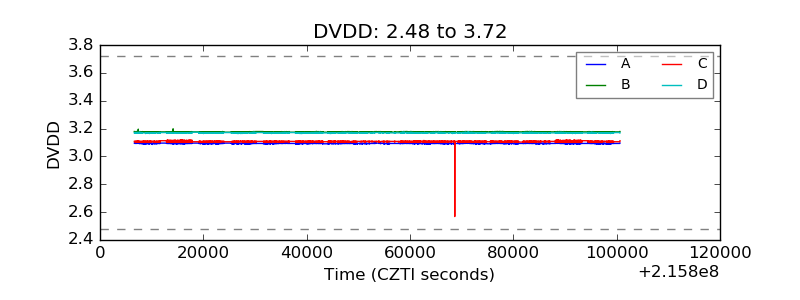 |
| Temperature 1 | 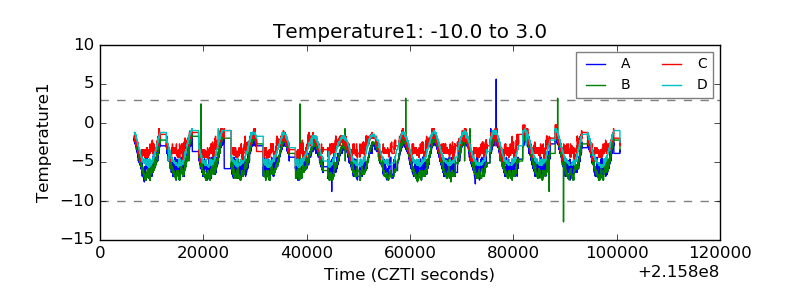 |
| Veto HV Monitor | 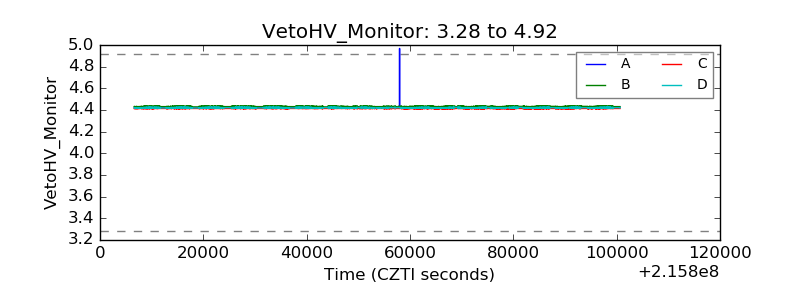 |
| Veto LLD | 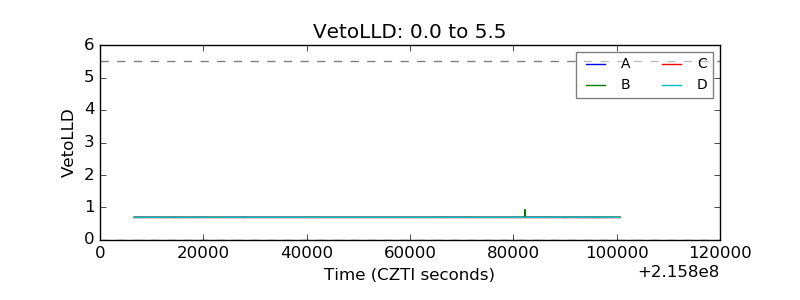 |
| Alpha Counter | 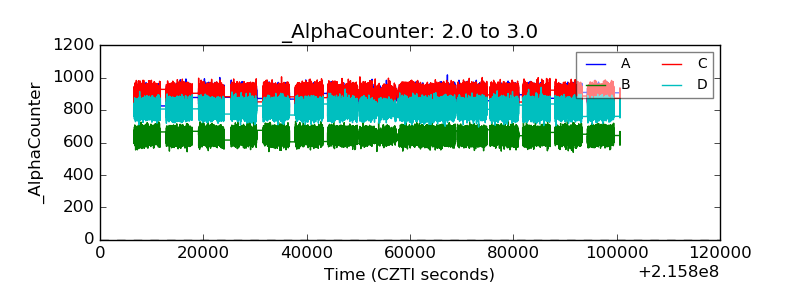 |
| _CPM_Rate | 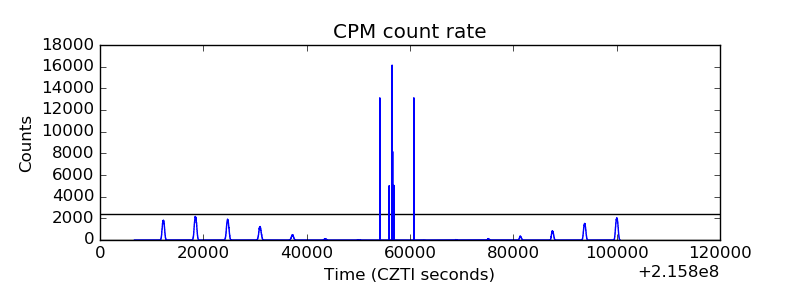 |
| CZT Counter | 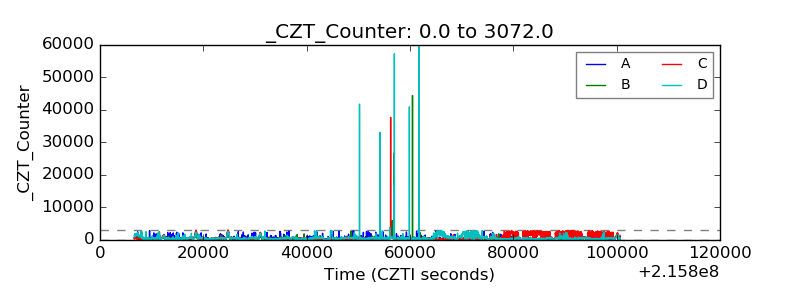 |
| +2.5 Volts monitor | 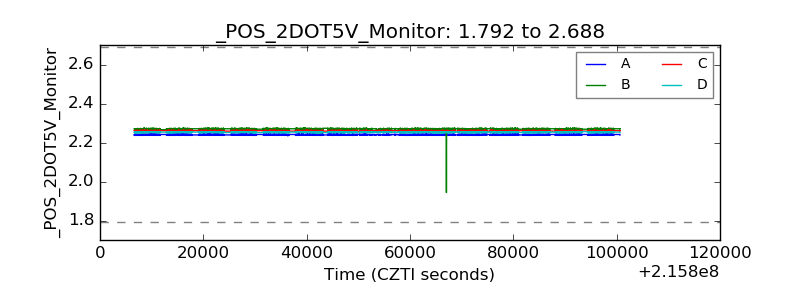 |
| +5 Volts monitor | 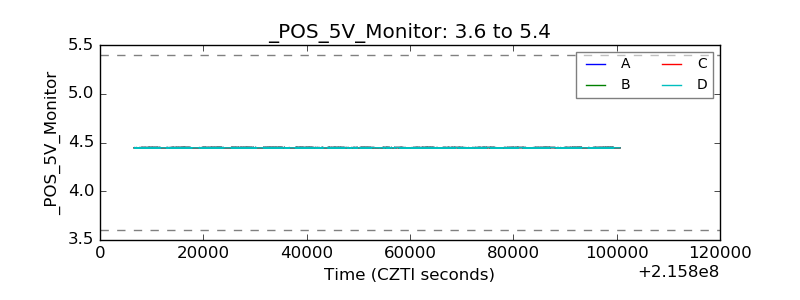 |
| _ROLL_ROT | 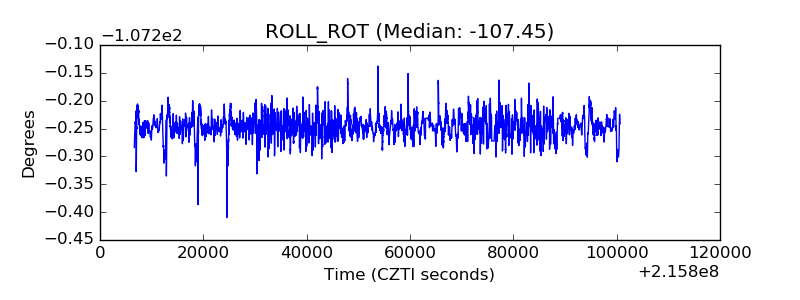 |
| _Roll_DEC | 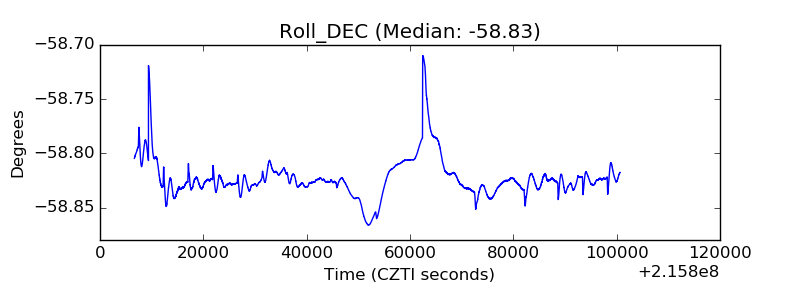 |
| _Roll_RA | 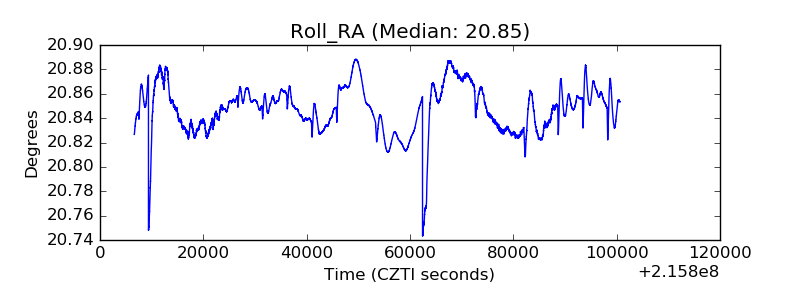 |
| Veto Counter | 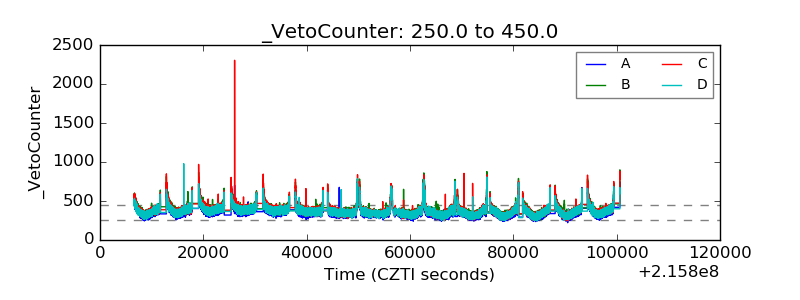 |