| Param | Original file | Final file |
|---|---|---|
| Filename | modeM0/AS1G06_157T01_9000000772_05947cztM0_level2.evt | modeM0/AS1G06_157T01_9000000772_05947cztM0_level2_quad_clean.evt |
| Size (bytes) | 461,724,480 | 96,373,440 |
| Size | 440.3 MB | 91.9 MB |
| Events in quadrant A | 3,708,519 | 613,710 |
| Events in quadrant B | 3,139,354 | 637,953 |
| Events in quadrant C | 2,979,085 | 620,547 |
| Events in quadrant D | 3,705,976 | 584,181 |
| Mode M9 | |||
|---|---|---|---|
| Quadrant | BADHDUFLAG | Total packets | Discarded packets |
| A | 0 | 21 | 0 |
| B | 0 | 21 | 0 |
| C | 0 | 21 | 0 |
| D | 0 | 22 | 0 |
| Mode M0 | |||
|---|---|---|---|
| Quadrant | BADHDUFLAG | Total packets | Discarded packets |
| A | 0 | 15472 | 3 |
| B | 0 | 13883 | 2 |
| C | 0 | 13523 | 2 |
| D | 0 | 15662 | 2 |
| Mode SS | |||
|---|---|---|---|
| Quadrant | BADHDUFLAG | Total packets | Discarded packets |
| A | 0 | 136 | 0 |
| B | 0 | 136 | 0 |
| C | 0 | 136 | 0 |
| D | 0 | 136 | 0 |
| Quadrant | Total seconds | Saturated seconds | Saturation percentage |
|---|---|---|---|
| A | 6625 | 92 | 1.388679% |
| B | 6625 | 26 | 0.392453% |
| C | 6625 | 8 | 0.120755% |
| D | 6625 | 82 | 1.237736% |
Noise dominated data is calculated using 1-second bins in cleaned event files. If a bin has >2000 counts, and if more than 50% of those come from <1% of pixels, then it is considered to be noise-dominated and hence unusable.
| Quadrant | # 1 sec bins | Bins with >0 counts | Bins with >2000 counts | High rate bins dominated by noise | Noise dominated (total time) | Noise dominated (detector-on time) | Marked lightcurve |
|---|---|---|---|---|---|---|---|
| A | 7855 | 6626 | 75 | 75 | 0.95% | 1.13% | 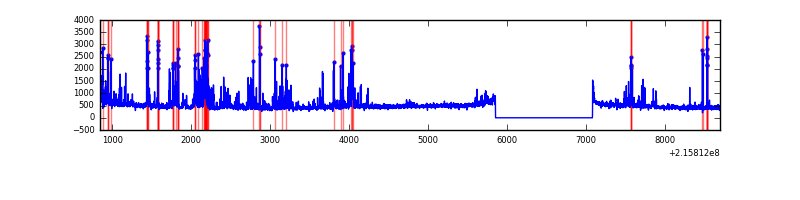 |
| B | 7855 | 6626 | 0 | 0 | 0.00% | 0.00% | 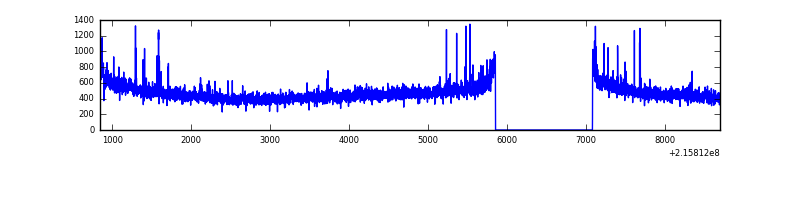 |
| C | 7855 | 6626 | 0 | 0 | 0.00% | 0.00% | 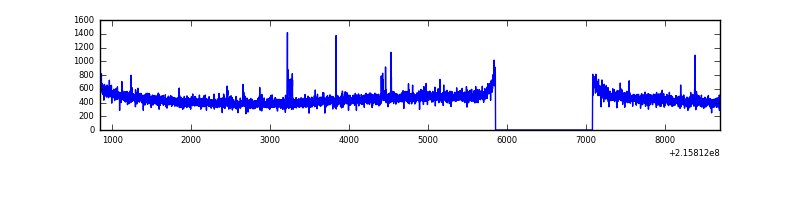 |
| D | 7855 | 6626 | 53 | 53 | 0.67% | 0.80% | 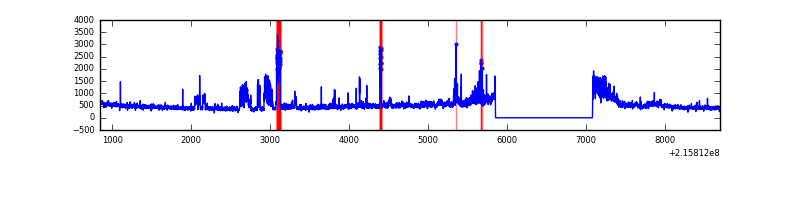 |
Top three noisy pixels from each quadrant. If the there are fewer than three noisy pixels in the level2.evt file, extra rows are filled as -1
| Pixel properties | Quadrant properties | ||||||
|---|---|---|---|---|---|---|---|
| Quadrant | DetID | PixID | Counts | Sigma | Mean | Median | Sigma |
| A | 4 | 2 | 679239 | 4431.8 | 759 | 744 | 153.1 |
| A | 8 | 192 | 50843 | 327.24 | 759 | 744 | 153.1 |
| A | 13 | 251 | 42477 | 272.59 | 759 | 744 | 153.1 |
| B | 15 | 204 | 39555 | 259.35 | 781 | 762 | 149.6 |
| B | 15 | 255 | 39304 | 257.67 | 781 | 762 | 149.6 |
| B | 12 | 111 | 13717 | 86.61 | 781 | 762 | 149.6 |
| C | 1 | 16 | 20861 | 116.91 | 746 | 751 | 172.0 |
| C | 8 | 128 | 15741 | 87.14 | 746 | 751 | 172.0 |
| C | 9 | 54 | 10700 | 57.84 | 746 | 751 | 172.0 |
| D | 1 | 20 | 840352 | 4663.87 | 731 | 706 | 180.0 |
| D | 2 | 63 | 62543 | 343.48 | 731 | 706 | 180.0 |
| D | 12 | 233 | 15955 | 84.7 | 731 | 706 | 180.0 |
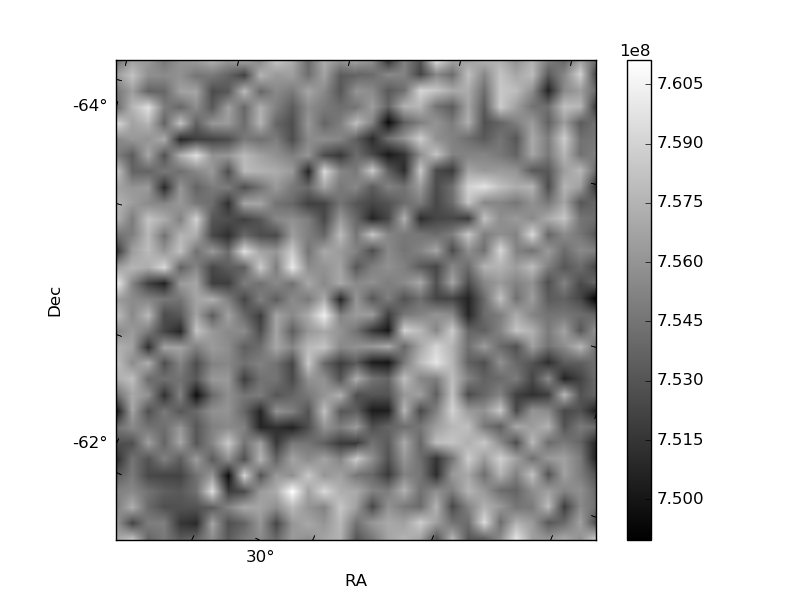
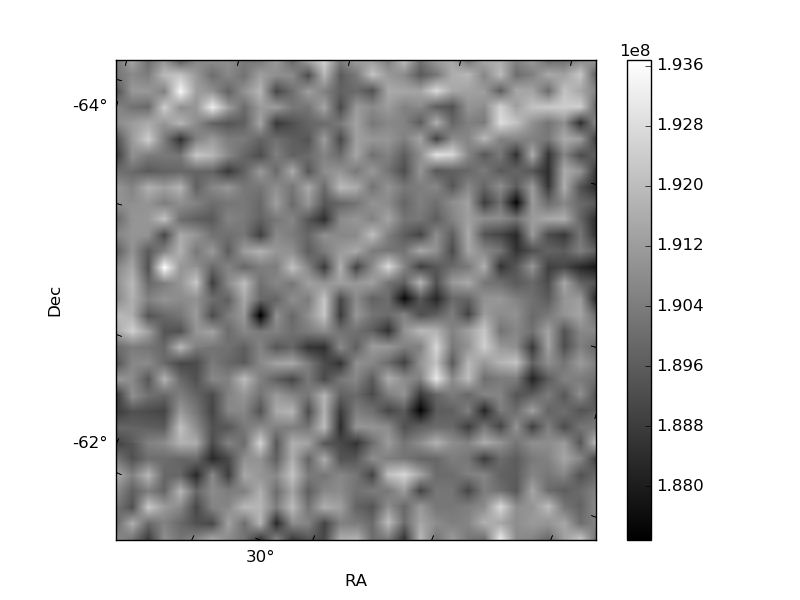
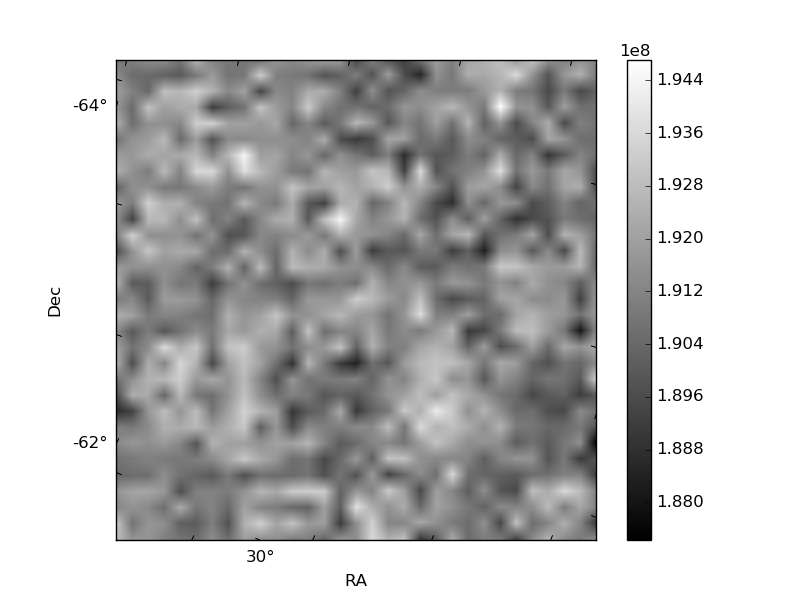
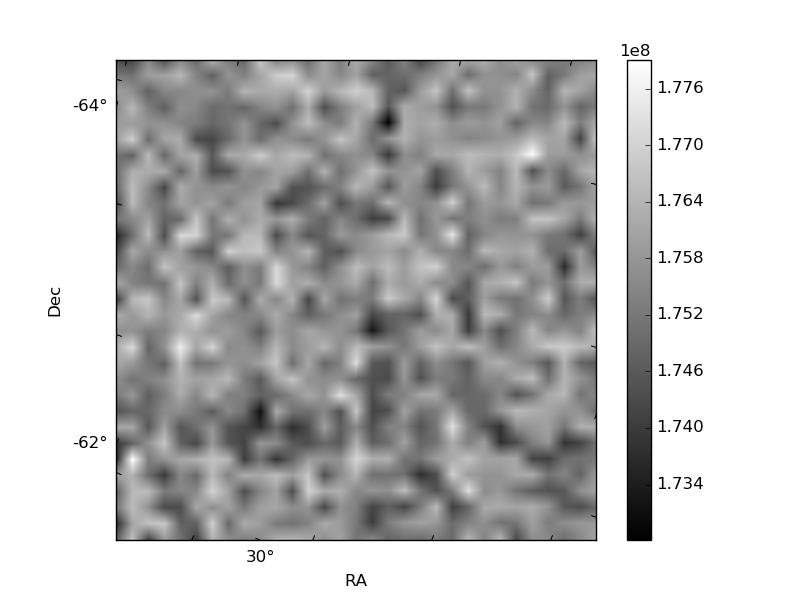
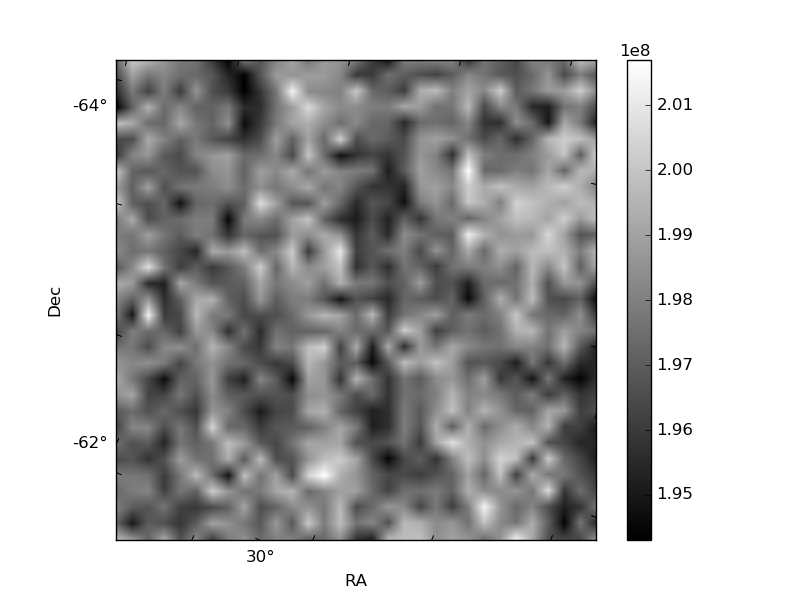
Histogram calculated using DETX and DETY for each event in the final _common_clean file
| Quadrant A | 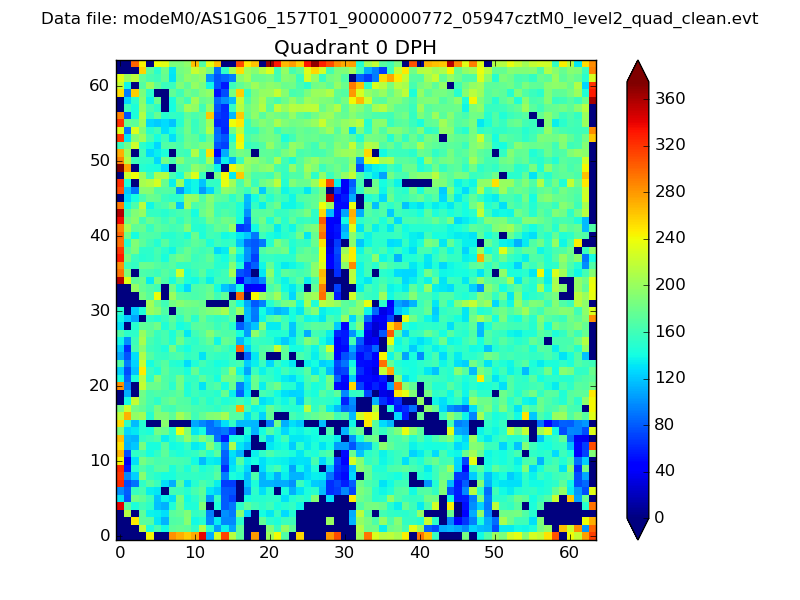 |
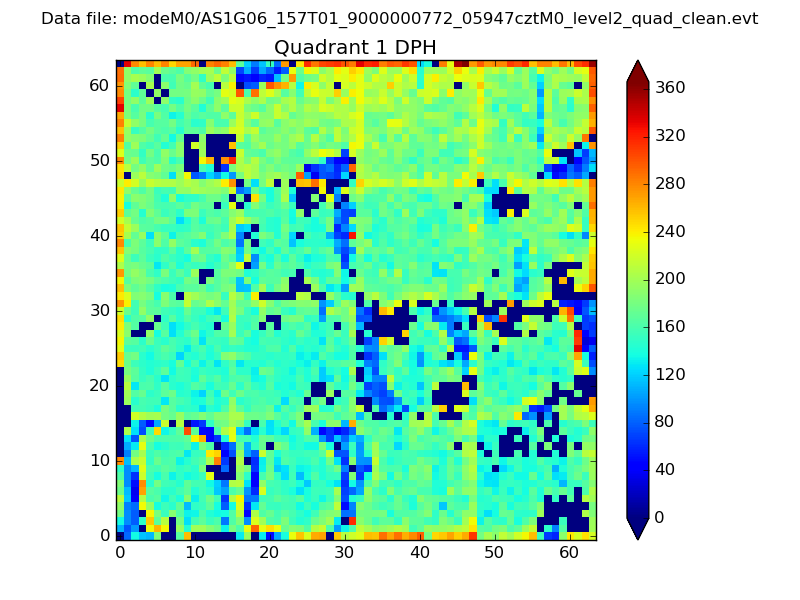 |
Quadrant B |
|---|---|---|---|
| Quadrant D | 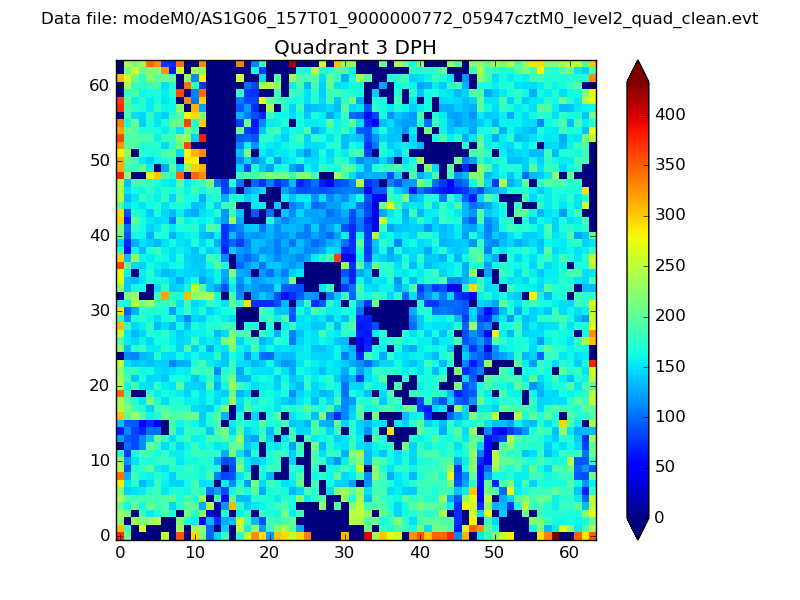 |
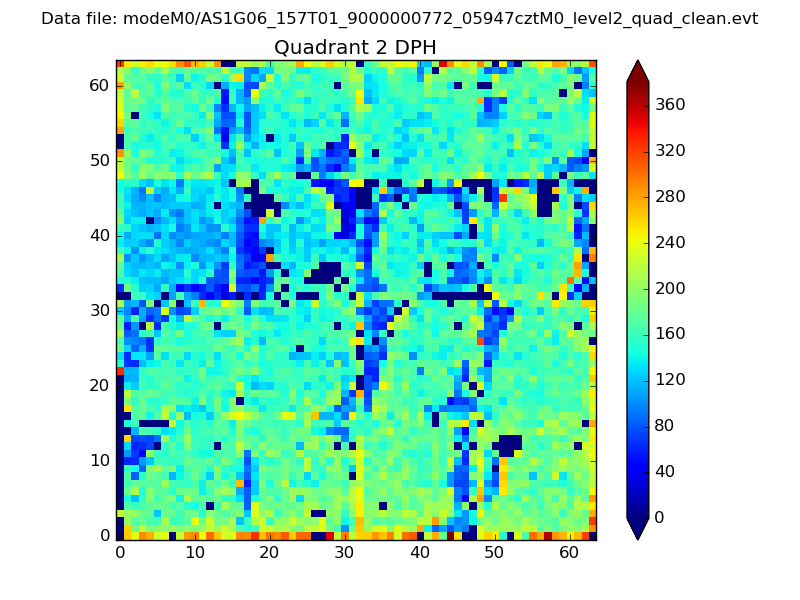 |
Quadrant C |
| Plot type | Count rate plots | Images |
|---|---|---|
| Comparison with Poisson distribution Blue bars denote a histogram of data divided into 1 sec bins. Red curve is a Poisson curve with rate = median count rate of data. |
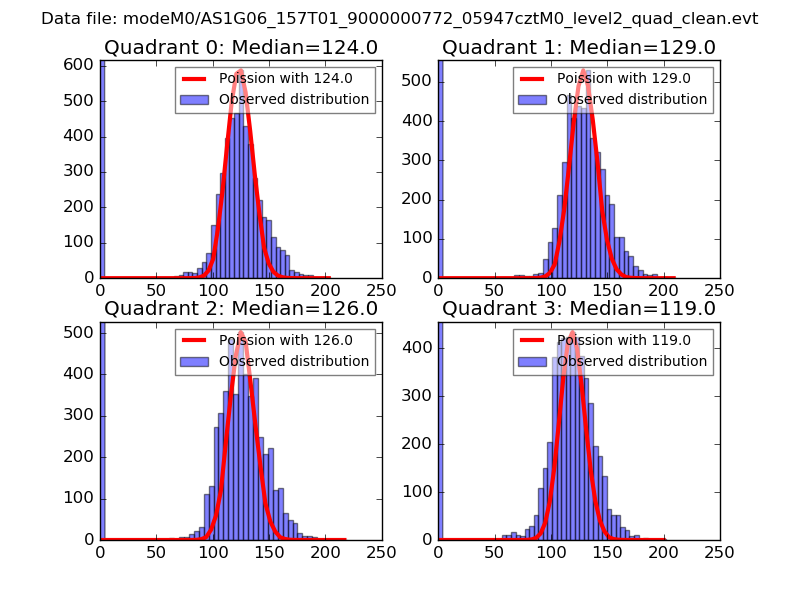 |
 |
| Quadrant-wise count rates Data is divided into 100 sec bins |
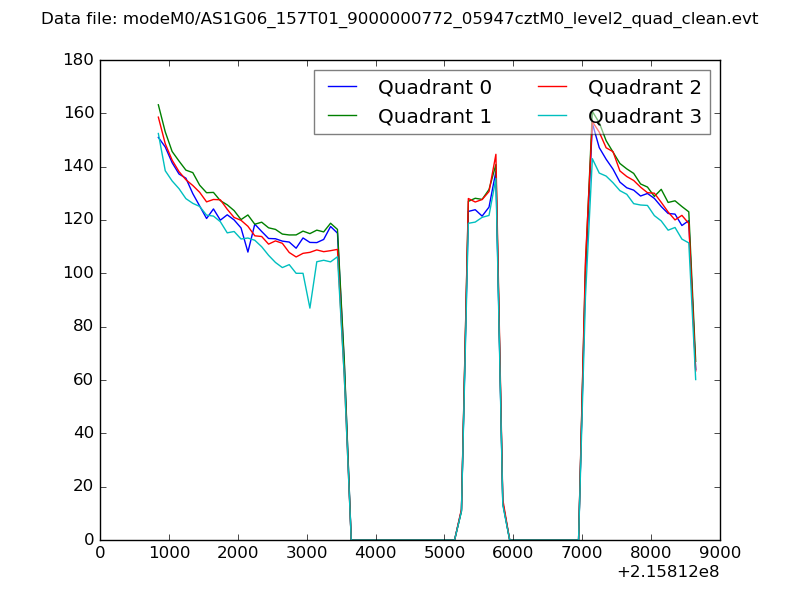 |
|
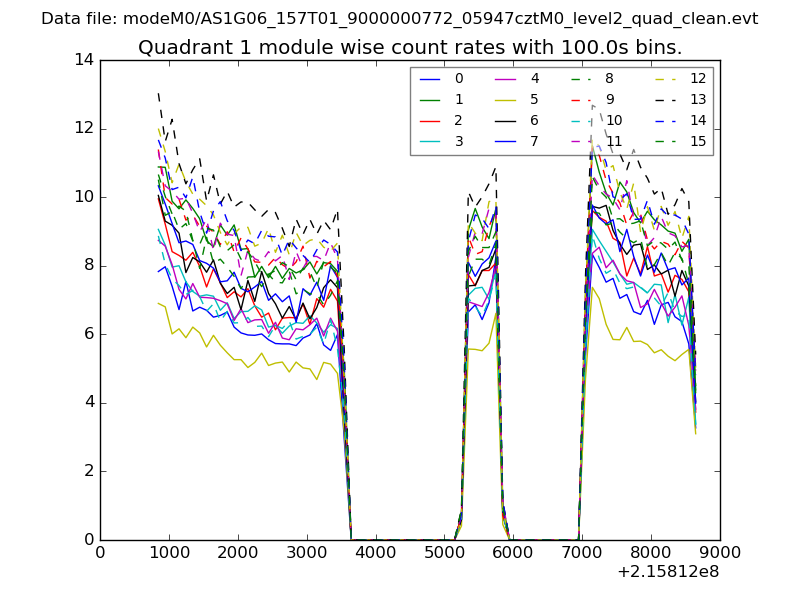
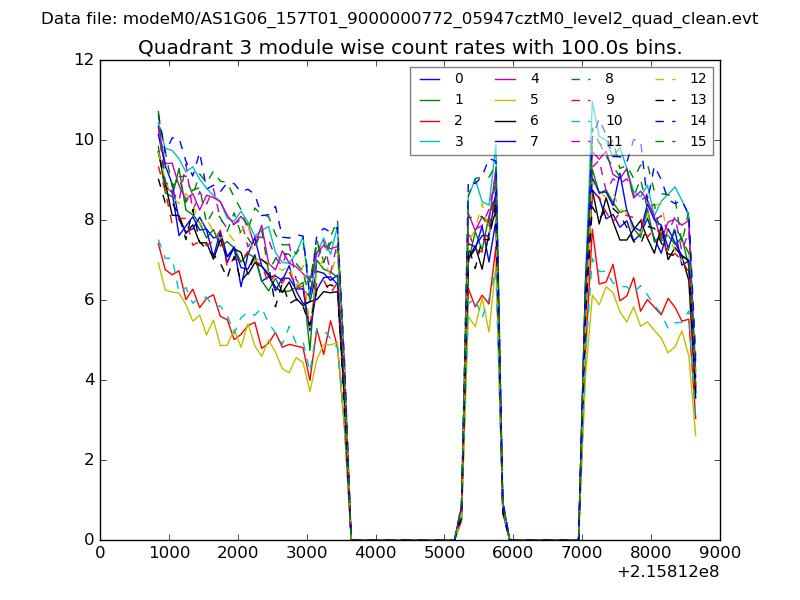
| Module-wise count rates for Quadrant A Data is divided into 100 sec bins |
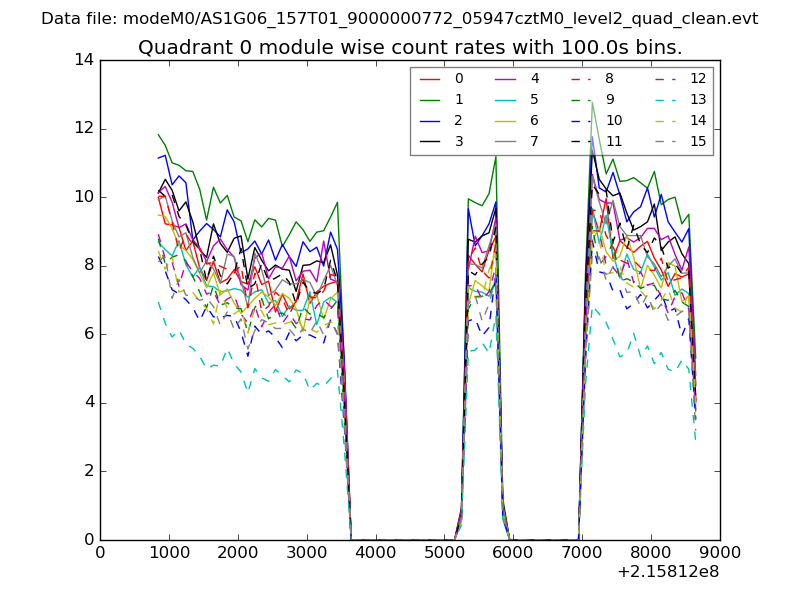 |
 |
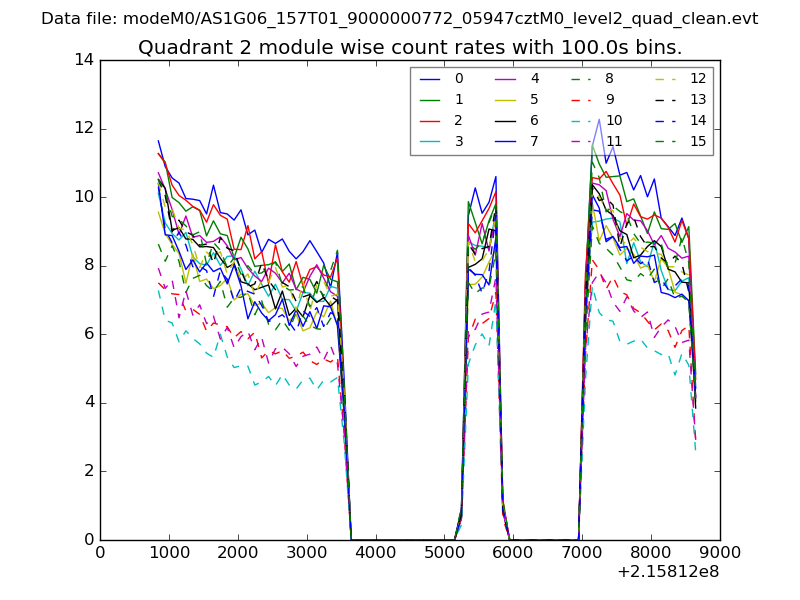
| Module-wise count rates for Quadrant B Data is divided into 100 sec bins |
 |
 |
| Module-wise count rates for Quadrant C Data is divided into 100 sec bins |
 |
 |
| Module-wise count rates for Quadrant D Data is divided into 100 sec bins |
 |
 |
| Parameter | Plot |
|---|---|
| CZT HV Monitor | 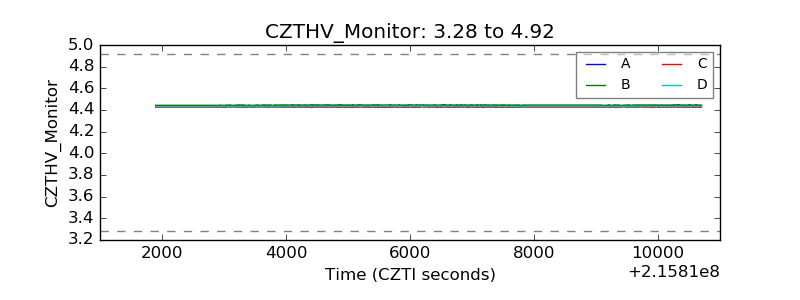 |
| D_VDD | 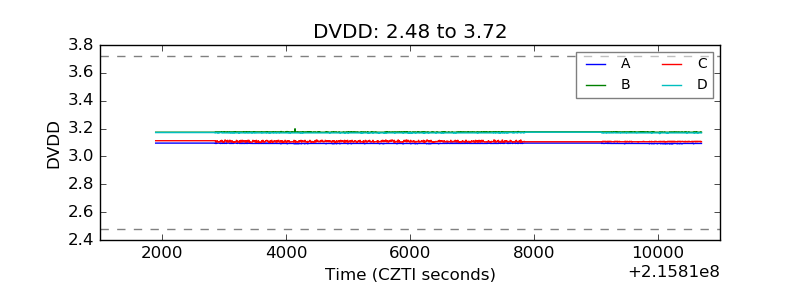 |
| Temperature 1 | 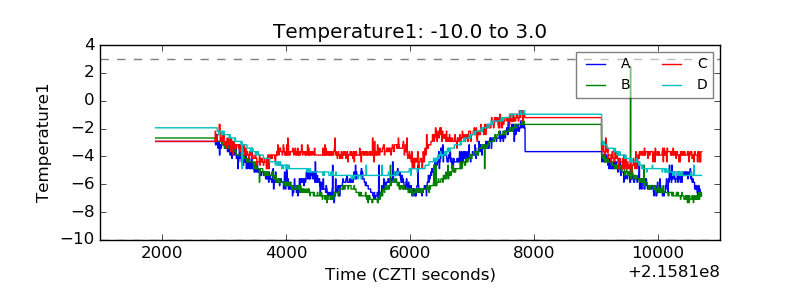 |
| Veto HV Monitor | 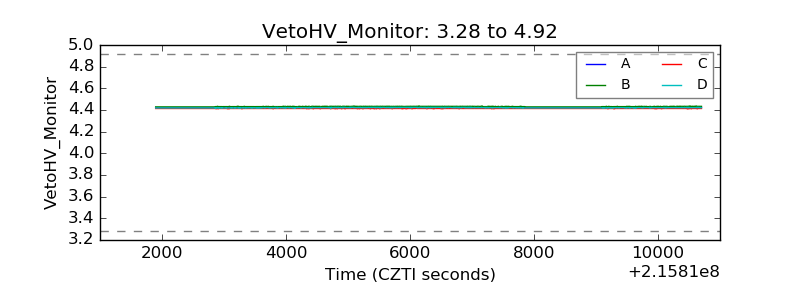 |
| Veto LLD | 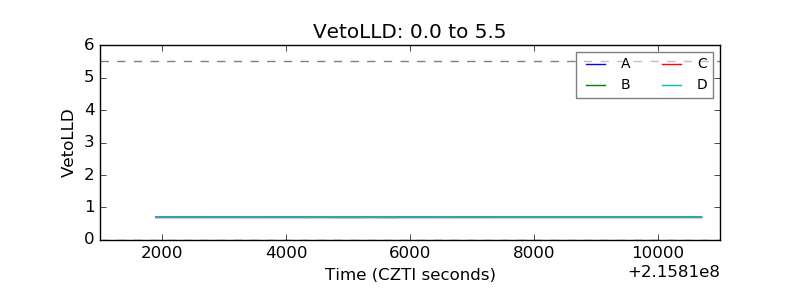 |
| Alpha Counter | 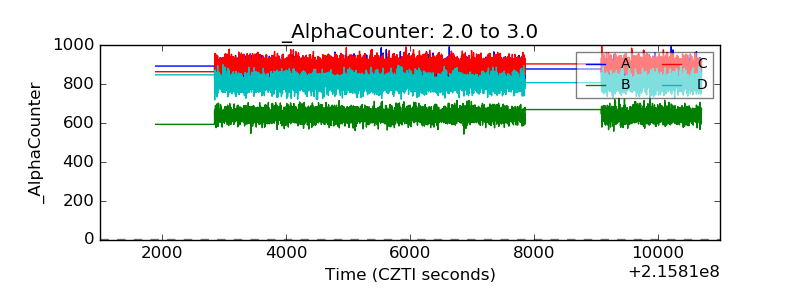 |
| _CPM_Rate | 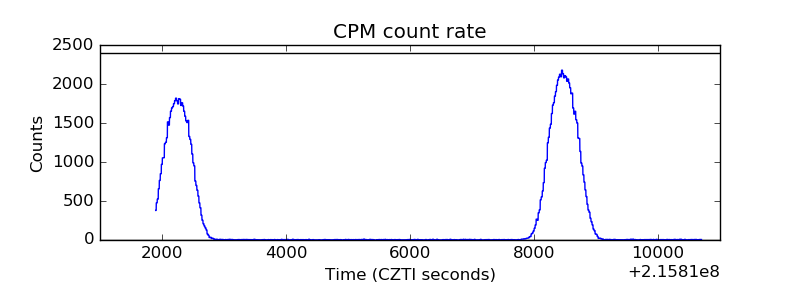 |
| CZT Counter | 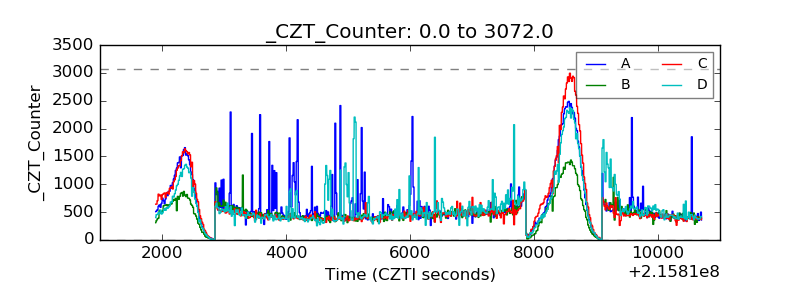 |
| +2.5 Volts monitor |  |
| +5 Volts monitor |  |
| _ROLL_ROT | 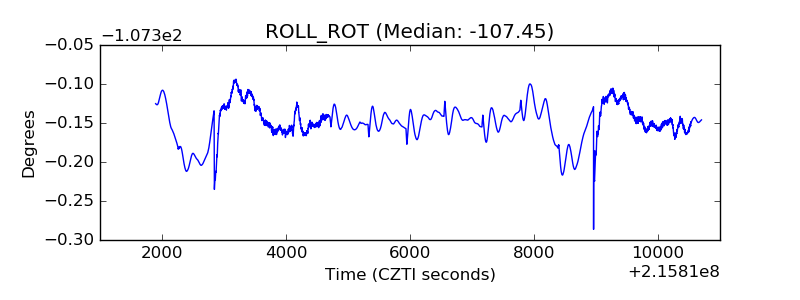 |
| _Roll_DEC | 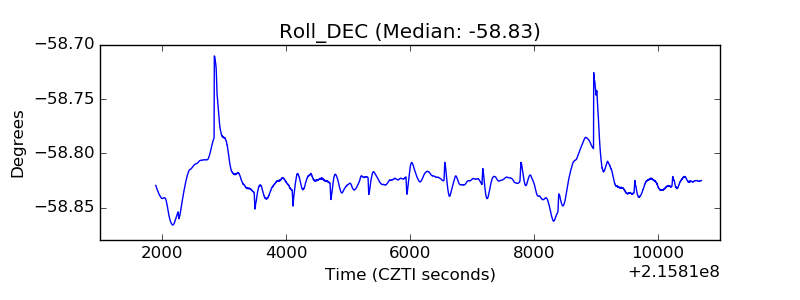 |
| _Roll_RA | 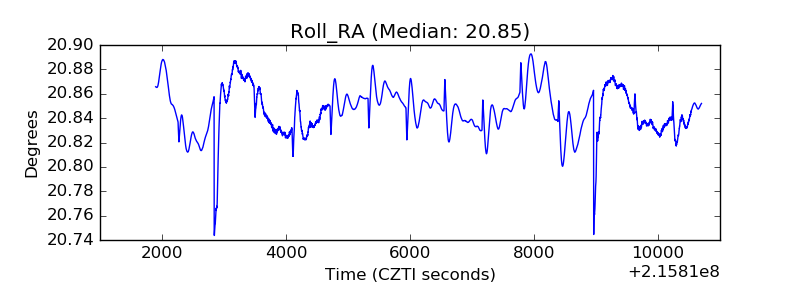 |
| Veto Counter | 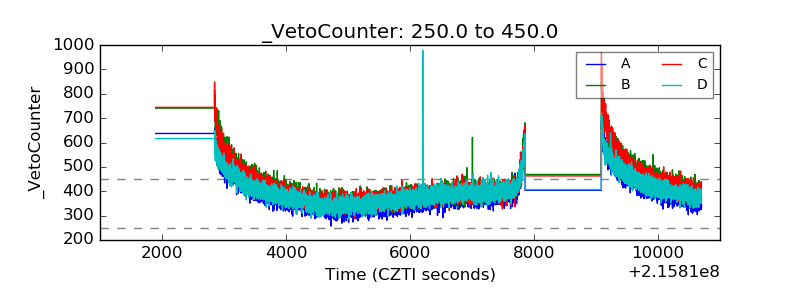 |