| Param | Original file | Final file |
|---|---|---|
| Filename | modeM0/AS1G06_157T01_9000000772_05948cztM0_level2.evt | modeM0/AS1G06_157T01_9000000772_05948cztM0_level2_quad_clean.evt |
| Size (bytes) | 436,224,960 | 97,528,320 |
| Size | 416.0 MB | 93.0 MB |
| Events in quadrant A | 3,398,478 | 620,557 |
| Events in quadrant B | 3,096,394 | 647,568 |
| Events in quadrant C | 2,954,823 | 632,074 |
| Events in quadrant D | 3,314,669 | 595,153 |
| Mode M9 | |||
|---|---|---|---|
| Quadrant | BADHDUFLAG | Total packets | Discarded packets |
| A | 0 | 20 | 0 |
| B | 0 | 20 | 0 |
| C | 0 | 20 | 0 |
| D | 0 | 21 | 0 |
| Mode M0 | |||
|---|---|---|---|
| Quadrant | BADHDUFLAG | Total packets | Discarded packets |
| A | 0 | 14638 | 3 |
| B | 0 | 13636 | 2 |
| C | 0 | 13354 | 2 |
| D | 0 | 14409 | 2 |
| Mode SS | |||
|---|---|---|---|
| Quadrant | BADHDUFLAG | Total packets | Discarded packets |
| A | 0 | 134 | 0 |
| B | 0 | 134 | 0 |
| C | 0 | 134 | 0 |
| D | 0 | 134 | 0 |
| Quadrant | Total seconds | Saturated seconds | Saturation percentage |
|---|---|---|---|
| A | 6569 | 58 | 0.882935% |
| B | 6569 | 18 | 0.274014% |
| C | 6569 | 8 | 0.121784% |
| D | 6569 | 14 | 0.213122% |
Noise dominated data is calculated using 1-second bins in cleaned event files. If a bin has >2000 counts, and if more than 50% of those come from <1% of pixels, then it is considered to be noise-dominated and hence unusable.
| Quadrant | # 1 sec bins | Bins with >0 counts | Bins with >2000 counts | High rate bins dominated by noise | Noise dominated (total time) | Noise dominated (detector-on time) | Marked lightcurve |
|---|---|---|---|---|---|---|---|
| A | 7904 | 6570 | 30 | 30 | 0.38% | 0.46% | 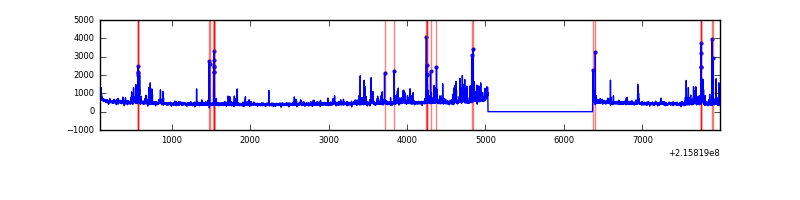 |
| B | 7904 | 6570 | 2 | 2 | 0.03% | 0.03% | 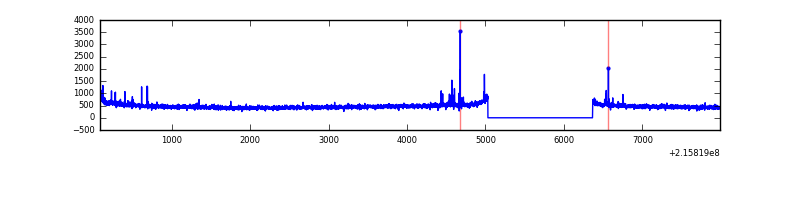 |
| C | 7904 | 6570 | 0 | 0 | 0.00% | 0.00% | 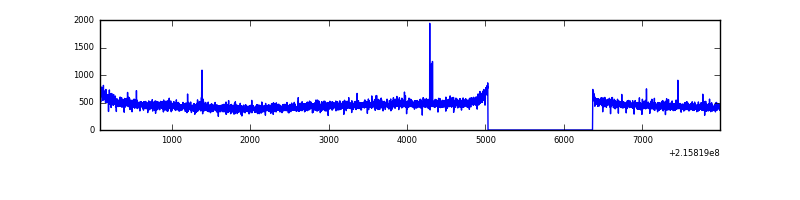 |
| D | 7904 | 6570 | 7 | 7 | 0.09% | 0.11% | 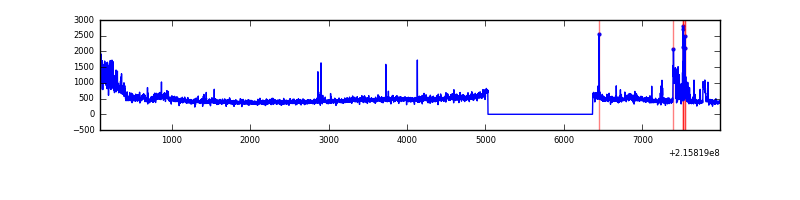 |
Top three noisy pixels from each quadrant. If the there are fewer than three noisy pixels in the level2.evt file, extra rows are filled as -1
| Pixel properties | Quadrant properties | ||||||
|---|---|---|---|---|---|---|---|
| Quadrant | DetID | PixID | Counts | Sigma | Mean | Median | Sigma |
| A | 4 | 2 | 405941 | 2644.26 | 757 | 741 | 153.2 |
| A | 8 | 192 | 28328 | 180.03 | 757 | 741 | 153.2 |
| A | 3 | 1 | 20968 | 132.0 | 757 | 741 | 153.2 |
| B | 15 | 255 | 30307 | 199.79 | 781 | 762 | 147.9 |
| B | 12 | 111 | 13854 | 88.53 | 781 | 762 | 147.9 |
| B | 15 | 204 | 12962 | 82.5 | 781 | 762 | 147.9 |
| C | 9 | 54 | 11119 | 59.58 | 752 | 756 | 173.9 |
| C | 1 | 16 | 6543 | 33.27 | 752 | 756 | 173.9 |
| C | 13 | 61 | 6181 | 31.19 | 752 | 756 | 173.9 |
| D | 1 | 20 | 368668 | 2048.62 | 737 | 714 | 179.6 |
| D | 2 | 63 | 135558 | 750.76 | 737 | 714 | 179.6 |
| D | 2 | 14 | 15706 | 83.47 | 737 | 714 | 179.6 |
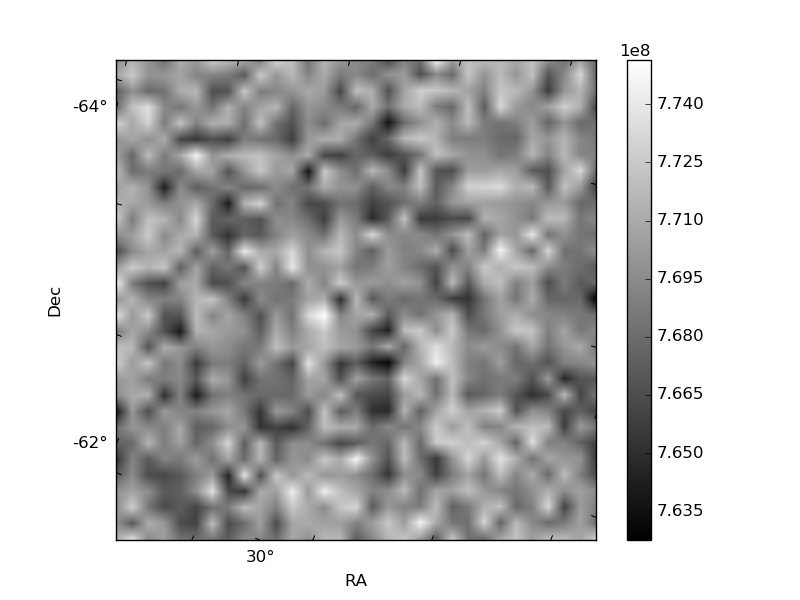
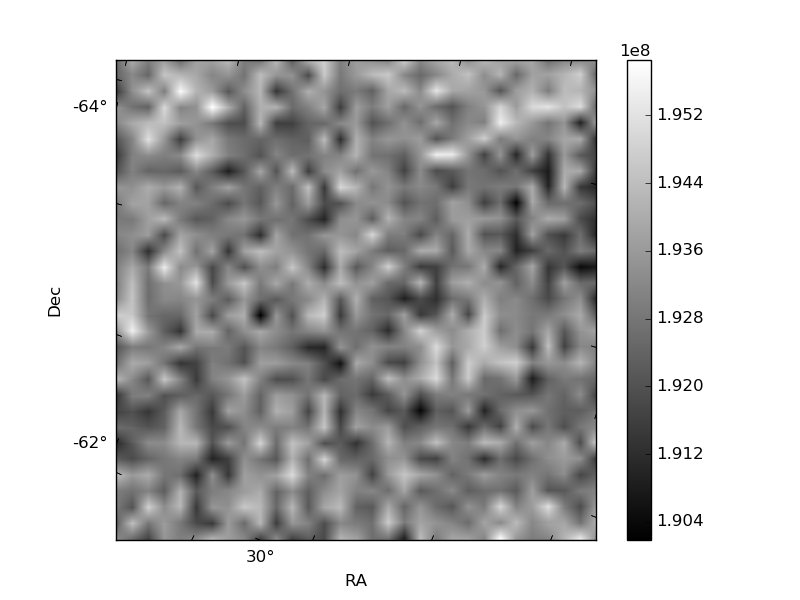
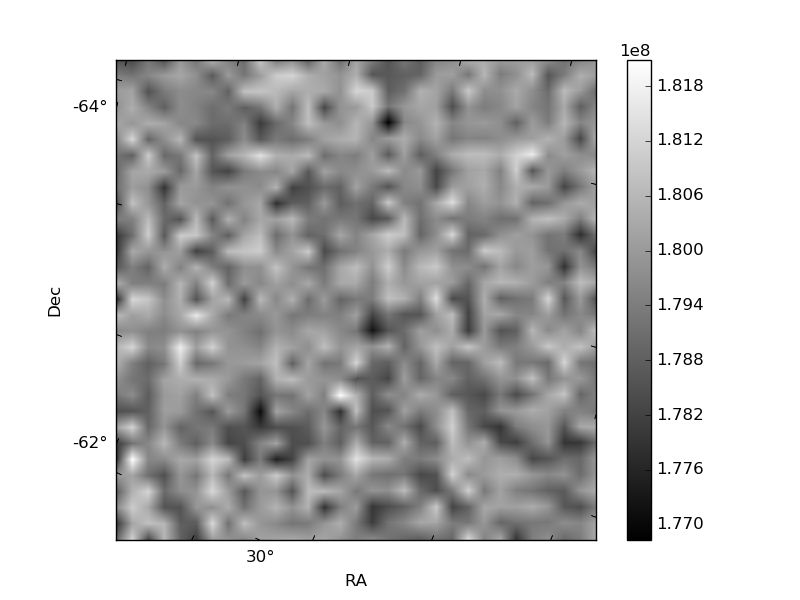
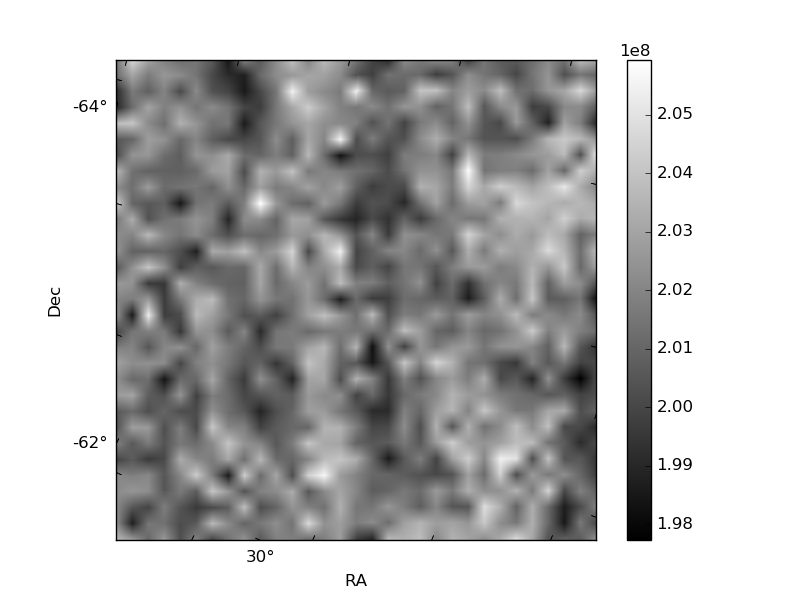
Histogram calculated using DETX and DETY for each event in the final _common_clean file
| Quadrant A | 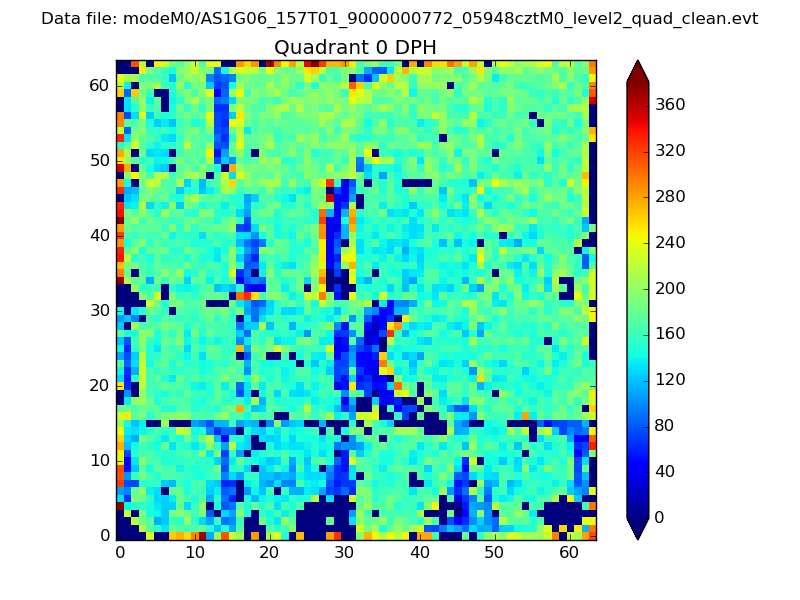 |
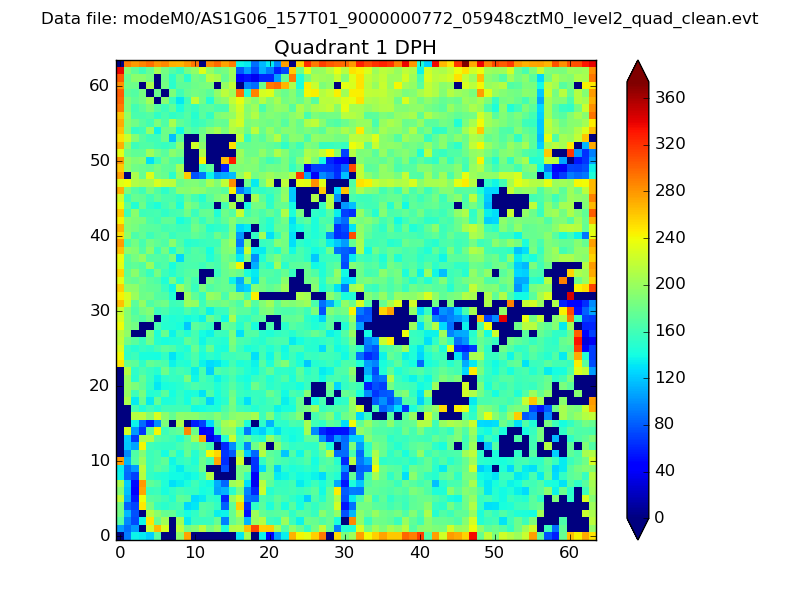 |
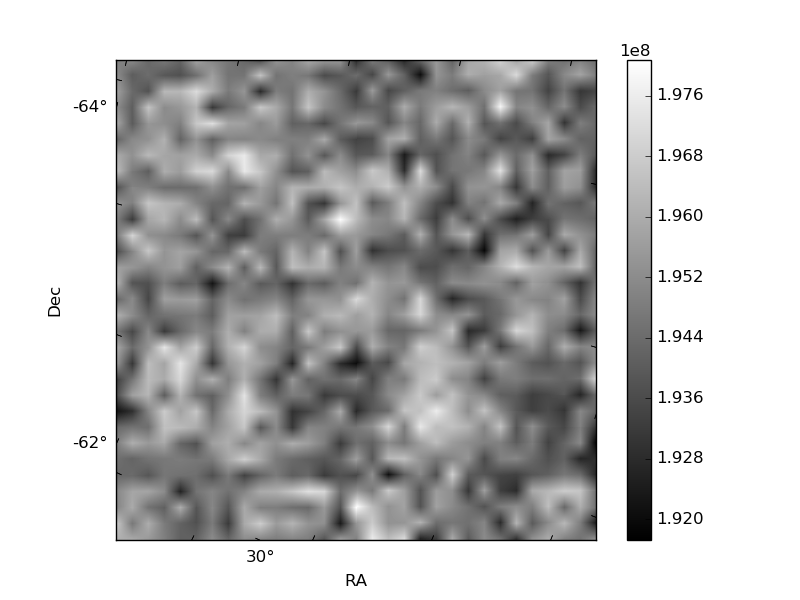
Quadrant B |
|---|---|---|---|
| Quadrant D | 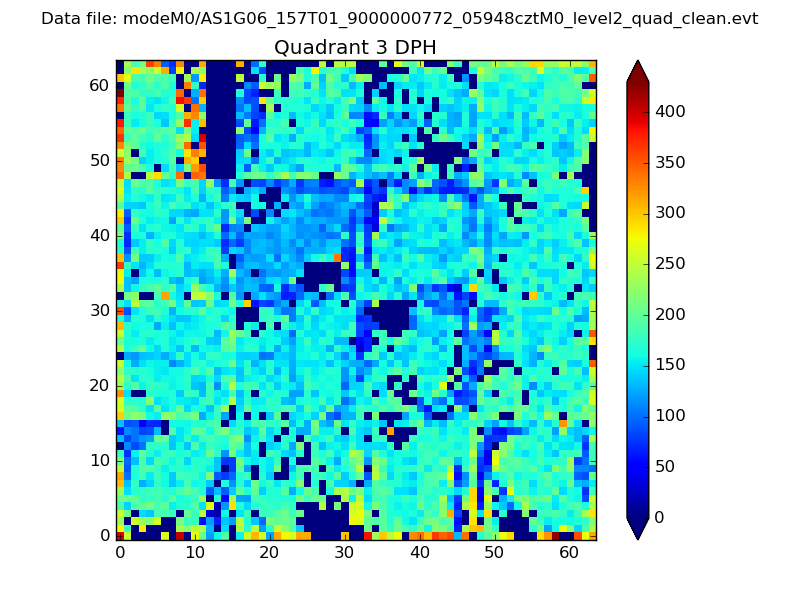 |
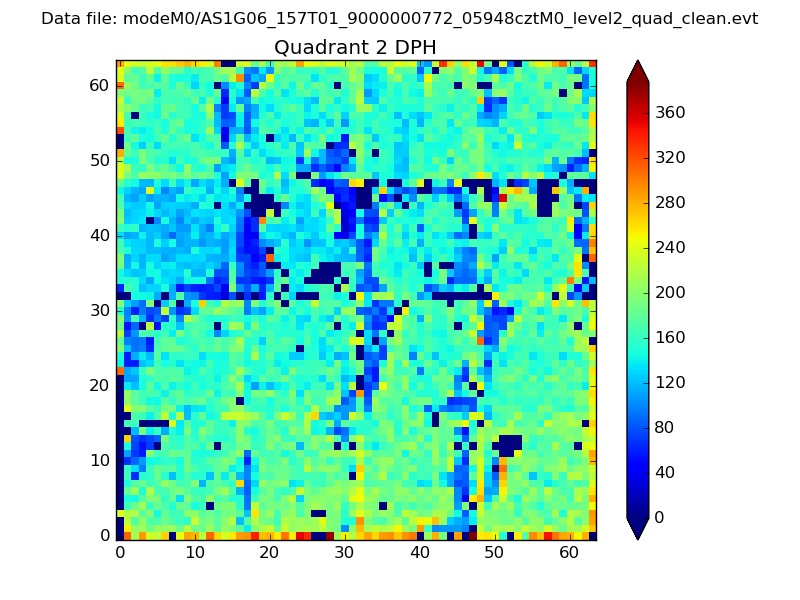 |
Quadrant C |
| Plot type | Count rate plots | Images |
|---|---|---|
| Comparison with Poisson distribution Blue bars denote a histogram of data divided into 1 sec bins. Red curve is a Poisson curve with rate = median count rate of data. |
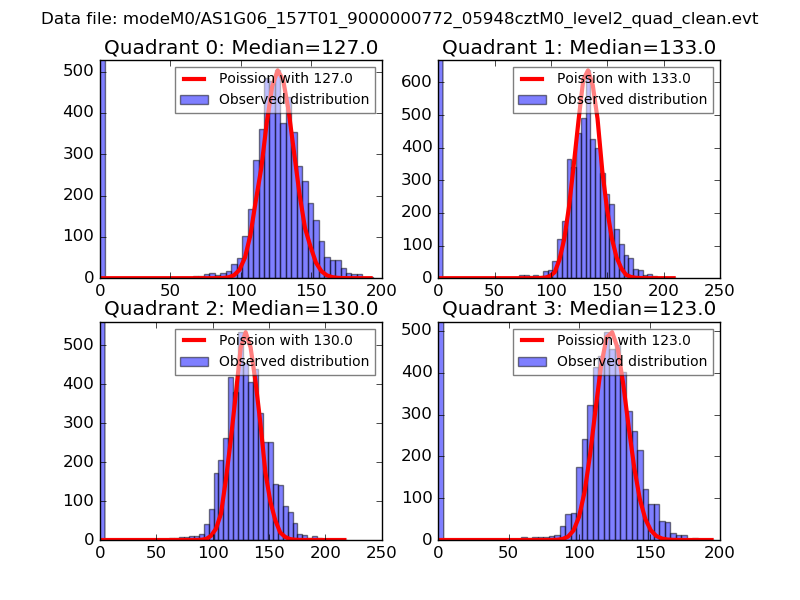 |
 |
| Quadrant-wise count rates Data is divided into 100 sec bins |
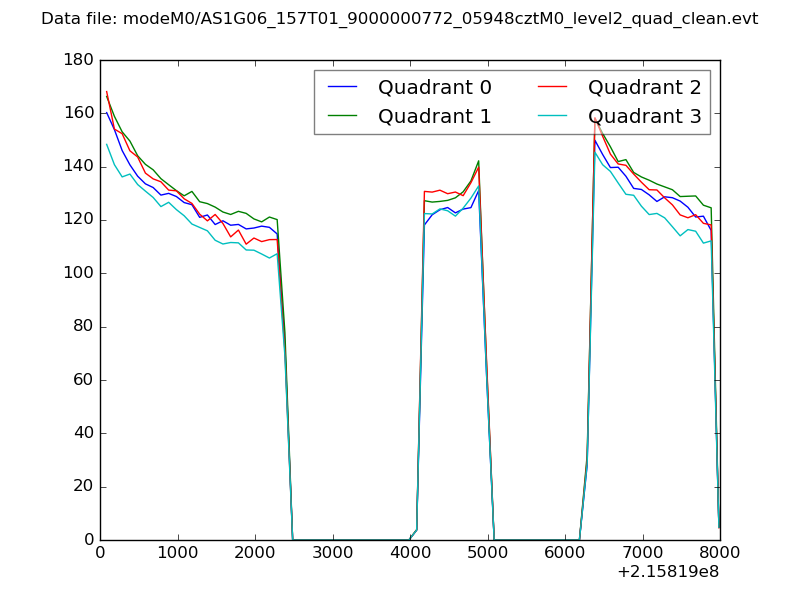 |
|
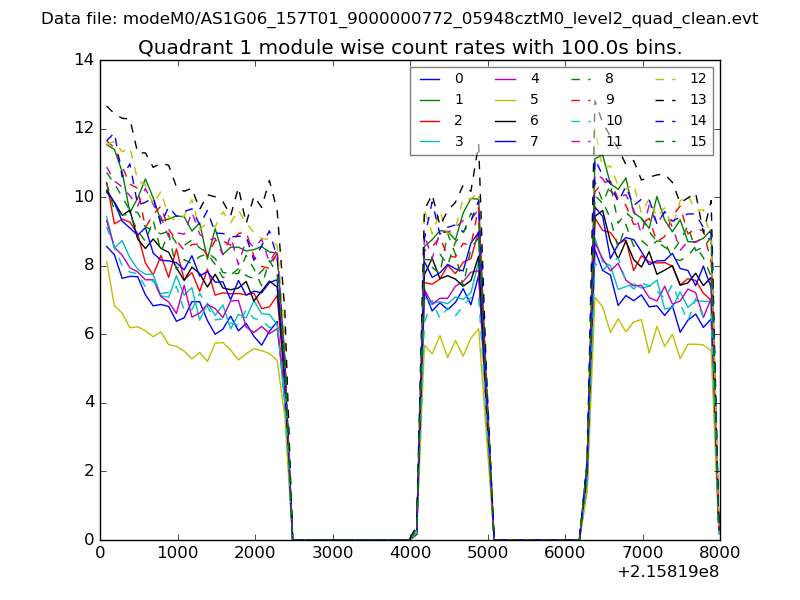
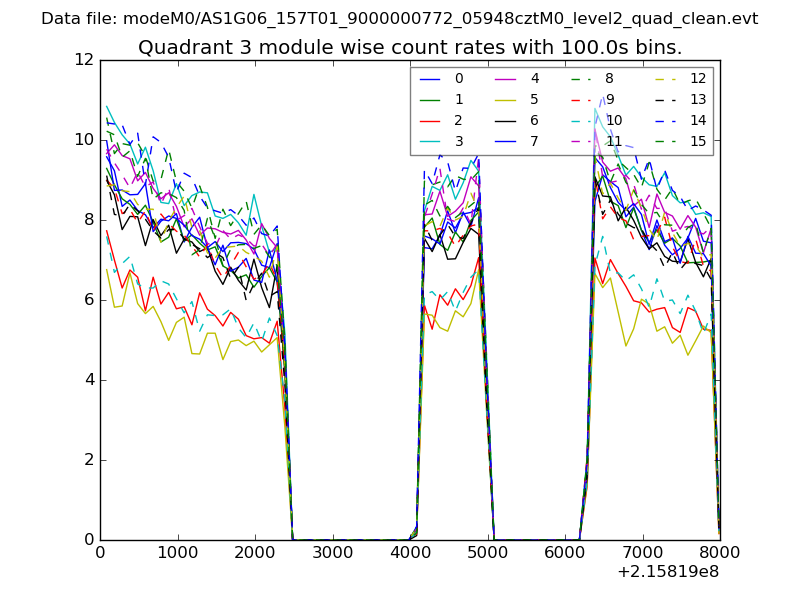
| Module-wise count rates for Quadrant A Data is divided into 100 sec bins |
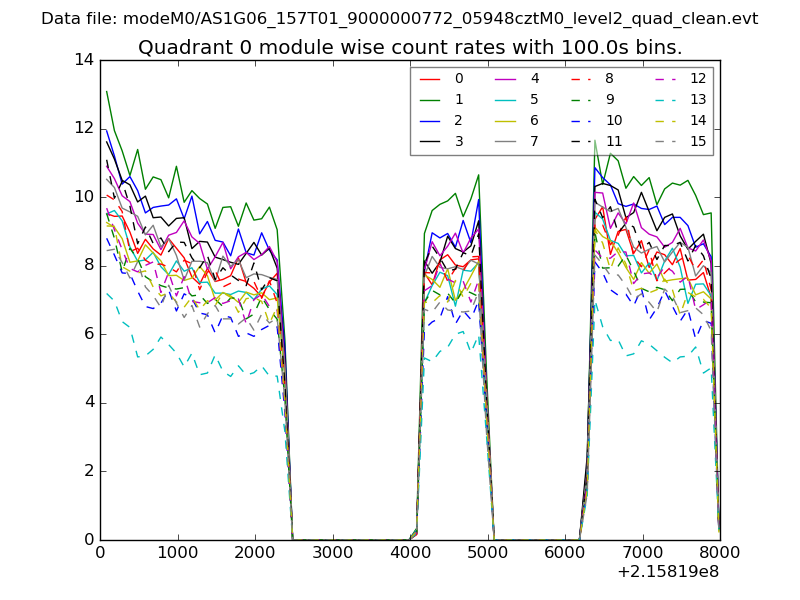 |
 |
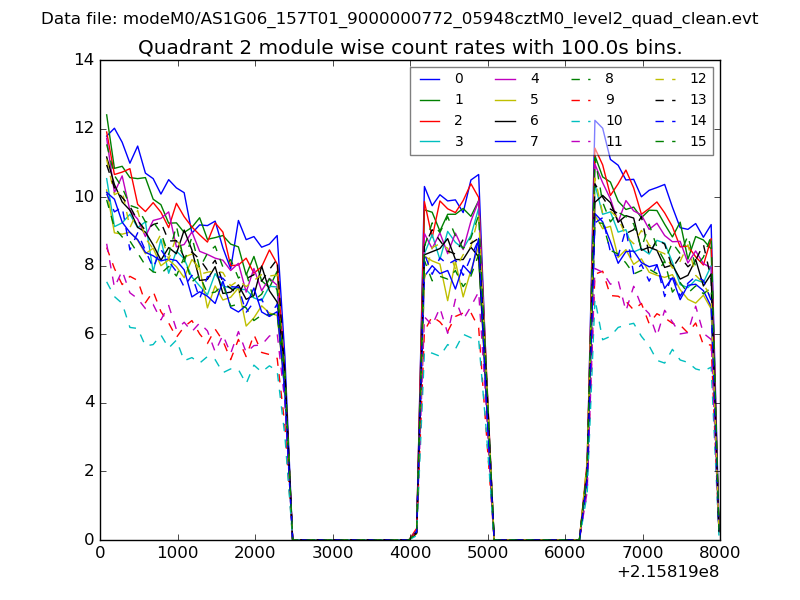
| Module-wise count rates for Quadrant B Data is divided into 100 sec bins |
 |
 |
| Module-wise count rates for Quadrant C Data is divided into 100 sec bins |
 |
 |
| Module-wise count rates for Quadrant D Data is divided into 100 sec bins |
 |
 |
| Parameter | Plot |
|---|---|
| CZT HV Monitor | 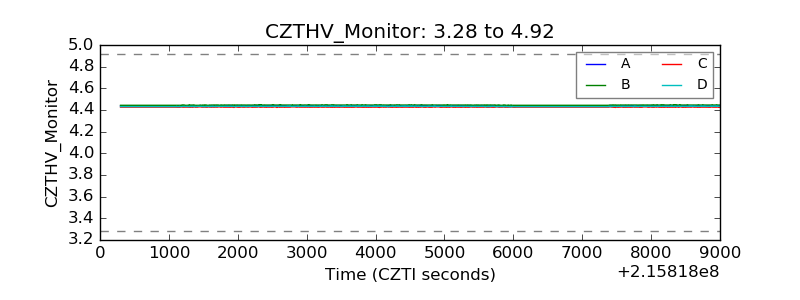 |
| D_VDD | 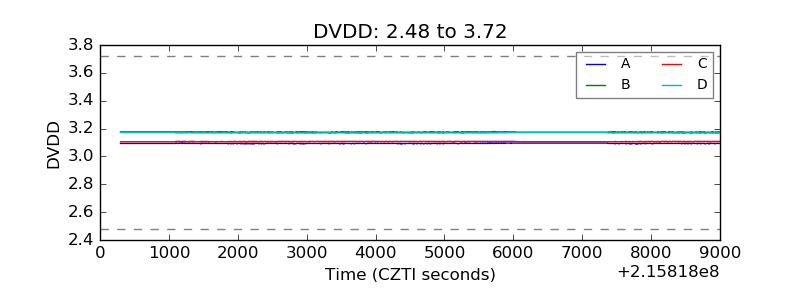 |
| Temperature 1 | 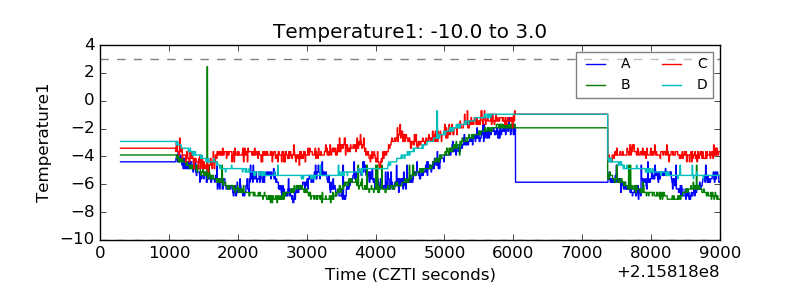 |
| Veto HV Monitor | 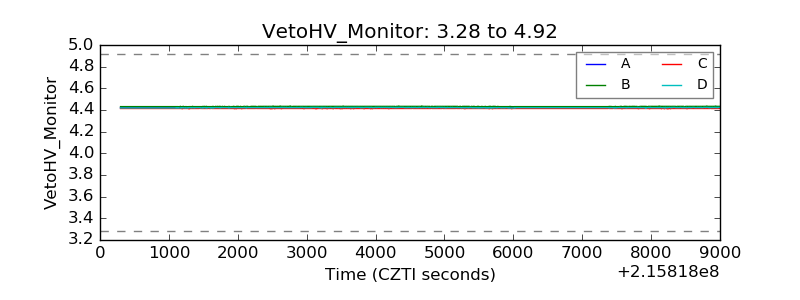 |
| Veto LLD | 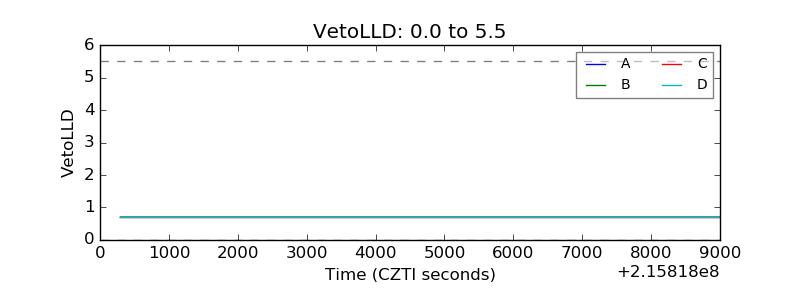 |
| Alpha Counter | 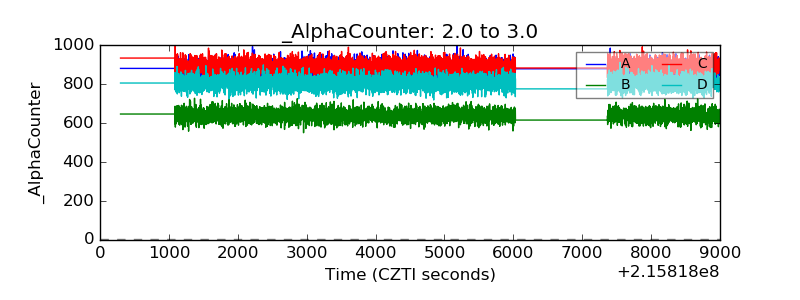 |
| _CPM_Rate | 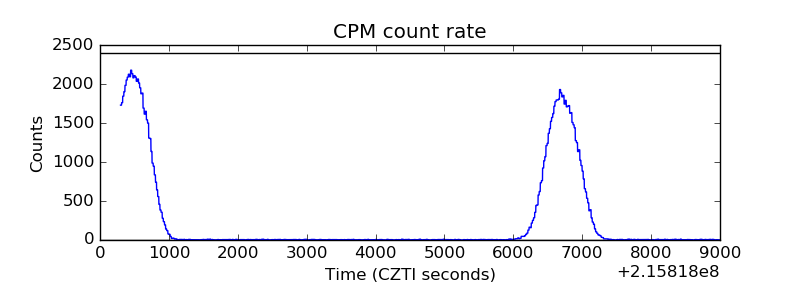 |
| CZT Counter | 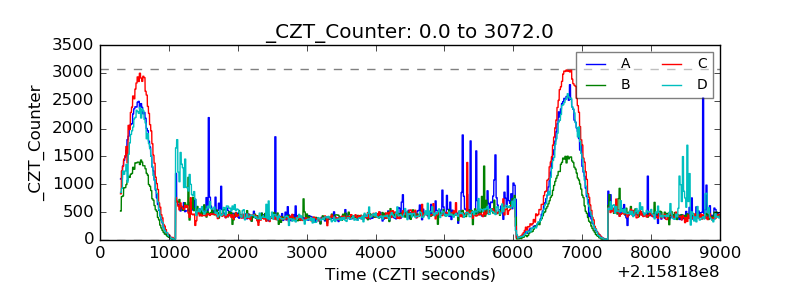 |
| +2.5 Volts monitor | 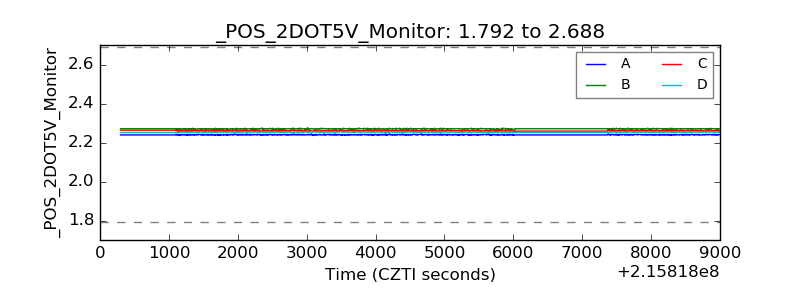 |
| +5 Volts monitor | 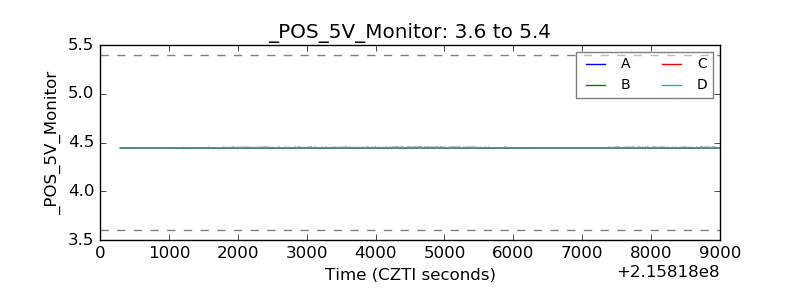 |
| _ROLL_ROT | 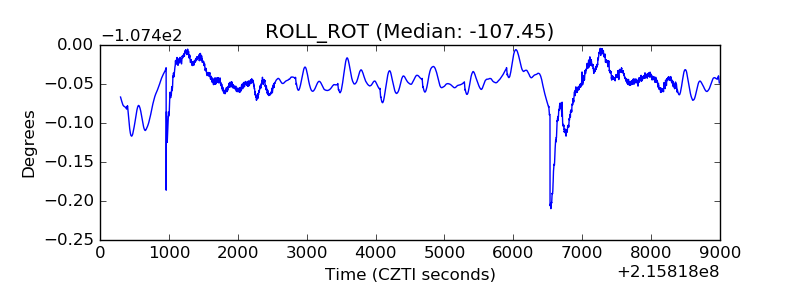 |
| _Roll_DEC | 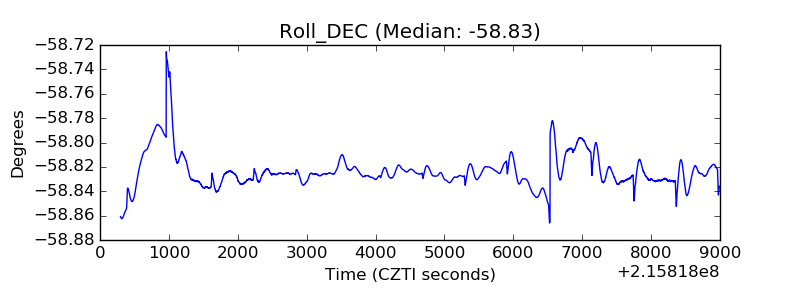 |
| _Roll_RA | 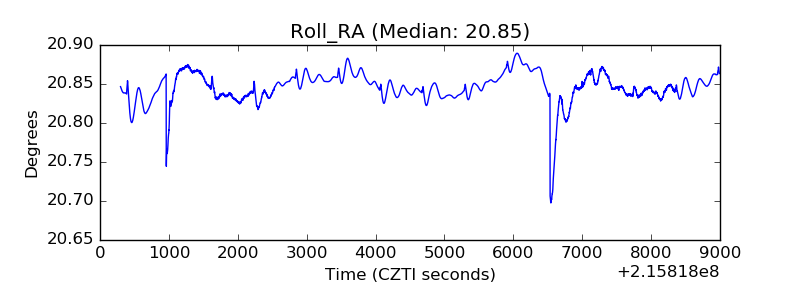 |
| Veto Counter | 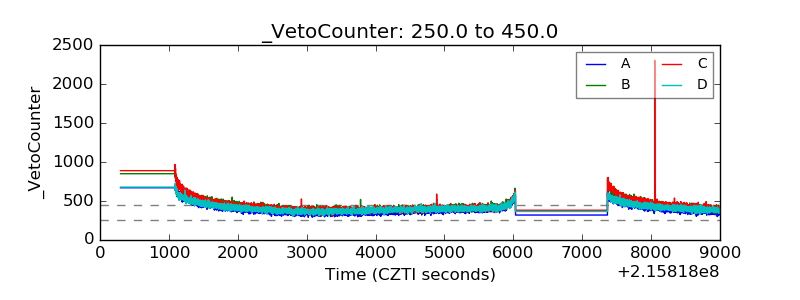 |