| Param | Original file | Final file |
|---|---|---|
| Filename | modeM0/AS1G06_157T01_9000000772_05950cztM0_level2.evt | modeM0/AS1G06_157T01_9000000772_05950cztM0_level2_quad_clean.evt |
| Size (bytes) | 432,351,360 | 88,948,800 |
| Size | 412.3 MB | 84.8 MB |
| Events in quadrant A | 3,722,337 | 552,394 |
| Events in quadrant B | 3,024,407 | 580,600 |
| Events in quadrant C | 2,880,383 | 569,362 |
| Events in quadrant D | 3,029,690 | 543,070 |
| Mode M9 | |||
|---|---|---|---|
| Quadrant | BADHDUFLAG | Total packets | Discarded packets |
| A | 0 | 15 | 0 |
| B | 0 | 15 | 0 |
| C | 0 | 15 | 0 |
| D | 0 | 16 | 0 |
| Mode M0 | |||
|---|---|---|---|
| Quadrant | BADHDUFLAG | Total packets | Discarded packets |
| A | 0 | 15429 | 3 |
| B | 0 | 13343 | 2 |
| C | 0 | 13099 | 2 |
| D | 0 | 13694 | 2 |
| Mode SS | |||
|---|---|---|---|
| Quadrant | BADHDUFLAG | Total packets | Discarded packets |
| A | 0 | 130 | 0 |
| B | 0 | 130 | 0 |
| C | 0 | 130 | 0 |
| D | 0 | 130 | 0 |
| Quadrant | Total seconds | Saturated seconds | Saturation percentage |
|---|---|---|---|
| A | 6426 | 178 | 2.769997% |
| B | 6426 | 24 | 0.373483% |
| C | 6426 | 11 | 0.171180% |
| D | 6426 | 12 | 0.186741% |
Noise dominated data is calculated using 1-second bins in cleaned event files. If a bin has >2000 counts, and if more than 50% of those come from <1% of pixels, then it is considered to be noise-dominated and hence unusable.
| Quadrant | # 1 sec bins | Bins with >0 counts | Bins with >2000 counts | High rate bins dominated by noise | Noise dominated (total time) | Noise dominated (detector-on time) | Marked lightcurve |
|---|---|---|---|---|---|---|---|
| A | 7591 | 6427 | 108 | 108 | 1.42% | 1.68% | 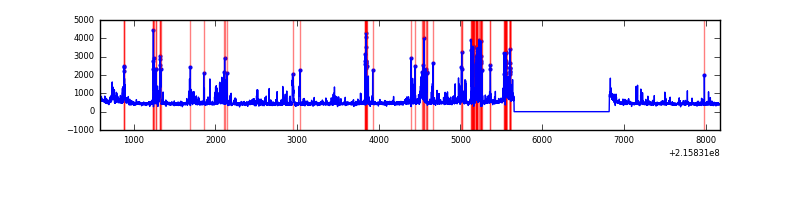 |
| B | 7591 | 6427 | 5 | 5 | 0.07% | 0.08% | 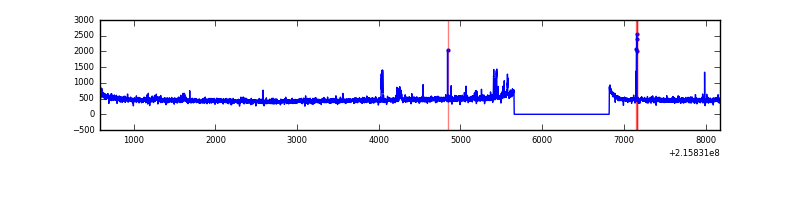 |
| C | 7591 | 6427 | 0 | 0 | 0.00% | 0.00% | 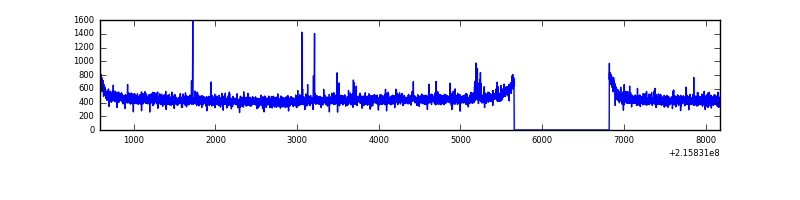 |
| D | 7591 | 6427 | 3 | 3 | 0.04% | 0.05% | 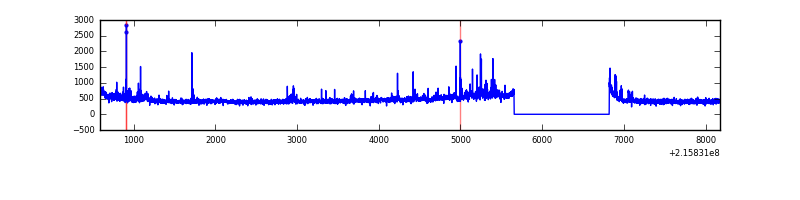 |
Top three noisy pixels from each quadrant. If the there are fewer than three noisy pixels in the level2.evt file, extra rows are filled as -1
| Pixel properties | Quadrant properties | ||||||
|---|---|---|---|---|---|---|---|
| Quadrant | DetID | PixID | Counts | Sigma | Mean | Median | Sigma |
| A | 4 | 2 | 669431 | 4522.97 | 727 | 712 | 147.8 |
| A | 13 | 251 | 212973 | 1435.65 | 727 | 712 | 147.8 |
| A | 8 | 192 | 20416 | 133.27 | 727 | 712 | 147.8 |
| B | 0 | 219 | 32915 | 226.44 | 752 | 735 | 142.1 |
| B | 15 | 255 | 28986 | 198.79 | 752 | 735 | 142.1 |
| B | 7 | 221 | 15041 | 100.67 | 752 | 735 | 142.1 |
| C | 9 | 54 | 16480 | 93.31 | 731 | 735 | 168.7 |
| C | 9 | 68 | 10190 | 56.03 | 731 | 735 | 168.7 |
| C | 13 | 61 | 5823 | 30.15 | 731 | 735 | 168.7 |
| D | 1 | 20 | 140311 | 795.05 | 721 | 698 | 175.6 |
| D | 2 | 63 | 118555 | 671.16 | 721 | 698 | 175.6 |
| D | 2 | 152 | 17408 | 95.16 | 721 | 698 | 175.6 |
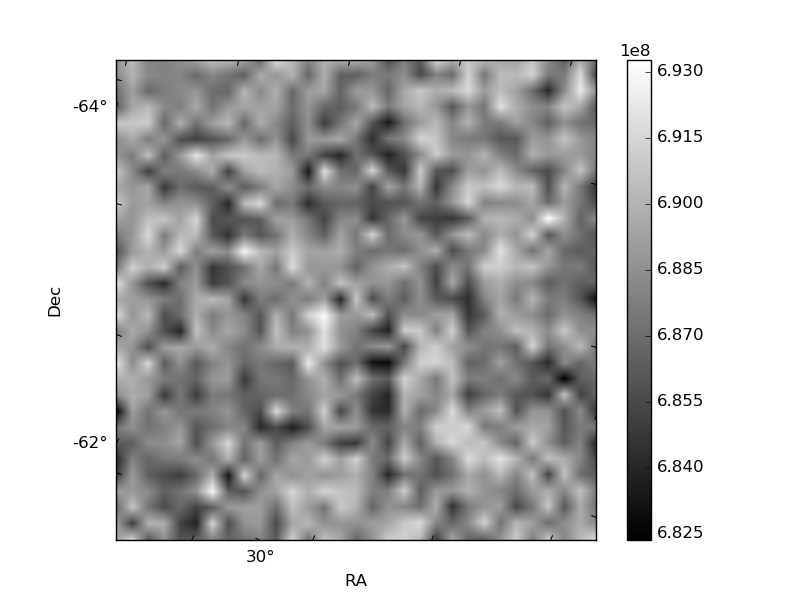
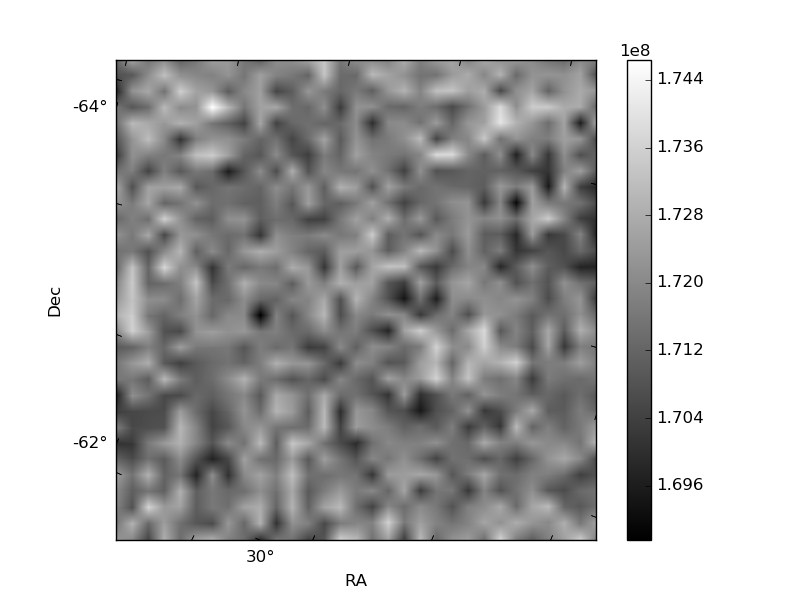
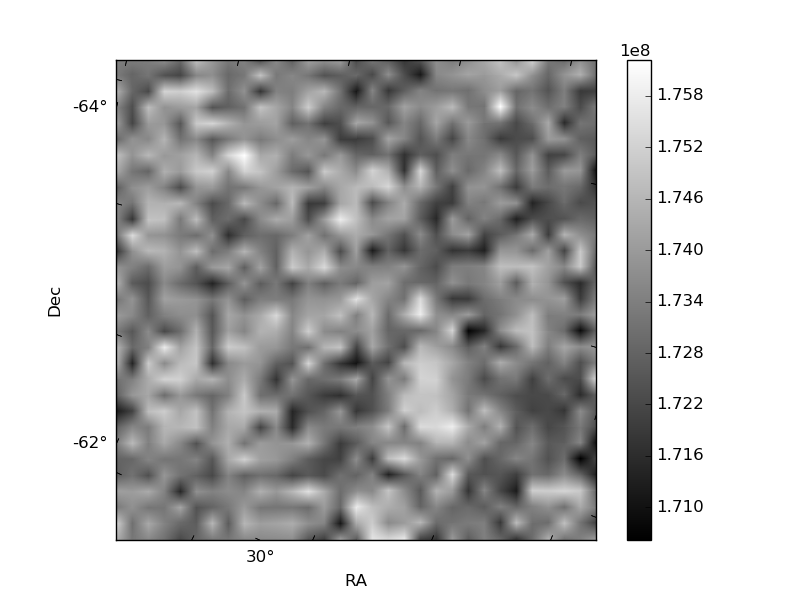
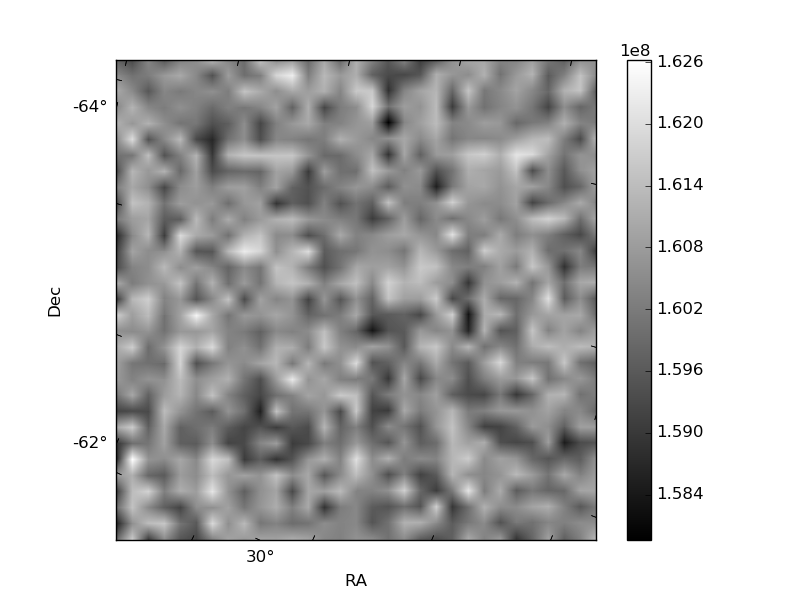
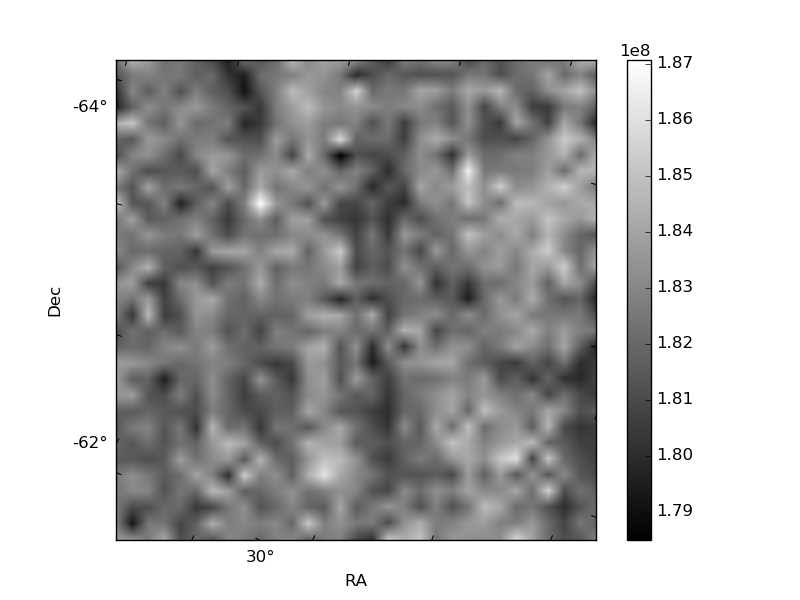
Histogram calculated using DETX and DETY for each event in the final _common_clean file
| Quadrant A | 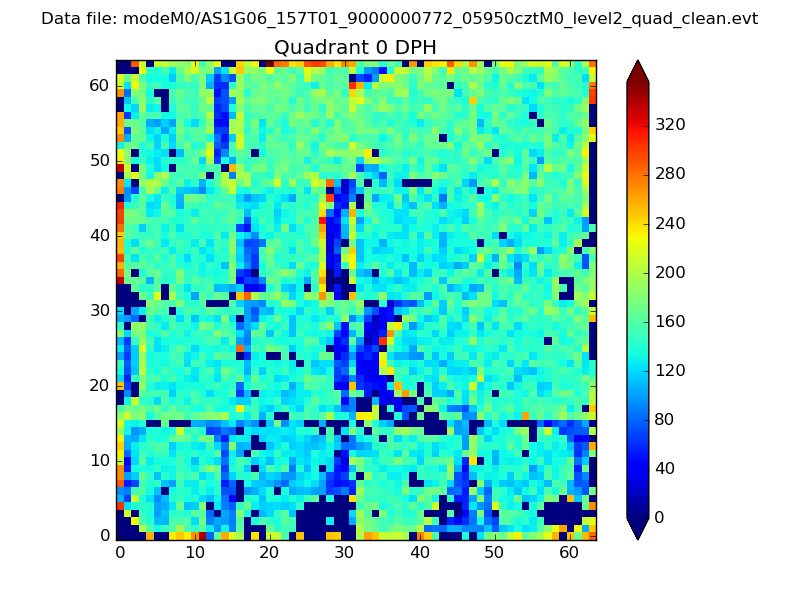 |
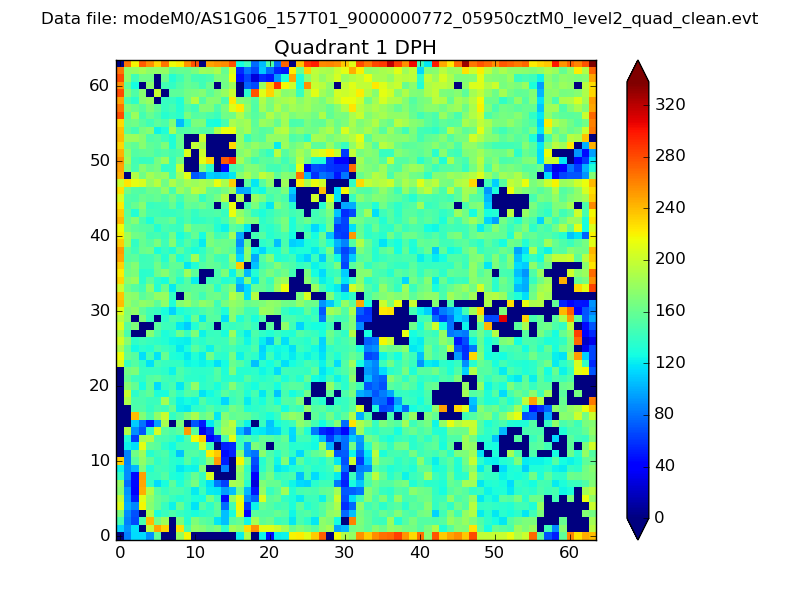 |
Quadrant B |
|---|---|---|---|
| Quadrant D | 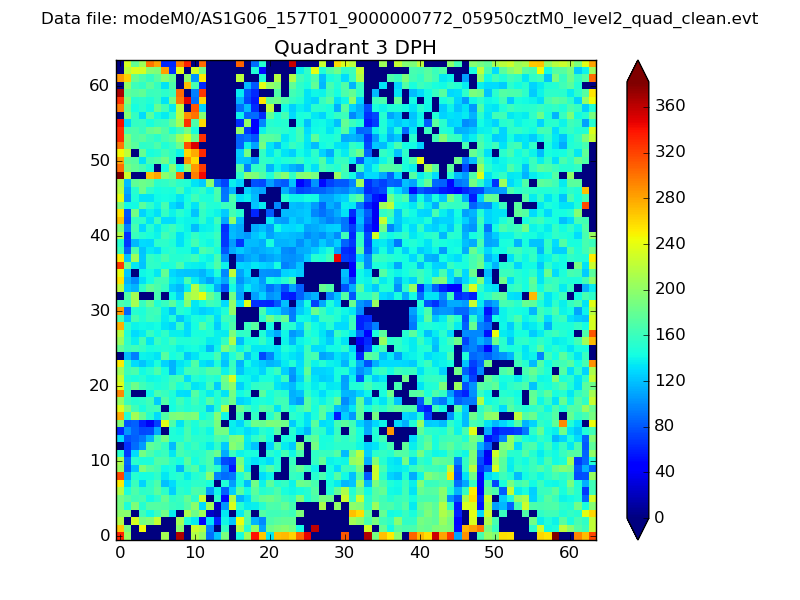 |
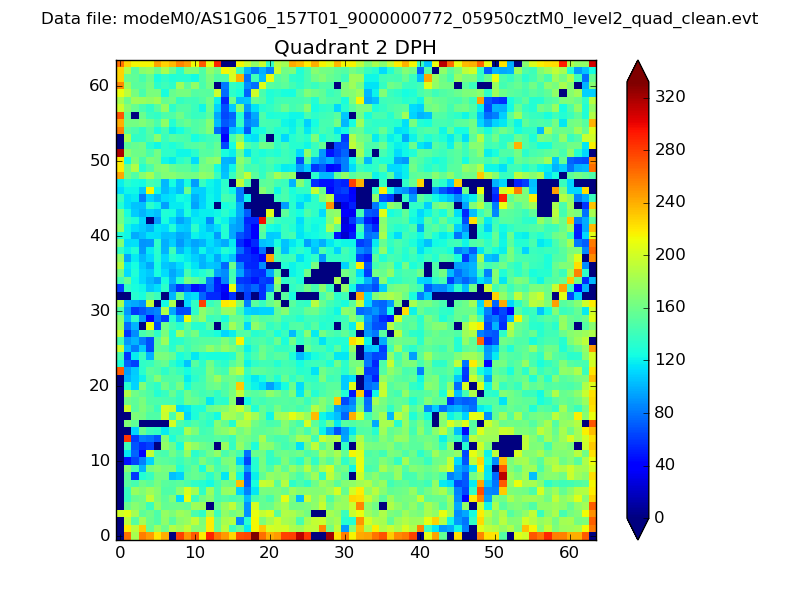 |
Quadrant C |
| Plot type | Count rate plots | Images |
|---|---|---|
| Comparison with Poisson distribution Blue bars denote a histogram of data divided into 1 sec bins. Red curve is a Poisson curve with rate = median count rate of data. |
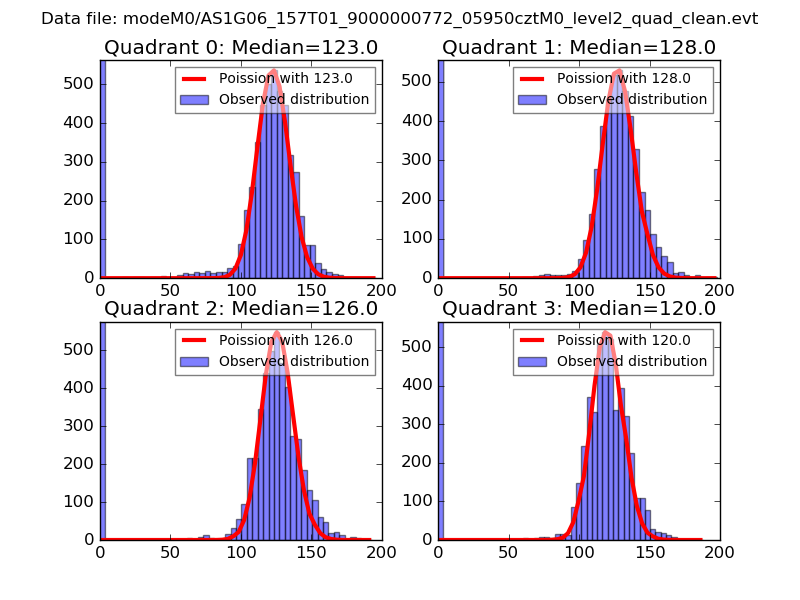 |
 |
| Quadrant-wise count rates Data is divided into 100 sec bins |
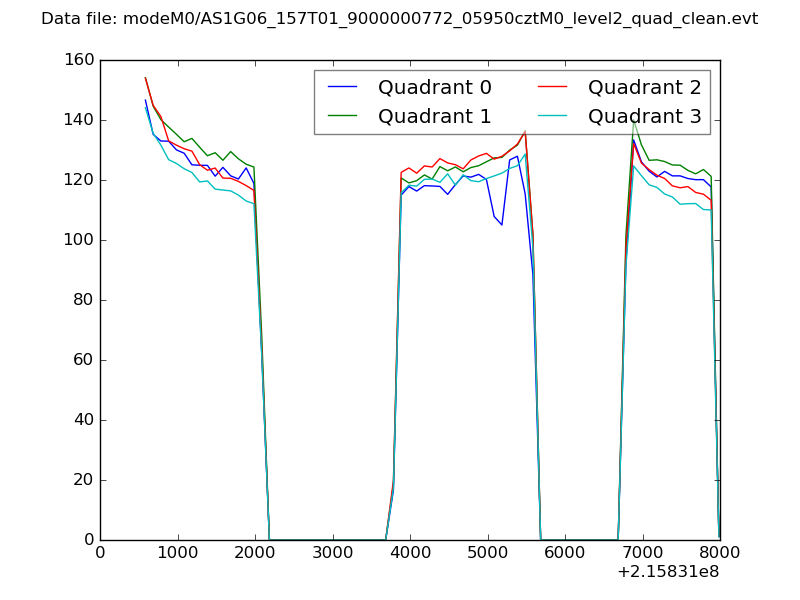 |
|
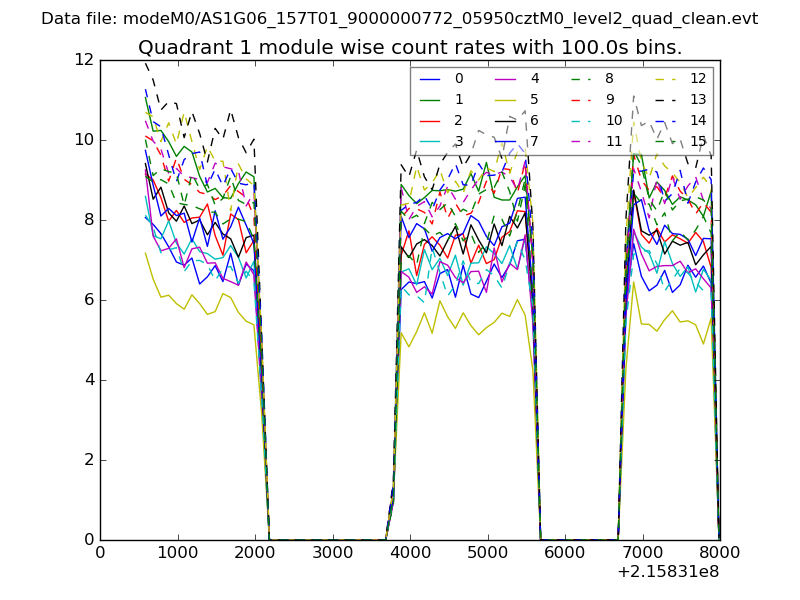
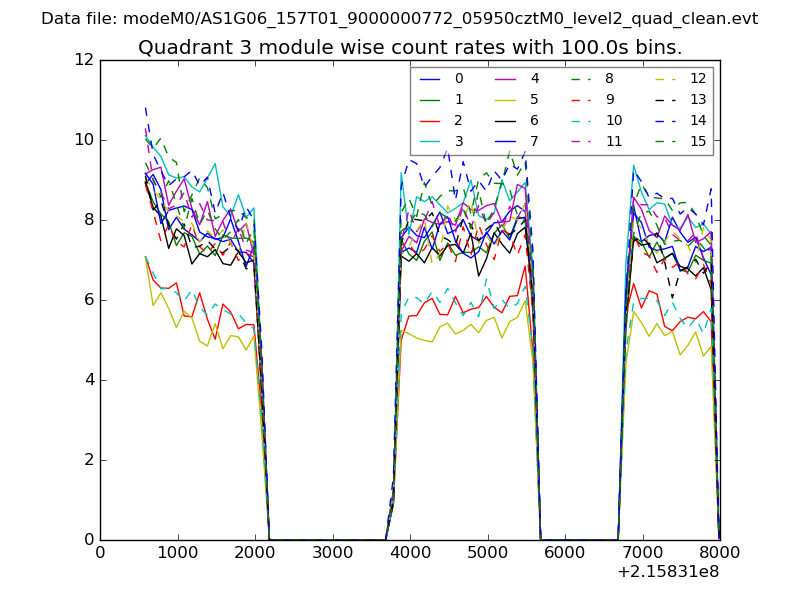
| Module-wise count rates for Quadrant A Data is divided into 100 sec bins |
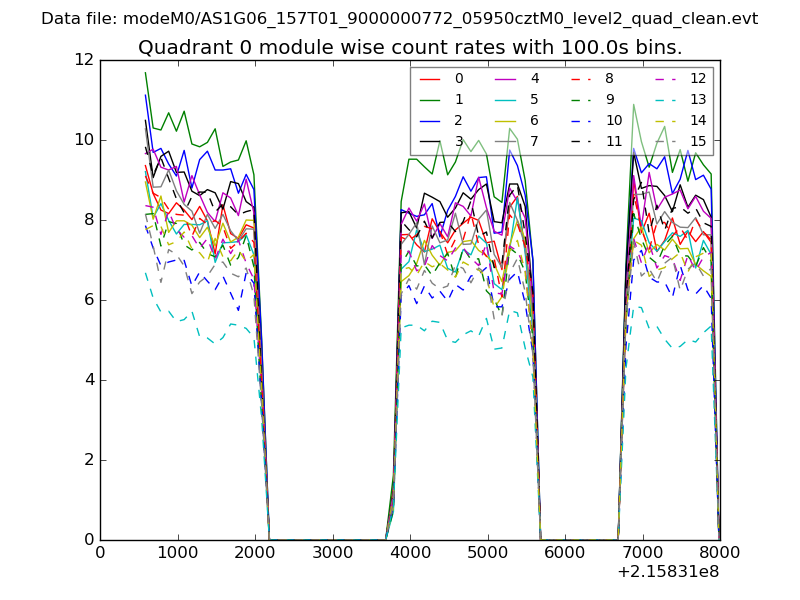 |
 |
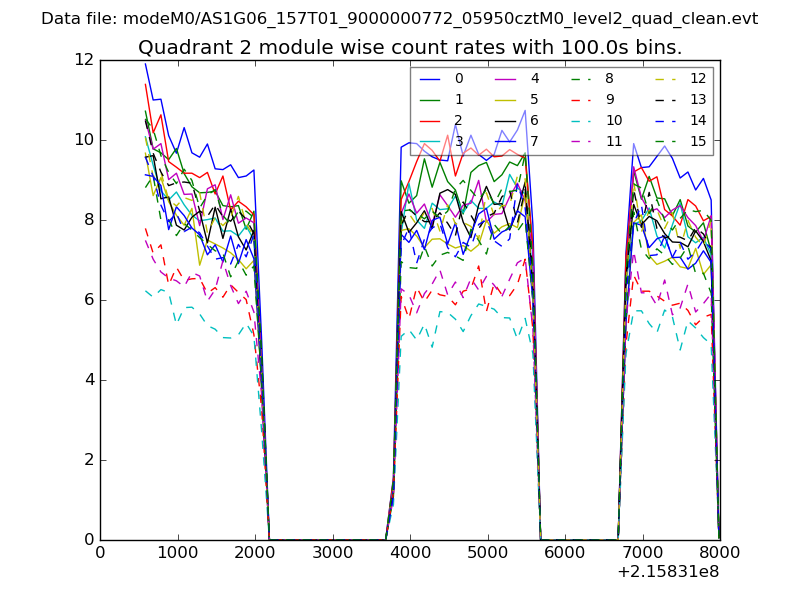
| Module-wise count rates for Quadrant B Data is divided into 100 sec bins |
 |
 |
| Module-wise count rates for Quadrant C Data is divided into 100 sec bins |
 |
 |
| Module-wise count rates for Quadrant D Data is divided into 100 sec bins |
 |
 |
| Parameter | Plot |
|---|---|
| CZT HV Monitor | 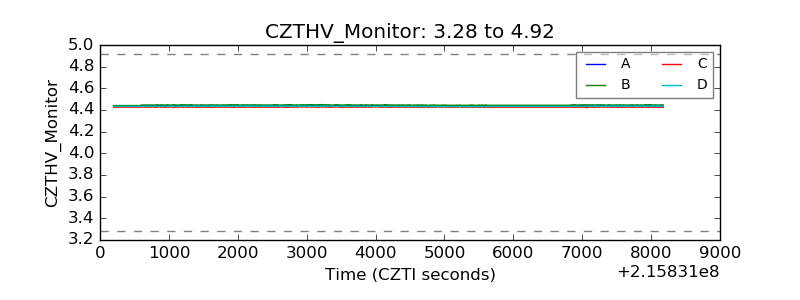 |
| D_VDD | 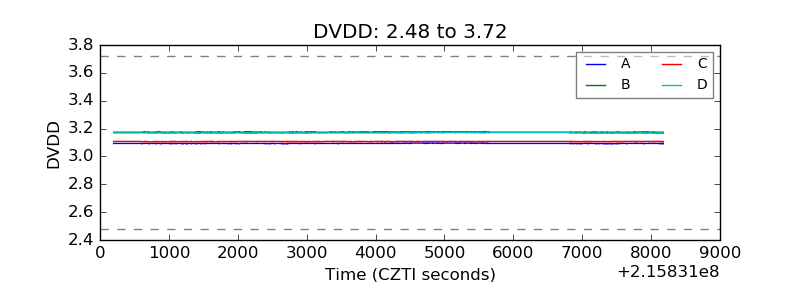 |
| Temperature 1 | 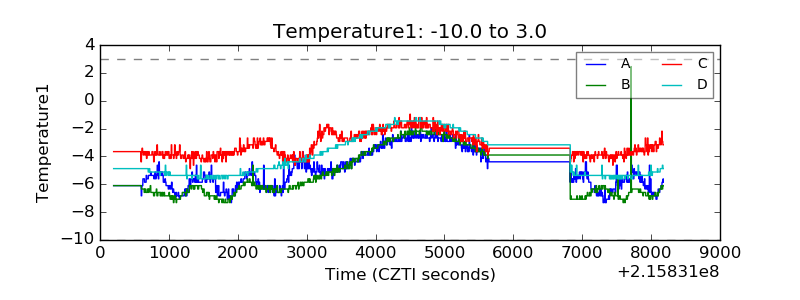 |
| Veto HV Monitor | 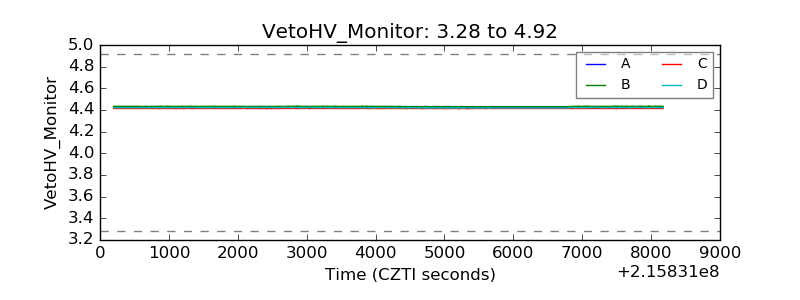 |
| Veto LLD | 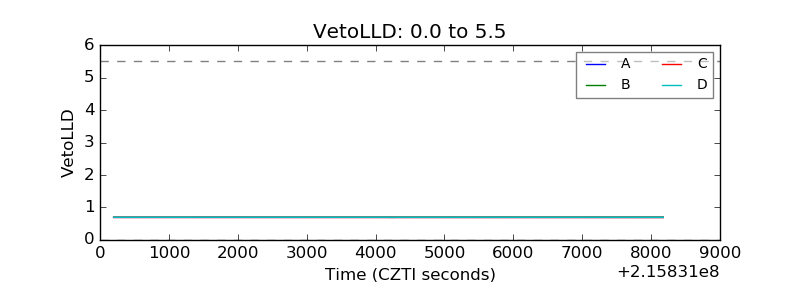 |
| Alpha Counter | 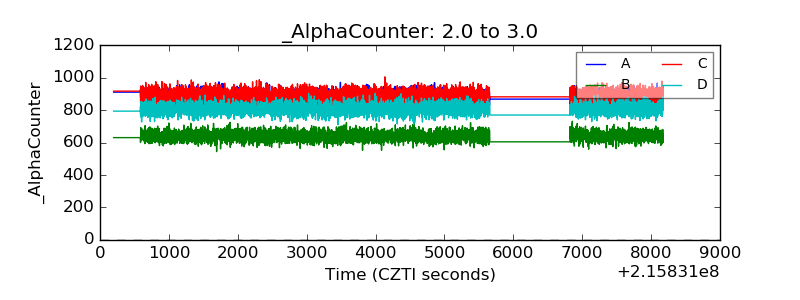 |
| _CPM_Rate | 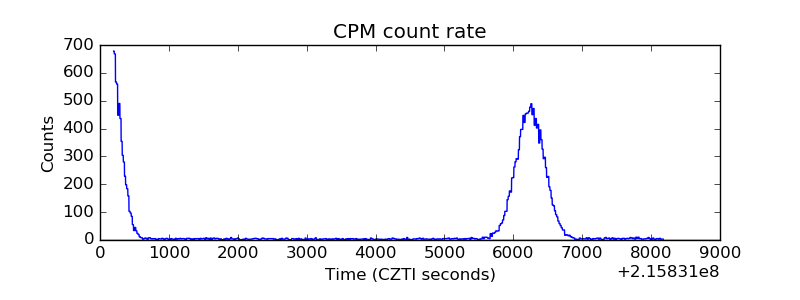 |
| CZT Counter | 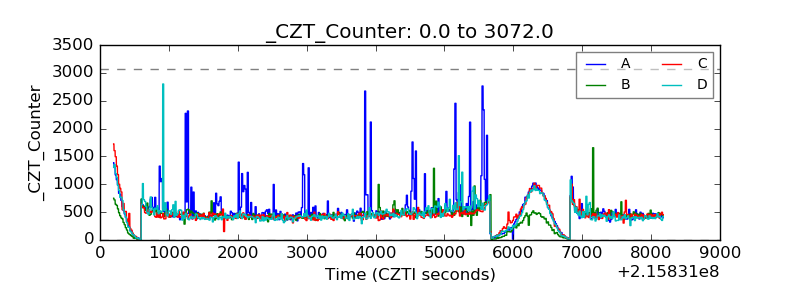 |
| +2.5 Volts monitor |  |
| +5 Volts monitor |  |
| _ROLL_ROT | 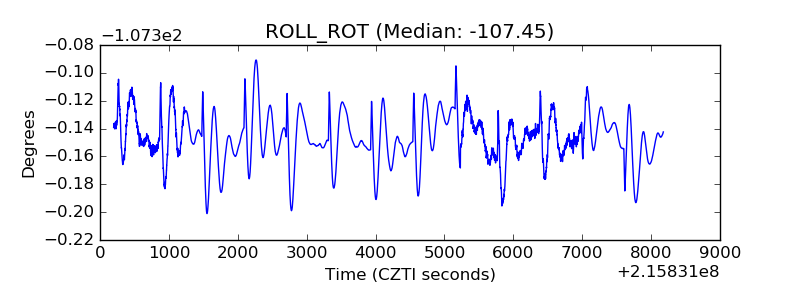 |
| _Roll_DEC | 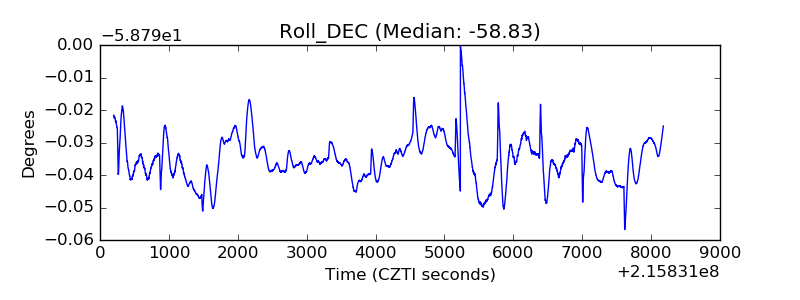 |
| _Roll_RA | 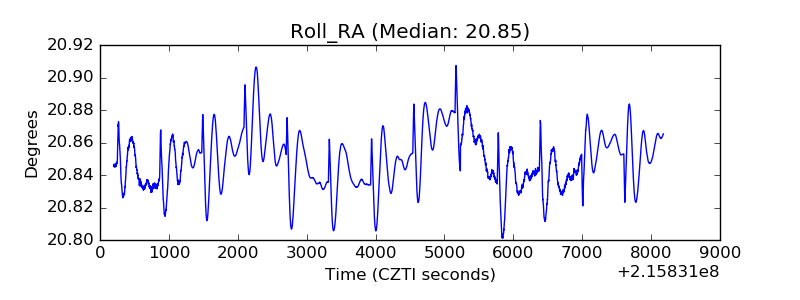 |
| Veto Counter |  |