| Param | Original file | Final file |
|---|---|---|
| Filename | modeM0/AS1G06_157T01_9000000772_05951cztM0_level2.evt | modeM0/AS1G06_157T01_9000000772_05951cztM0_level2_quad_clean.evt |
| Size (bytes) | 416,249,280 | 71,196,480 |
| Size | 397.0 MB | 67.9 MB |
| Events in quadrant A | 3,559,496 | 428,771 |
| Events in quadrant B | 2,669,840 | 444,651 |
| Events in quadrant C | 2,479,775 | 436,152 |
| Events in quadrant D | 3,512,230 | 450,875 |
| Mode M9 | |||
|---|---|---|---|
| Quadrant | BADHDUFLAG | Total packets | Discarded packets |
| A | 0 | 9 | 1 |
| B | 0 | 9 | 0 |
| C | 0 | 9 | 0 |
| D | 0 | 9 | 0 |
| Mode M0 | |||
|---|---|---|---|
| Quadrant | BADHDUFLAG | Total packets | Discarded packets |
| A | 0 | 16296 | 1792 |
| B | 0 | 13335 | 1522 |
| C | 0 | 13103 | 1601 |
| D | 0 | 16635 | 2047 |
| Mode SS | |||
|---|---|---|---|
| Quadrant | BADHDUFLAG | Total packets | Discarded packets |
| A | 0 | 130 | 16 |
| B | 0 | 130 | 14 |
| C | 0 | 129 | 19 |
| D | 0 | 130 | 16 |
| Quadrant | Total seconds | Saturated seconds | Saturation percentage |
|---|---|---|---|
| A | 5647 | 152 | 2.691695% |
| B | 5680 | 67 | 1.179577% |
| C | 5636 | 37 | 0.656494% |
| D | 5632 | 321 | 5.699574% |
Noise dominated data is calculated using 1-second bins in cleaned event files. If a bin has >2000 counts, and if more than 50% of those come from <1% of pixels, then it is considered to be noise-dominated and hence unusable.
| Quadrant | # 1 sec bins | Bins with >0 counts | Bins with >2000 counts | High rate bins dominated by noise | Noise dominated (total time) | Noise dominated (detector-on time) | Marked lightcurve |
|---|---|---|---|---|---|---|---|
| A | 7301 | 6037 | 70 | 70 | 0.96% | 1.16% | 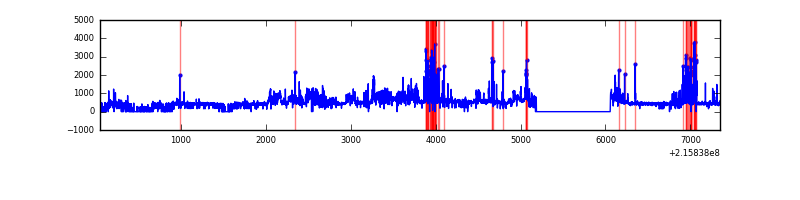 |
| B | 7300 | 6019 | 9 | 9 | 0.12% | 0.15% | 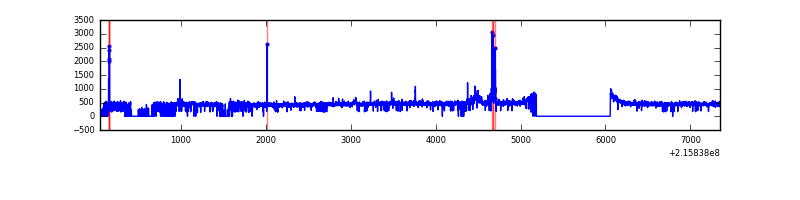 |
| C | 7301 | 6004 | 0 | 0 | 0.00% | 0.00% | 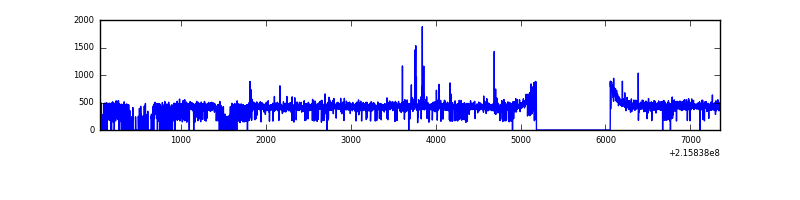 |
| D | 7297 | 5989 | 266 | 266 | 3.65% | 4.44% | 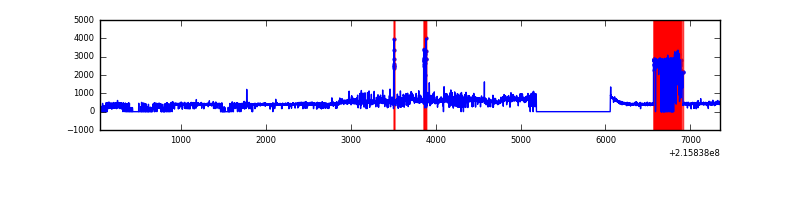 |
Top three noisy pixels from each quadrant. If the there are fewer than three noisy pixels in the level2.evt file, extra rows are filled as -1
| Pixel properties | Quadrant properties | ||||||
|---|---|---|---|---|---|---|---|
| Quadrant | DetID | PixID | Counts | Sigma | Mean | Median | Sigma |
| A | 13 | 251 | 612946 | 4678.84 | 632 | 617 | 130.9 |
| A | 4 | 2 | 503059 | 3839.18 | 632 | 617 | 130.9 |
| A | 8 | 192 | 10994 | 79.29 | 632 | 617 | 130.9 |
| B | 0 | 219 | 64699 | 515.47 | 650 | 634 | 124.3 |
| B | 15 | 255 | 49738 | 395.09 | 650 | 634 | 124.3 |
| B | 15 | 204 | 13990 | 107.46 | 650 | 634 | 124.3 |
| C | 1 | 16 | 26407 | 178.6 | 625 | 628 | 144.3 |
| C | 9 | 68 | 5014 | 30.39 | 625 | 628 | 144.3 |
| C | 13 | 61 | 5001 | 30.3 | 625 | 628 | 144.3 |
| D | 1 | 20 | 1030784 | 7054.86 | 602 | 582 | 146.0 |
| D | 2 | 63 | 196273 | 1340.1 | 602 | 582 | 146.0 |
| D | 2 | 152 | 8148 | 51.81 | 602 | 582 | 146.0 |
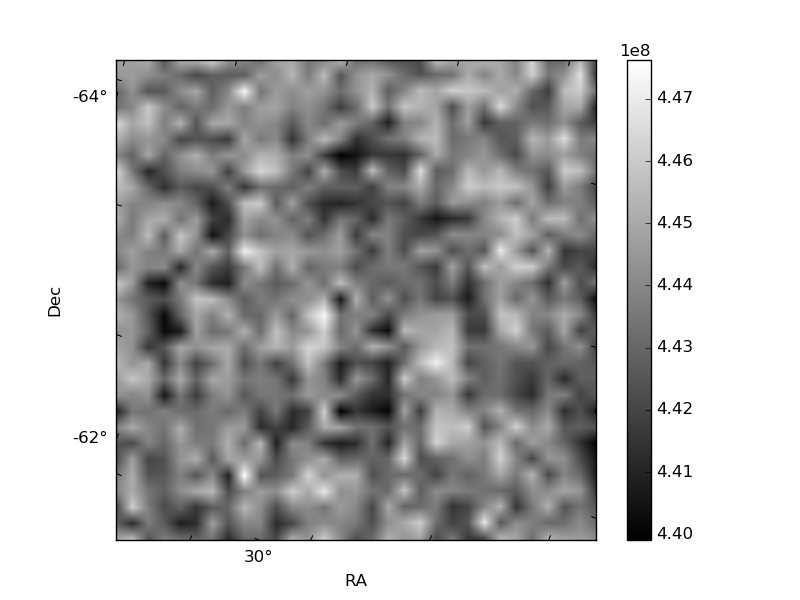
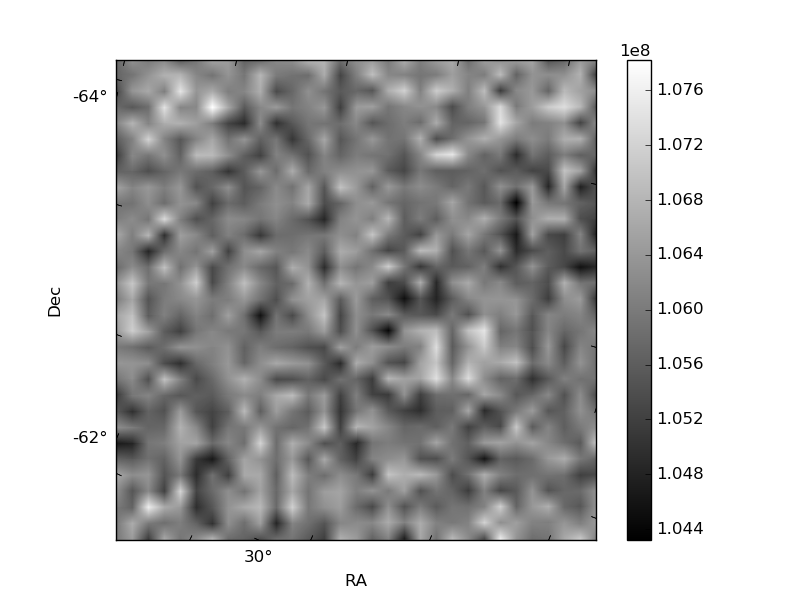
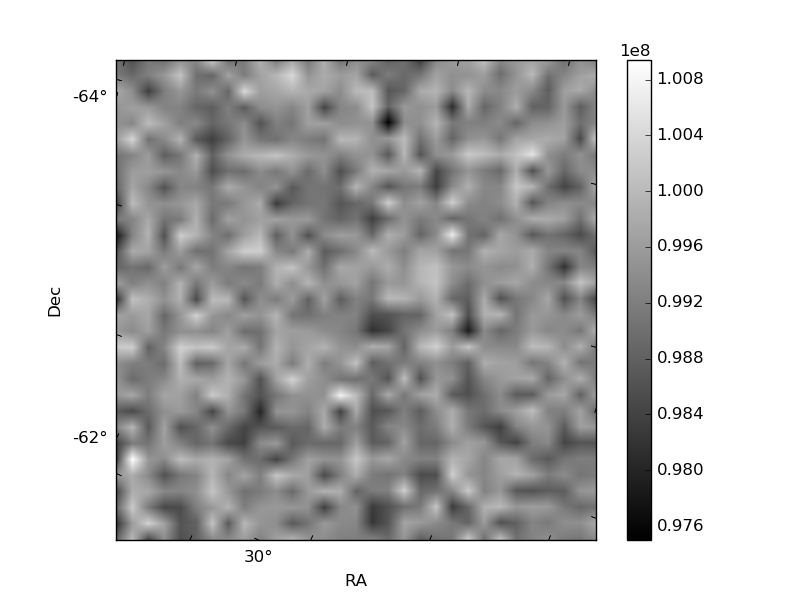
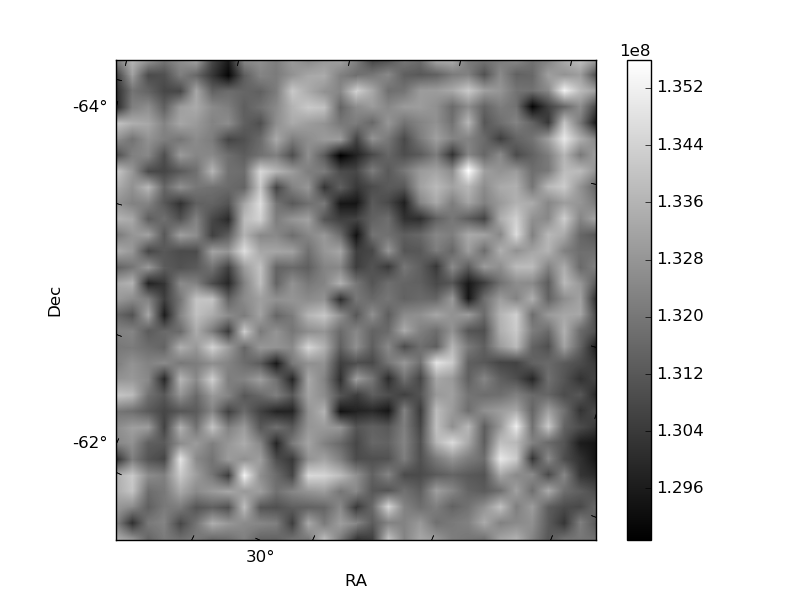
Histogram calculated using DETX and DETY for each event in the final _common_clean file
| Quadrant A | 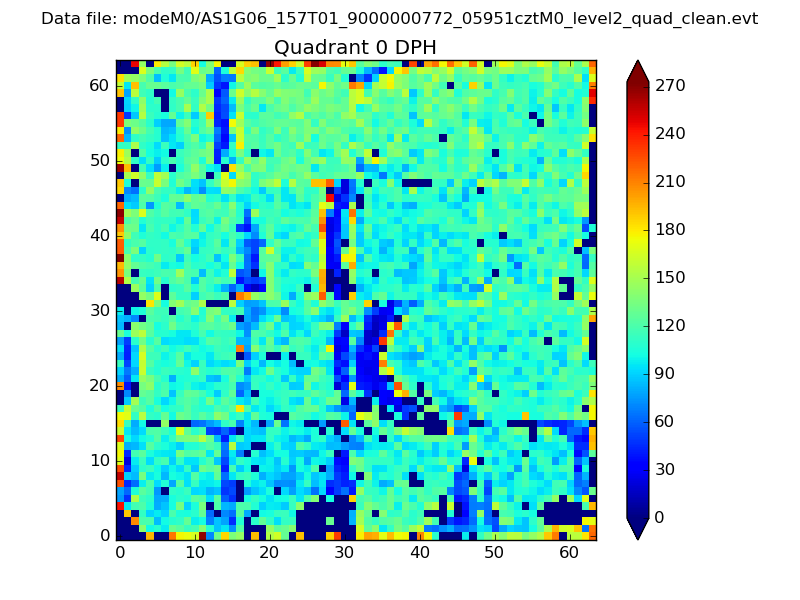 |
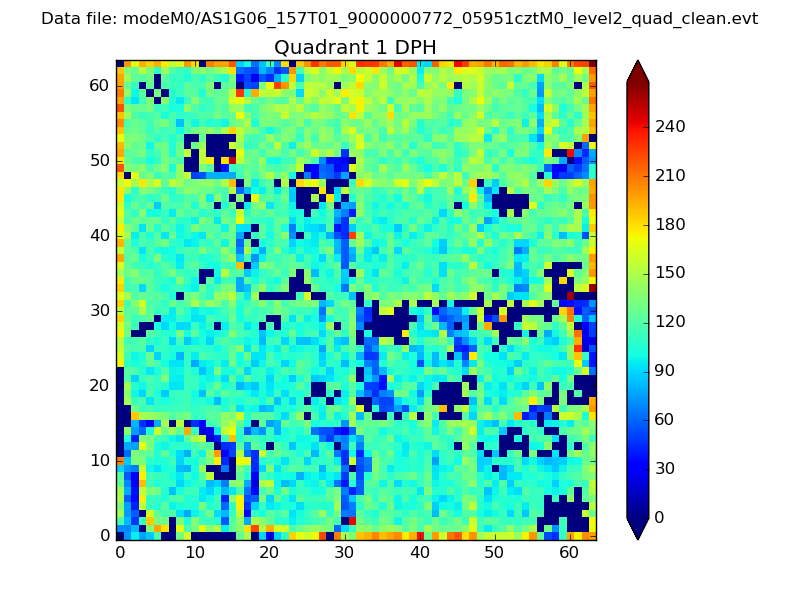 |
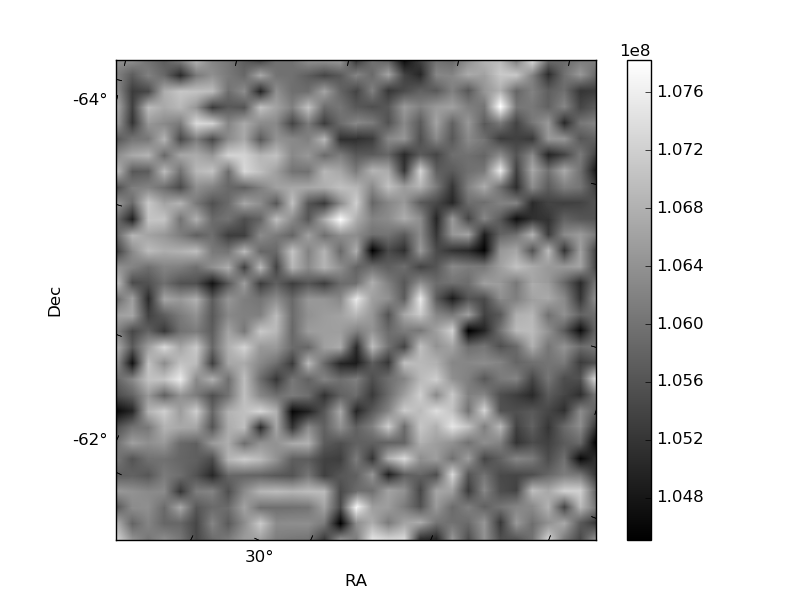
Quadrant B |
|---|---|---|---|
| Quadrant D | 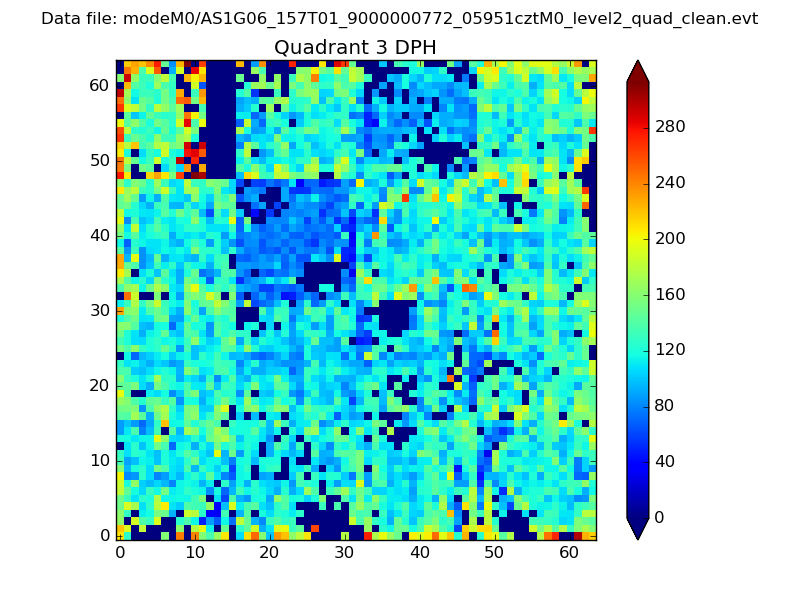 |
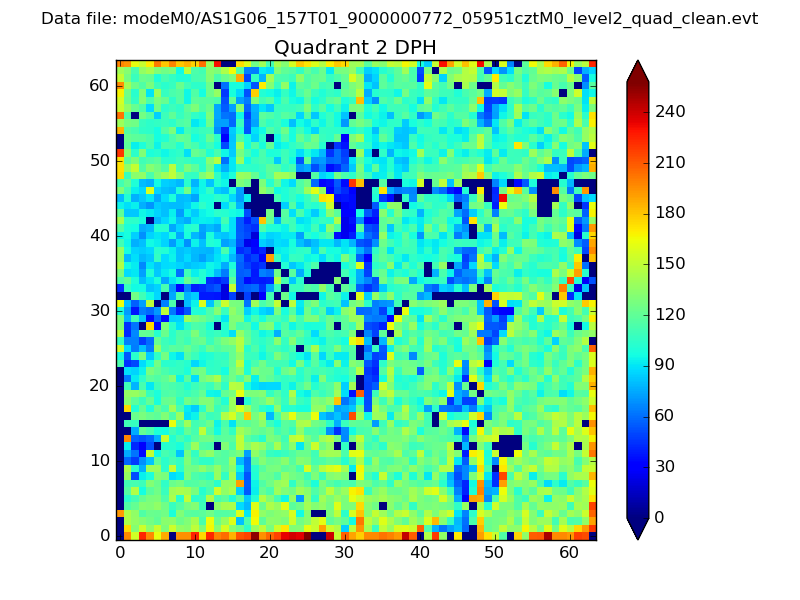 |
Quadrant C |
| Plot type | Count rate plots | Images |
|---|---|---|
| Comparison with Poisson distribution Blue bars denote a histogram of data divided into 1 sec bins. Red curve is a Poisson curve with rate = median count rate of data. |
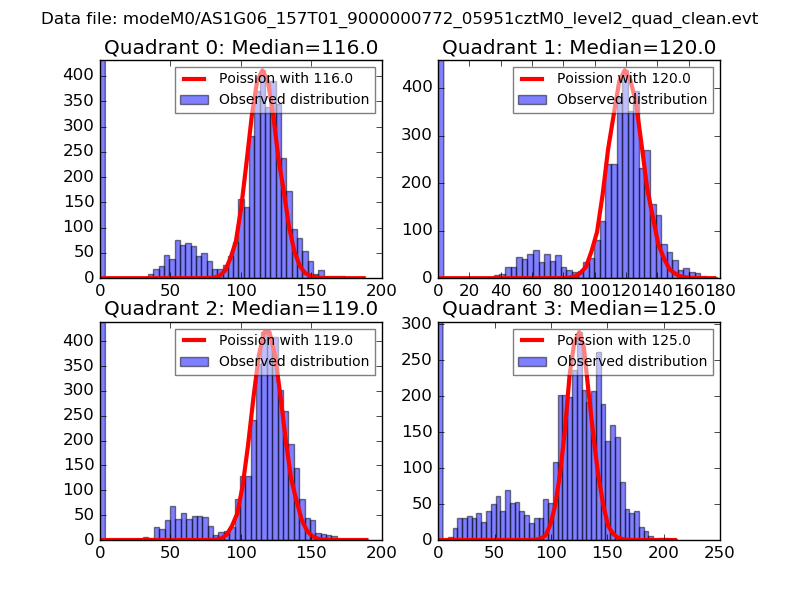 |
 |
| Quadrant-wise count rates Data is divided into 100 sec bins |
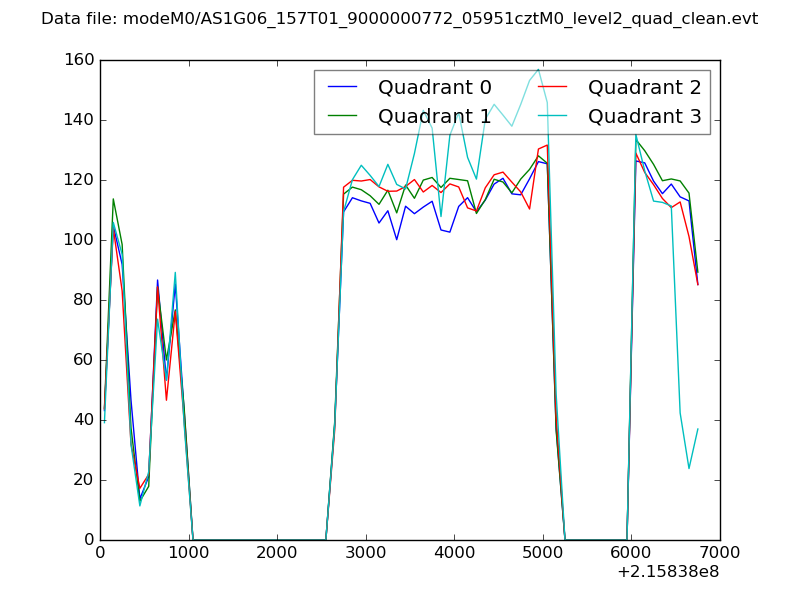 |
|
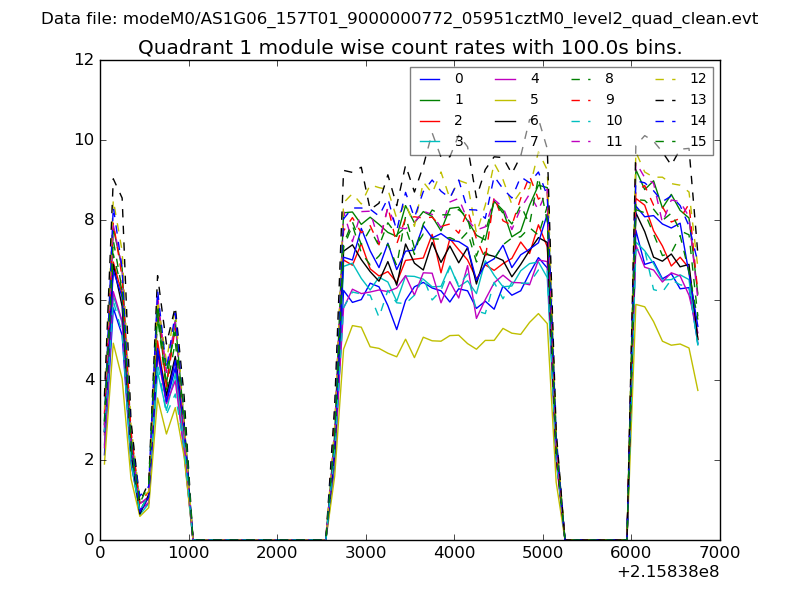
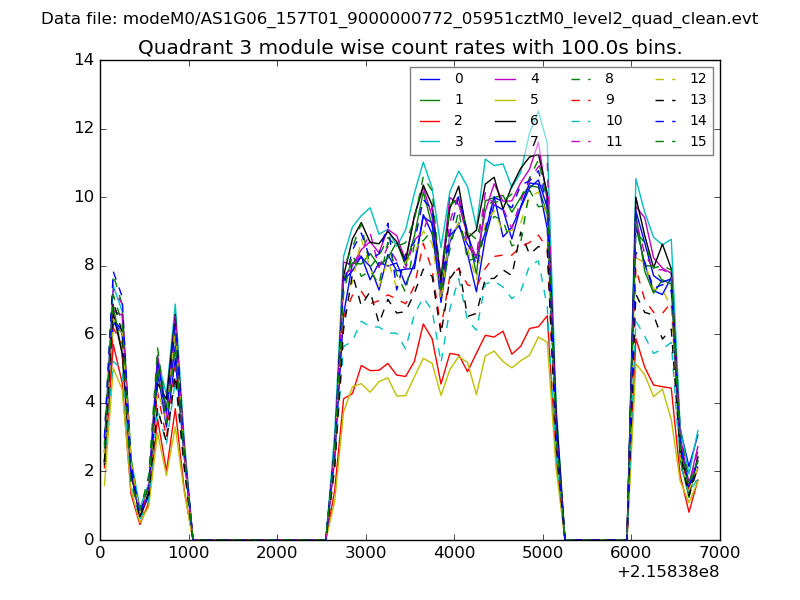
| Module-wise count rates for Quadrant A Data is divided into 100 sec bins |
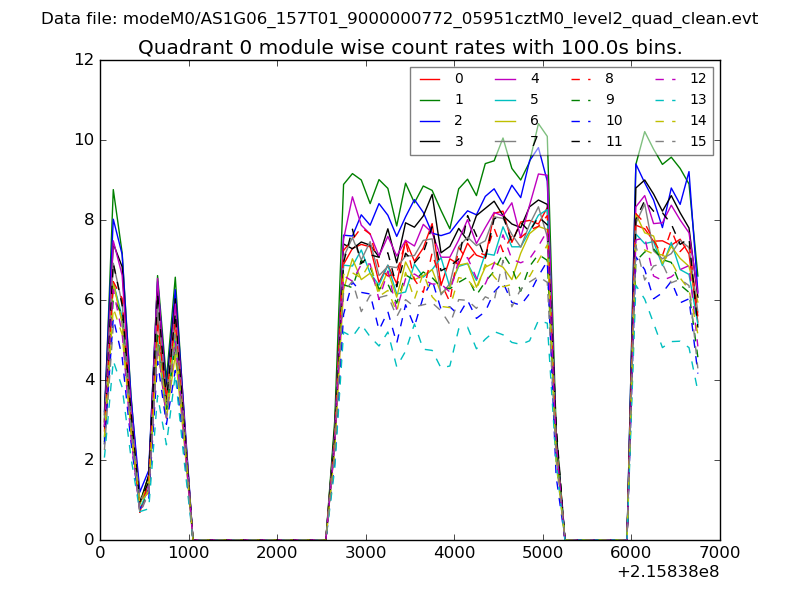 |
 |
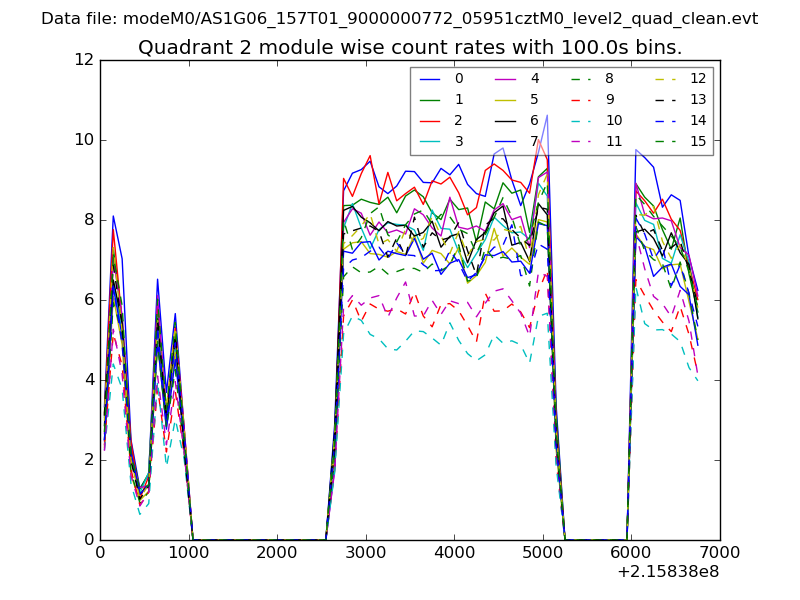
| Module-wise count rates for Quadrant B Data is divided into 100 sec bins |
 |
 |
| Module-wise count rates for Quadrant C Data is divided into 100 sec bins |
 |
 |
| Module-wise count rates for Quadrant D Data is divided into 100 sec bins |
 |
 |
| Parameter | Plot |
|---|---|
| CZT HV Monitor | 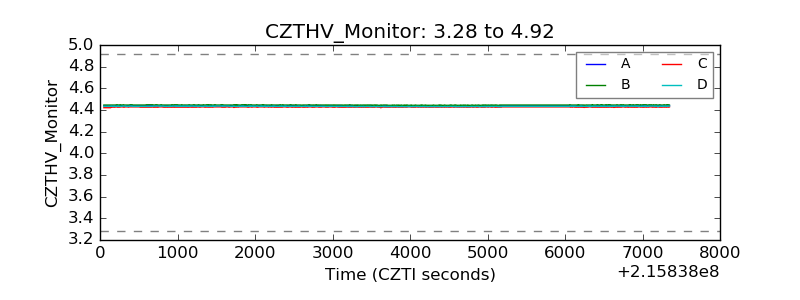 |
| D_VDD | 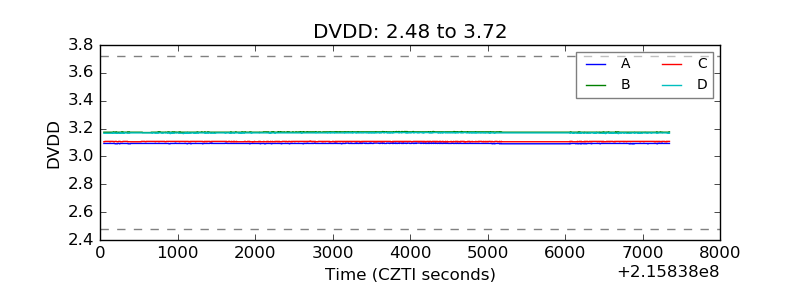 |
| Temperature 1 | 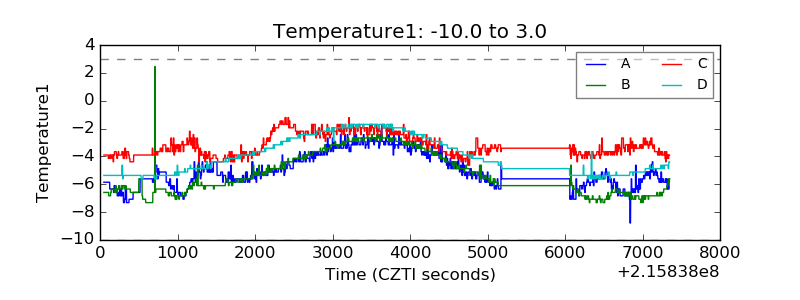 |
| Veto HV Monitor |  |
| Veto LLD | 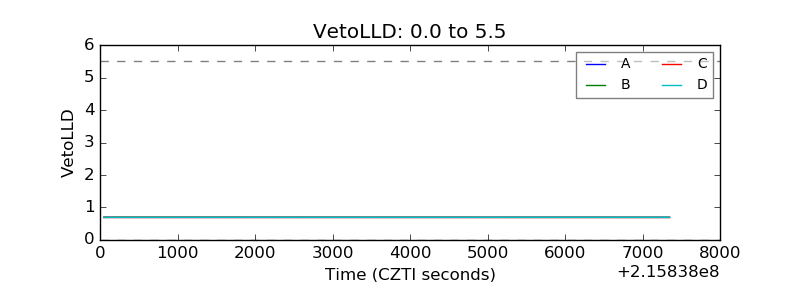 |
| Alpha Counter | 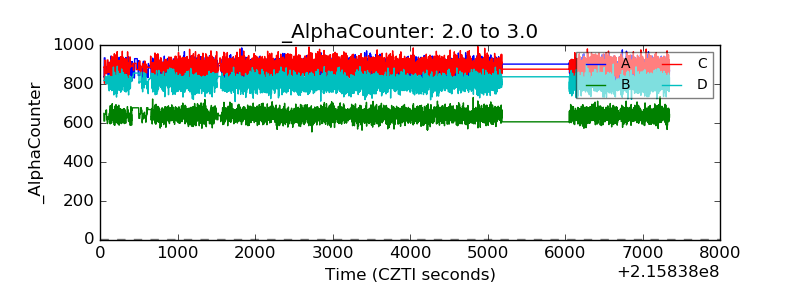 |
| _CPM_Rate | 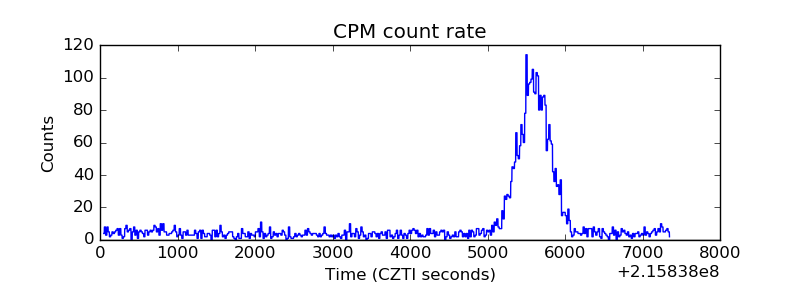 |
| CZT Counter | 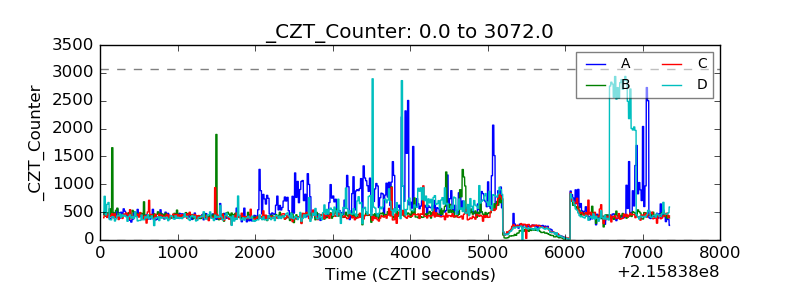 |
| +2.5 Volts monitor |  |
| +5 Volts monitor |  |
| _ROLL_ROT | 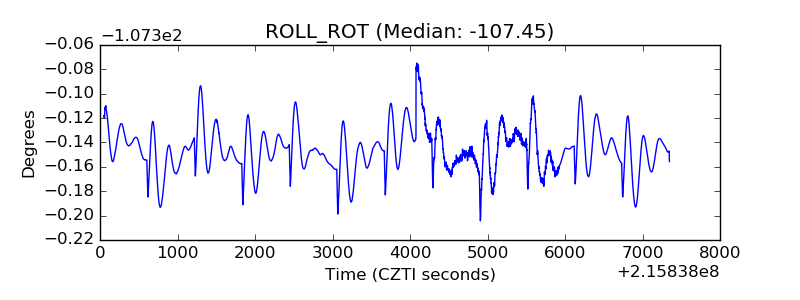 |
| _Roll_DEC | 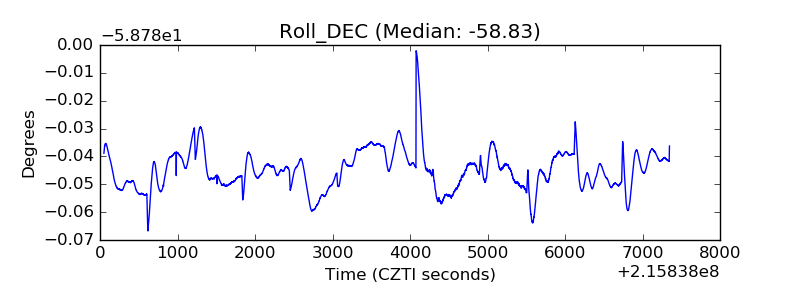 |
| _Roll_RA | 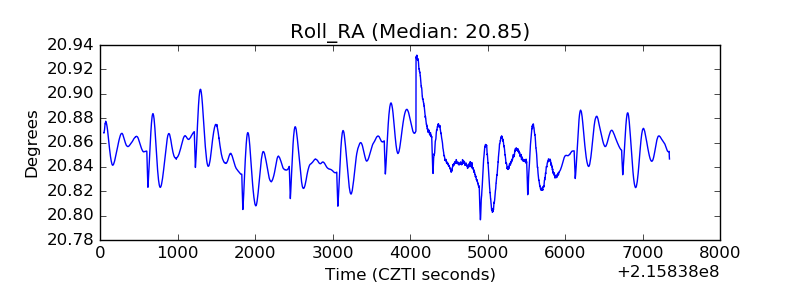 |
| Veto Counter | 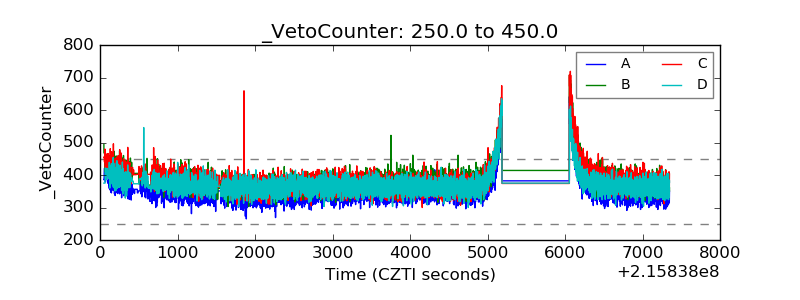 |