| Param | Original file | Final file |
|---|---|---|
| Filename | modeM0/AS1G06_157T01_9000000772_05952cztM0_level2.evt | modeM0/AS1G06_157T01_9000000772_05952cztM0_level2_quad_clean.evt |
| Size (bytes) | 666,037,440 | 108,887,040 |
| Size | 635.2 MB | 103.8 MB |
| Events in quadrant A | 5,524,088 | 651,172 |
| Events in quadrant B | 4,350,804 | 702,437 |
| Events in quadrant C | 4,183,034 | 682,532 |
| Events in quadrant D | 5,477,307 | 612,227 |
| Mode M9 | |||
|---|---|---|---|
| Quadrant | BADHDUFLAG | Total packets | Discarded packets |
| A | 0 | 13 | 2 |
| B | 0 | 13 | 4 |
| C | 0 | 13 | 2 |
| D | 0 | 13 | 3 |
| Mode M0 | |||
|---|---|---|---|
| Quadrant | BADHDUFLAG | Total packets | Discarded packets |
| A | 0 | 28641 | 5797 |
| B | 0 | 23888 | 4438 |
| C | 0 | 23620 | 4182 |
| D | 0 | 29036 | 6172 |
| Mode SS | |||
|---|---|---|---|
| Quadrant | BADHDUFLAG | Total packets | Discarded packets |
| A | 0 | 232 | 30 |
| B | 0 | 232 | 50 |
| C | 0 | 232 | 44 |
| D | 0 | 232 | 44 |
| Quadrant | Total seconds | Saturated seconds | Saturation percentage |
|---|---|---|---|
| A | 9245 | 318 | 3.439697% |
| B | 9405 | 160 | 1.701223% |
| C | 9463 | 123 | 1.299799% |
| D | 9194 | 363 | 3.948227% |
Noise dominated data is calculated using 1-second bins in cleaned event files. If a bin has >2000 counts, and if more than 50% of those come from <1% of pixels, then it is considered to be noise-dominated and hence unusable.
| Quadrant | # 1 sec bins | Bins with >0 counts | Bins with >2000 counts | High rate bins dominated by noise | Noise dominated (total time) | Noise dominated (detector-on time) | Marked lightcurve |
|---|---|---|---|---|---|---|---|
| A | 12687 | 10588 | 125 | 125 | 0.99% | 1.18% | 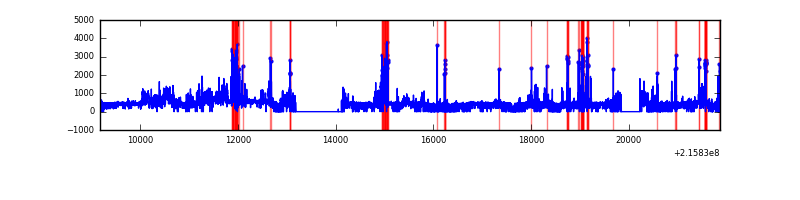 |
| B | 12685 | 10698 | 5 | 5 | 0.04% | 0.05% | 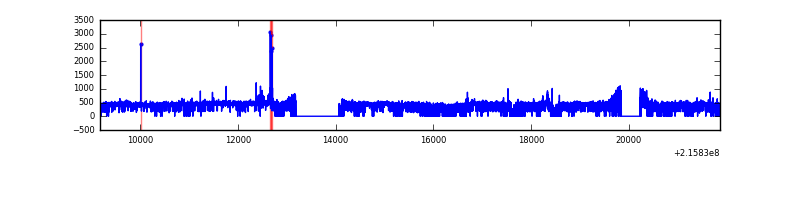 |
| C | 12686 | 10723 | 0 | 0 | 0.00% | 0.00% | 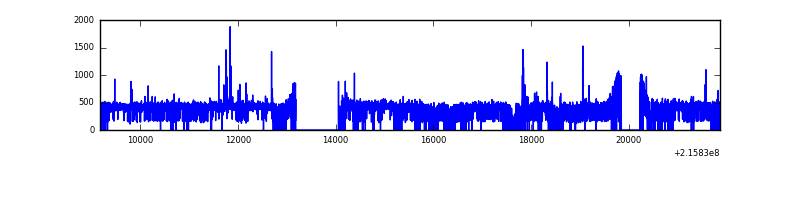 |
| D | 12686 | 10510 | 219 | 219 | 1.73% | 2.08% |  |
Top three noisy pixels from each quadrant. If the there are fewer than three noisy pixels in the level2.evt file, extra rows are filled as -1
| Pixel properties | Quadrant properties | ||||||
|---|---|---|---|---|---|---|---|
| Quadrant | DetID | PixID | Counts | Sigma | Mean | Median | Sigma |
| A | 4 | 2 | 815205 | 3817.26 | 1036 | 1010 | 213.3 |
| A | 13 | 251 | 706165 | 3306.04 | 1036 | 1010 | 213.3 |
| A | 8 | 192 | 20160 | 89.78 | 1036 | 1010 | 213.3 |
| B | 0 | 219 | 66285 | 316.87 | 1076 | 1048 | 205.9 |
| B | 15 | 255 | 66172 | 316.32 | 1076 | 1048 | 205.9 |
| B | 15 | 204 | 20840 | 96.13 | 1076 | 1048 | 205.9 |
| C | 1 | 16 | 39411 | 158.11 | 1052 | 1058 | 242.6 |
| C | 9 | 54 | 21947 | 86.11 | 1052 | 1058 | 242.6 |
| C | 9 | 68 | 11276 | 42.12 | 1052 | 1058 | 242.6 |
| D | 1 | 20 | 996653 | 4105.93 | 1001 | 969 | 242.5 |
| D | 2 | 63 | 635140 | 2615.15 | 1001 | 969 | 242.5 |
| D | 2 | 14 | 19945 | 78.25 | 1001 | 969 | 242.5 |
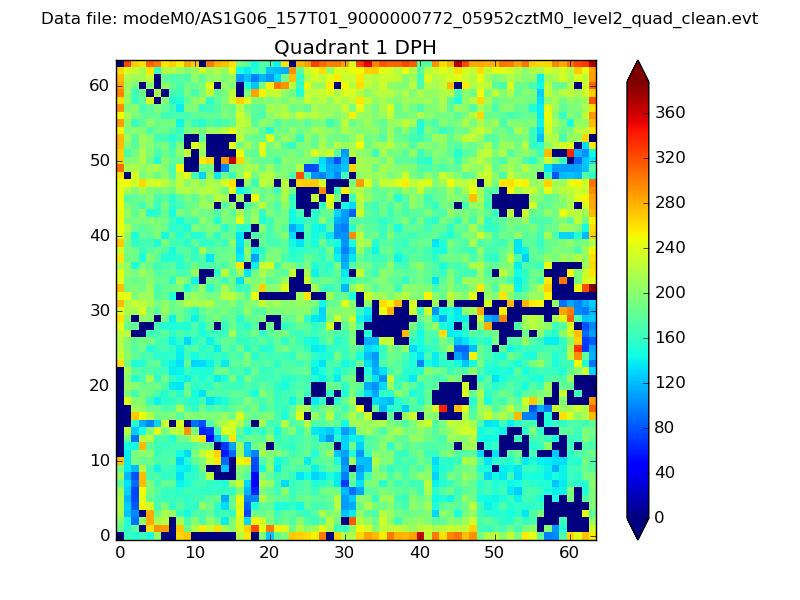
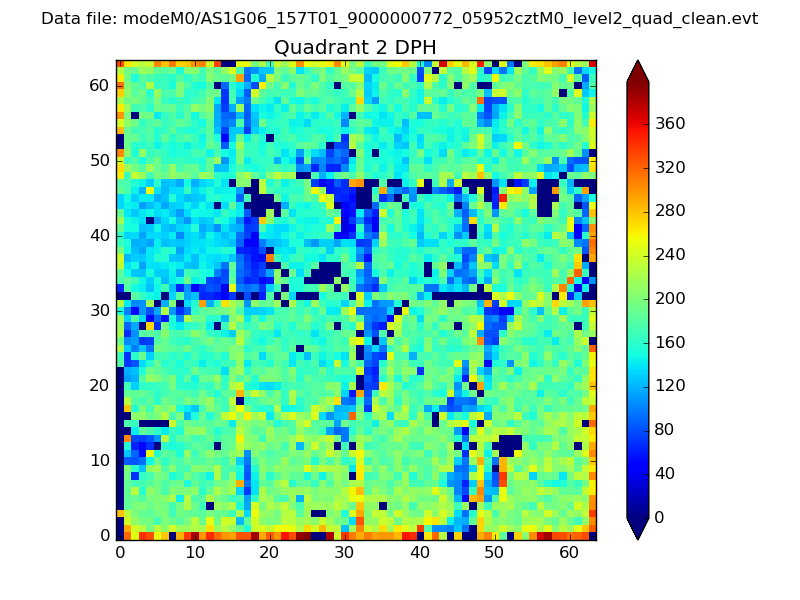
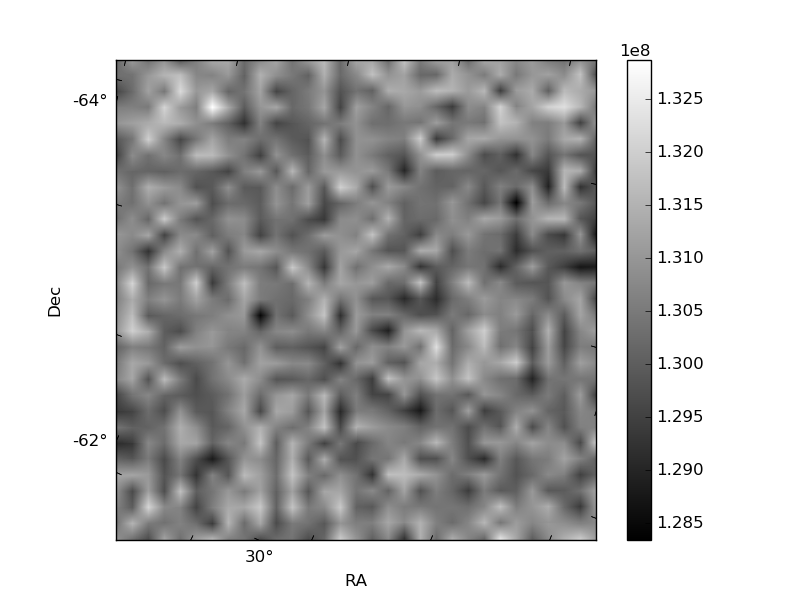
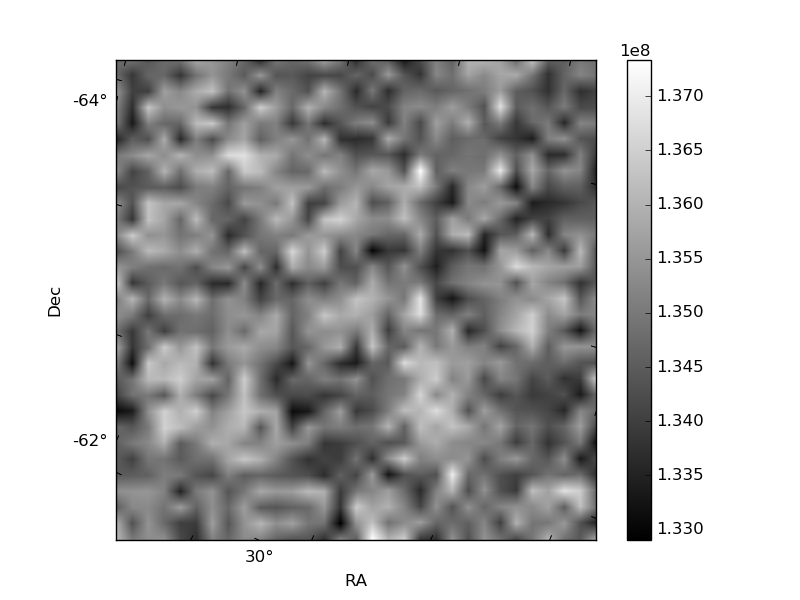
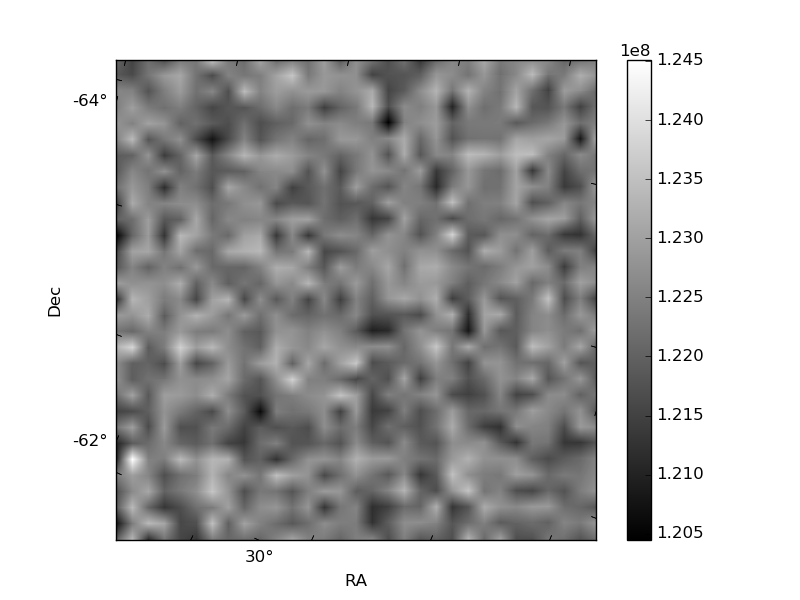
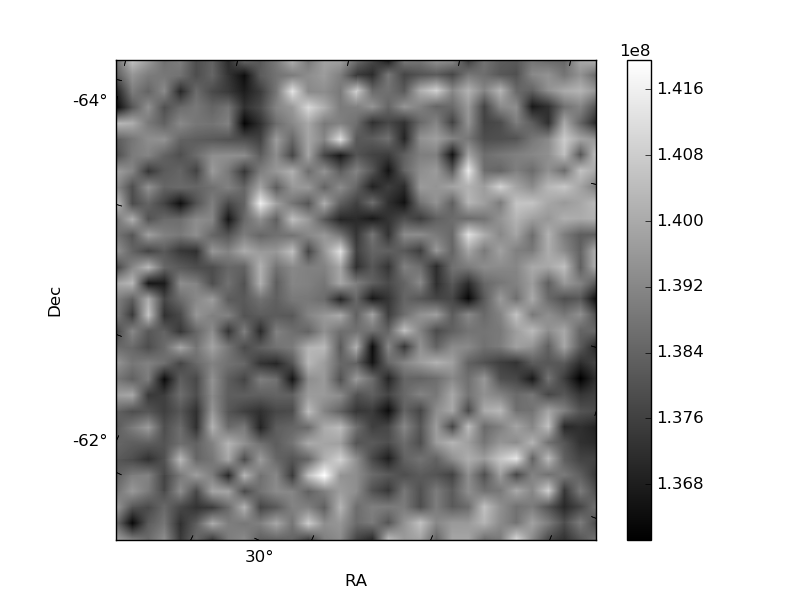
Histogram calculated using DETX and DETY for each event in the final _common_clean file
| Quadrant A | 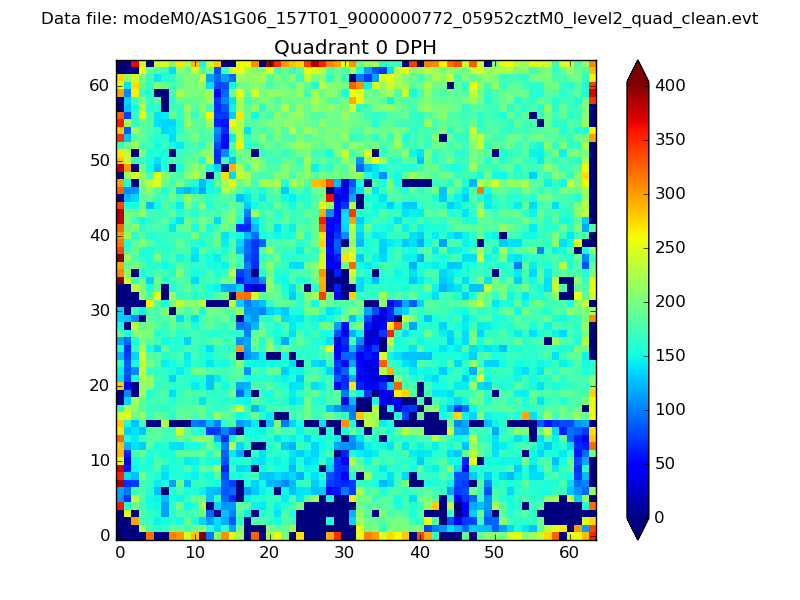 |
 |
Quadrant B |
|---|---|---|---|
| Quadrant D |  |
 |
Quadrant C |
| Plot type | Count rate plots | Images |
|---|---|---|
| Comparison with Poisson distribution Blue bars denote a histogram of data divided into 1 sec bins. Red curve is a Poisson curve with rate = median count rate of data. |
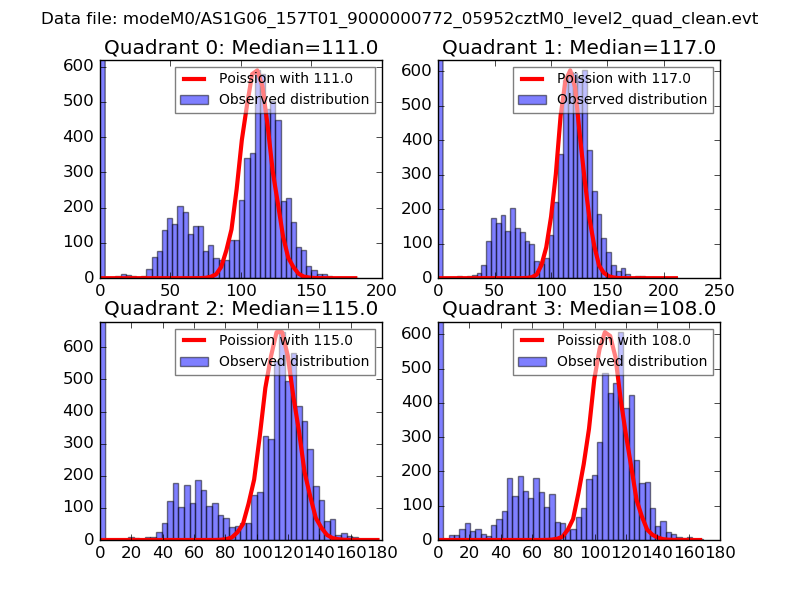 |
 |
| Quadrant-wise count rates Data is divided into 100 sec bins |
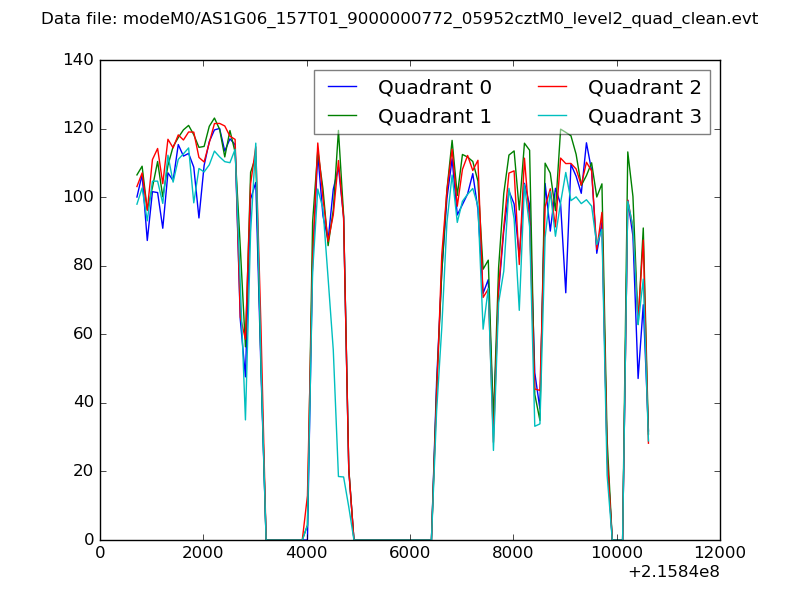 |
|
| Module-wise count rates for Quadrant A Data is divided into 100 sec bins |
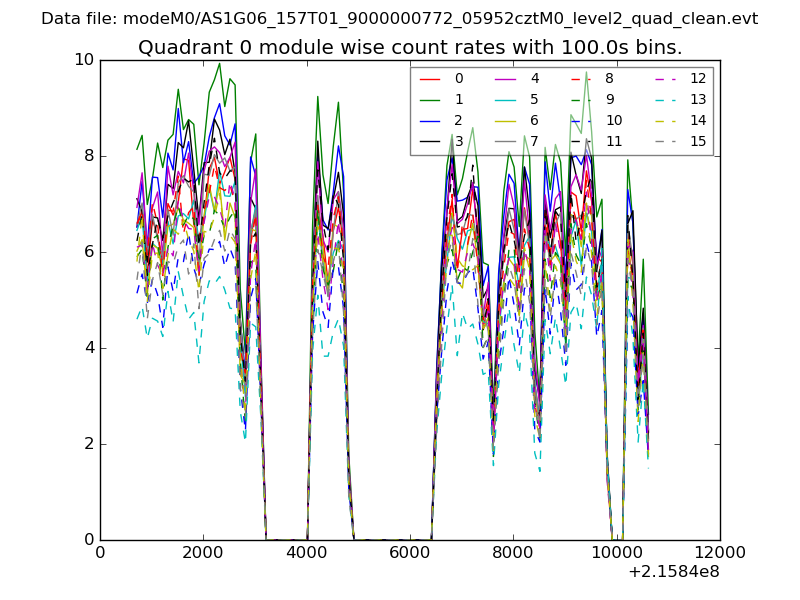 |
 |
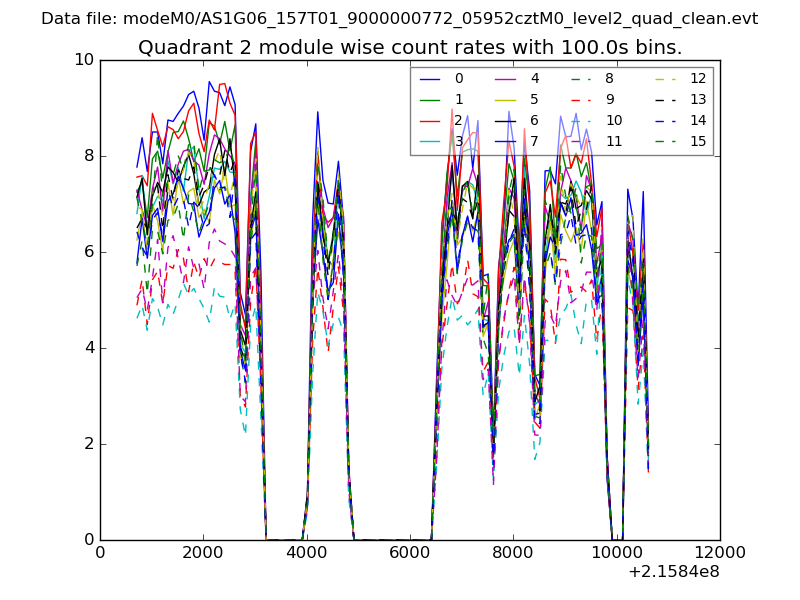
| Module-wise count rates for Quadrant B Data is divided into 100 sec bins |
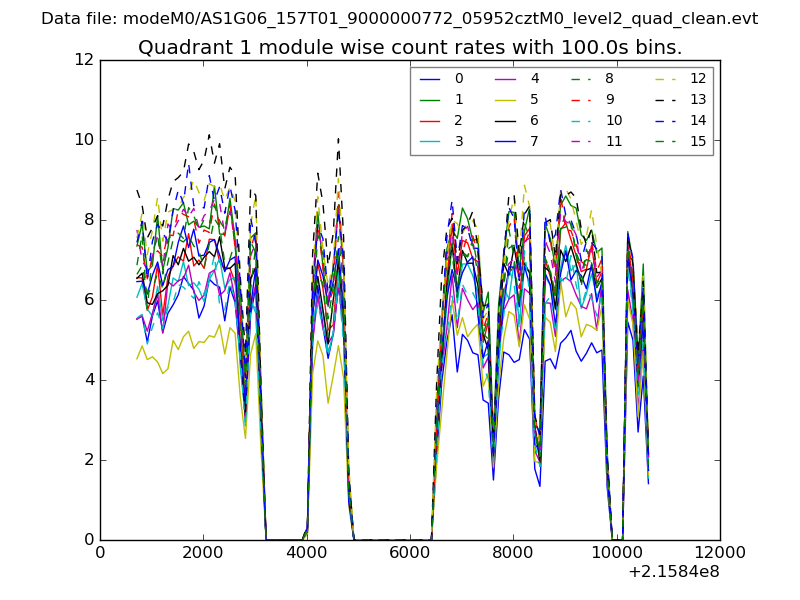 |
 |
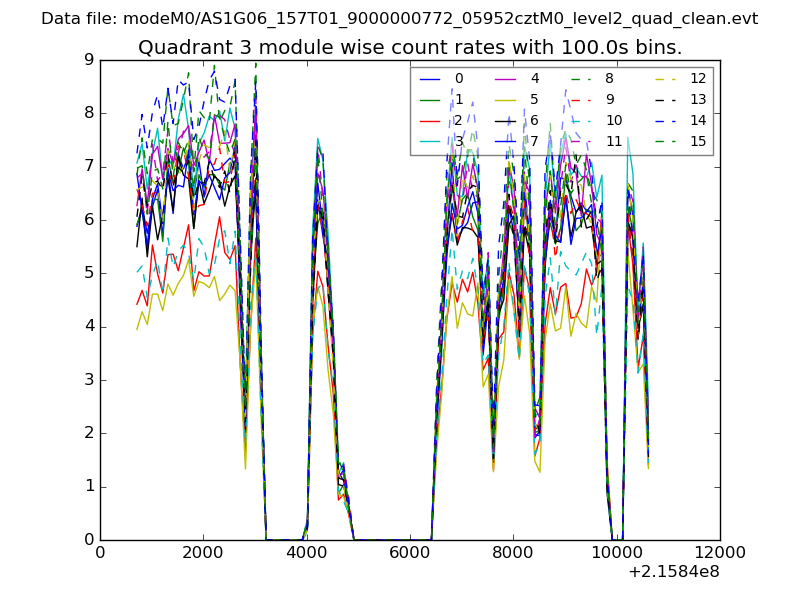
| Module-wise count rates for Quadrant C Data is divided into 100 sec bins |
 |
 |
| Module-wise count rates for Quadrant D Data is divided into 100 sec bins |
 |
 |
| Parameter | Plot |
|---|---|
| CZT HV Monitor | 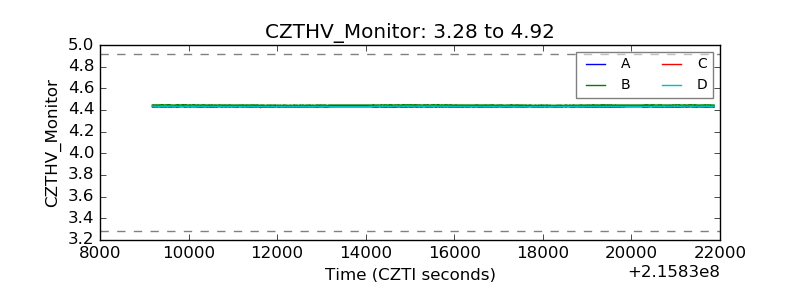 |
| D_VDD | 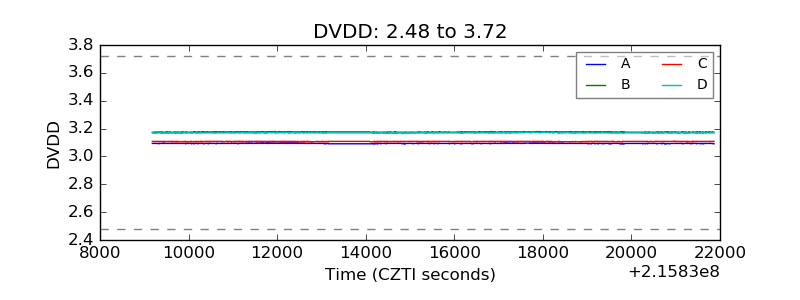 |
| Temperature 1 | 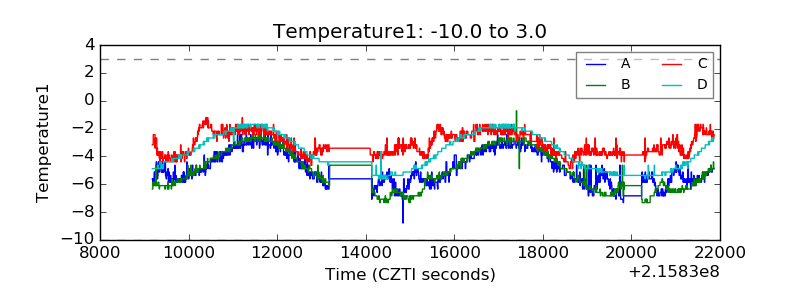 |
| Veto HV Monitor | 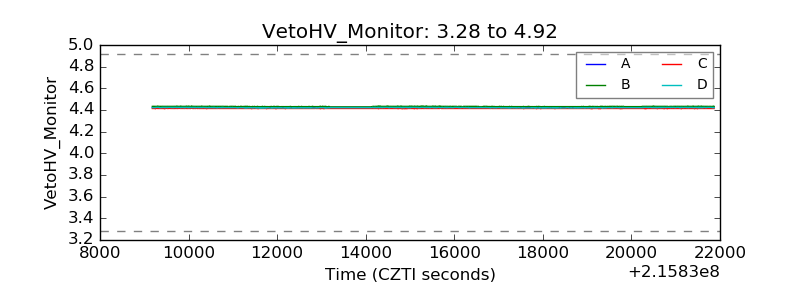 |
| Veto LLD | 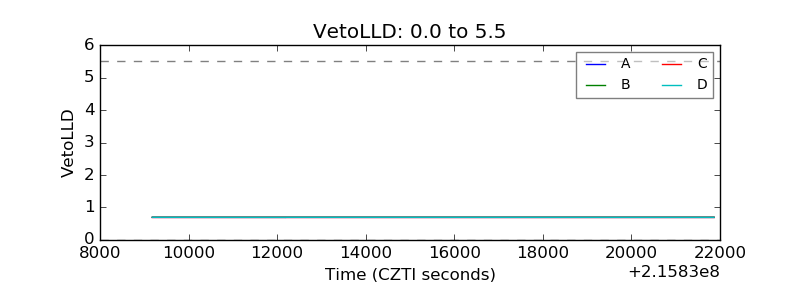 |
| Alpha Counter | 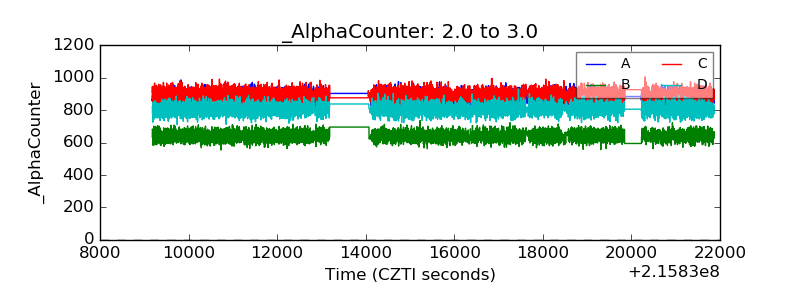 |
| _CPM_Rate | 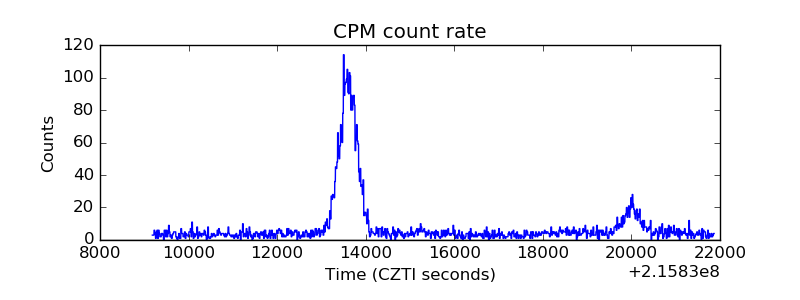 |
| CZT Counter | 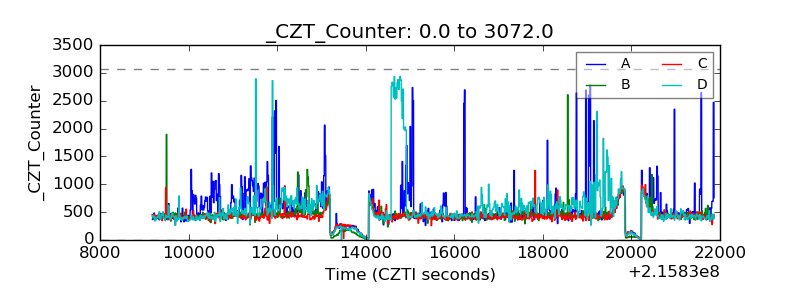 |
| +2.5 Volts monitor |  |
| +5 Volts monitor |  |
| _ROLL_ROT | 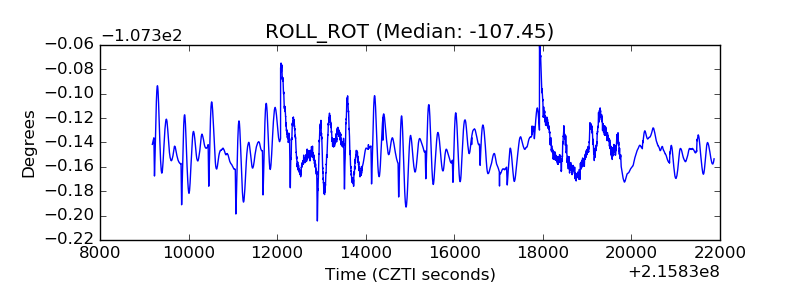 |
| _Roll_DEC | 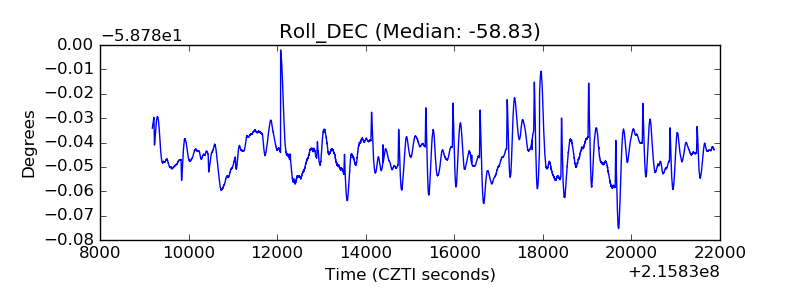 |
| _Roll_RA | 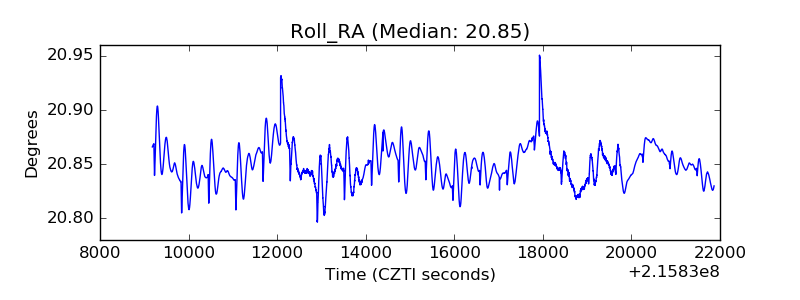 |
| Veto Counter | 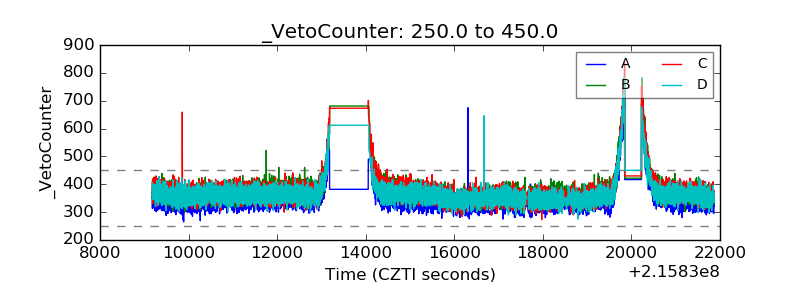 |