| Param | Original file | Final file |
|---|---|---|
| Filename | modeM0/AS1G06_157T01_9000000772_05953cztM0_level2.evt | modeM0/AS1G06_157T01_9000000772_05953cztM0_level2_quad_clean.evt |
| Size (bytes) | 163,828,800 | 29,712,960 |
| Size | 156.2 MB | 28.3 MB |
| Events in quadrant A | 1,243,623 | 170,925 |
| Events in quadrant B | 1,176,755 | 185,764 |
| Events in quadrant C | 1,142,981 | 187,823 |
| Events in quadrant D | 1,224,875 | 175,021 |
| Mode M9 | |||
|---|---|---|---|
| Quadrant | BADHDUFLAG | Total packets | Discarded packets |
| A | 0 | 6 | 4 |
| B | 0 | 3 | 2 |
| C | 0 | 4 | 3 |
| D | 0 | 4 | 3 |
| Mode M0 | |||
|---|---|---|---|
| Quadrant | BADHDUFLAG | Total packets | Discarded packets |
| A | 0 | 20845 | 15612 |
| B | 0 | 17881 | 12662 |
| C | 0 | 17758 | 12485 |
| D | 0 | 18966 | 13624 |
| Mode SS | |||
|---|---|---|---|
| Quadrant | BADHDUFLAG | Total packets | Discarded packets |
| A | 0 | 168 | 106 |
| B | 0 | 166 | 102 |
| C | 0 | 169 | 125 |
| D | 0 | 170 | 122 |
| Quadrant | Total seconds | Saturated seconds | Saturation percentage |
|---|---|---|---|
| A | 2323 | 106 | 4.563065% |
| B | 2494 | 118 | 4.731355% |
| C | 2532 | 93 | 3.672986% |
| D | 2507 | 86 | 3.430395% |
Noise dominated data is calculated using 1-second bins in cleaned event files. If a bin has >2000 counts, and if more than 50% of those come from <1% of pixels, then it is considered to be noise-dominated and hence unusable.
| Quadrant | # 1 sec bins | Bins with >0 counts | Bins with >2000 counts | High rate bins dominated by noise | Noise dominated (total time) | Noise dominated (detector-on time) | Marked lightcurve |
|---|---|---|---|---|---|---|---|
| A | 8740 | 3436 | 6 | 6 | 0.07% | 0.17% | 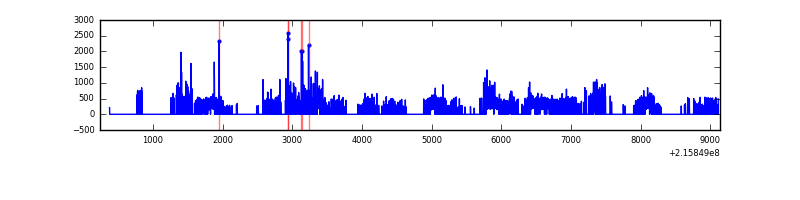 |
| B | 8900 | 3664 | 0 | 0 | 0.00% | 0.00% | 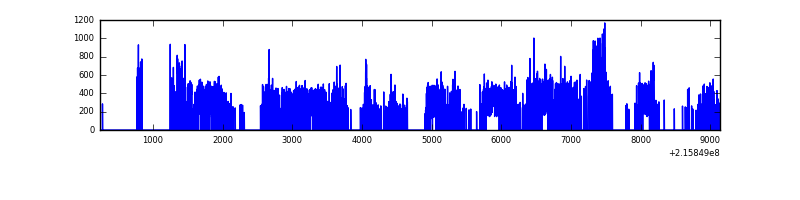 |
| C | 8345 | 3694 | 0 | 0 | 0.00% | 0.00% | 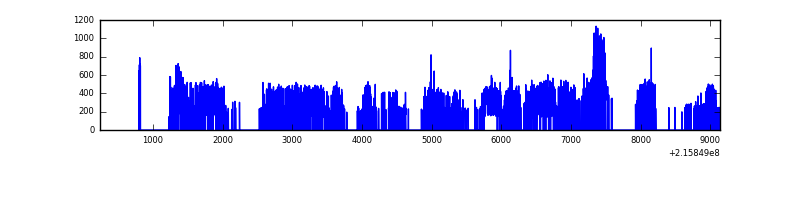 |
| D | 8360 | 3673 | 0 | 0 | 0.00% | 0.00% | 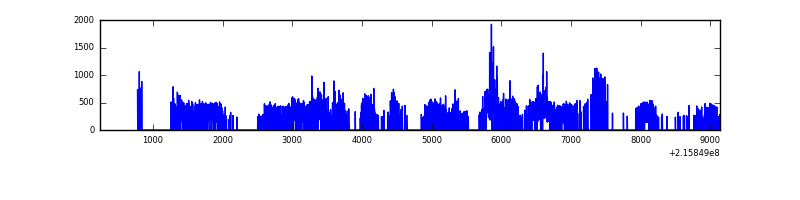 |
Top three noisy pixels from each quadrant. If the there are fewer than three noisy pixels in the level2.evt file, extra rows are filled as -1
| Pixel properties | Quadrant properties | ||||||
|---|---|---|---|---|---|---|---|
| Quadrant | DetID | PixID | Counts | Sigma | Mean | Median | Sigma |
| A | 4 | 2 | 160640 | 2846.88 | 266 | 258 | 56.3 |
| A | 13 | 251 | 50141 | 885.45 | 266 | 258 | 56.3 |
| A | 8 | 192 | 4063 | 67.54 | 266 | 258 | 56.3 |
| B | 4 | 81 | 14926 | 249.71 | 291 | 283 | 58.6 |
| B | 0 | 219 | 14627 | 244.61 | 291 | 283 | 58.6 |
| B | 15 | 255 | 12758 | 212.74 | 291 | 283 | 58.6 |
| C | 1 | 16 | 3424 | 45.11 | 290 | 290 | 69.5 |
| C | 9 | 54 | 2896 | 37.51 | 290 | 290 | 69.5 |
| C | 13 | 61 | 2381 | 30.09 | 290 | 290 | 69.5 |
| D | 2 | 63 | 128578 | 1796.41 | 282 | 273 | 71.4 |
| D | 2 | 16 | 12998 | 178.16 | 282 | 273 | 71.4 |
| D | 1 | 20 | 6375 | 85.43 | 282 | 273 | 71.4 |
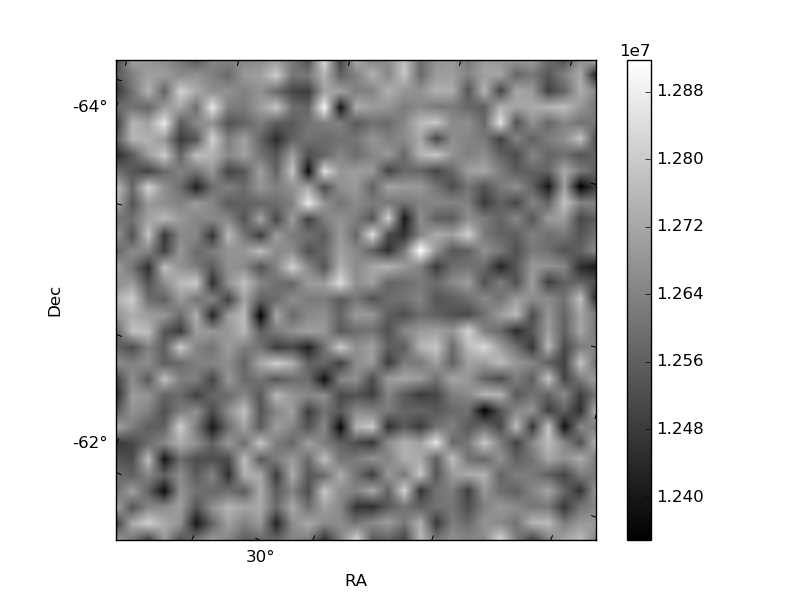
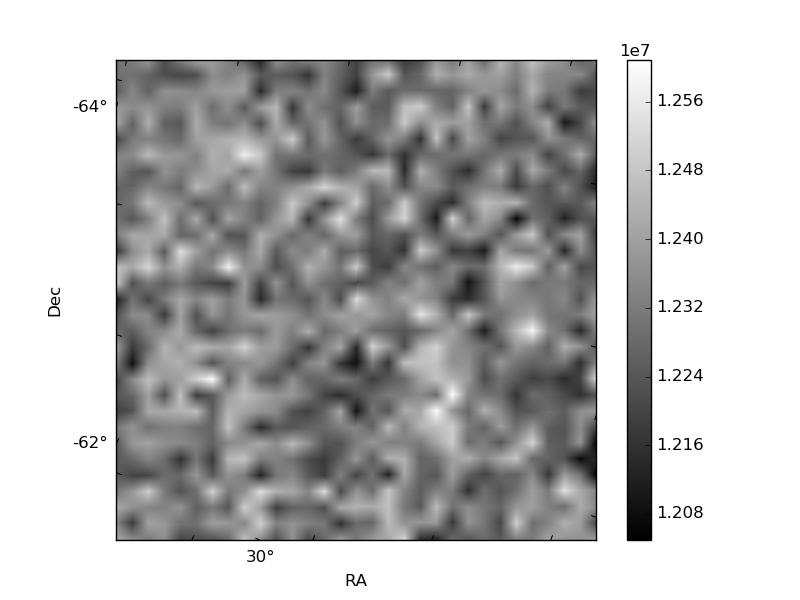
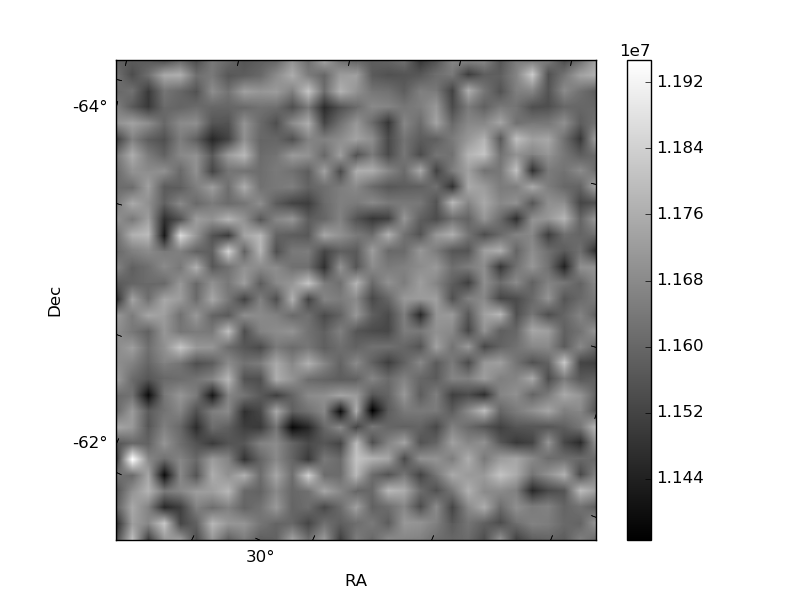
Histogram calculated using DETX and DETY for each event in the final _common_clean file
| Quadrant A | 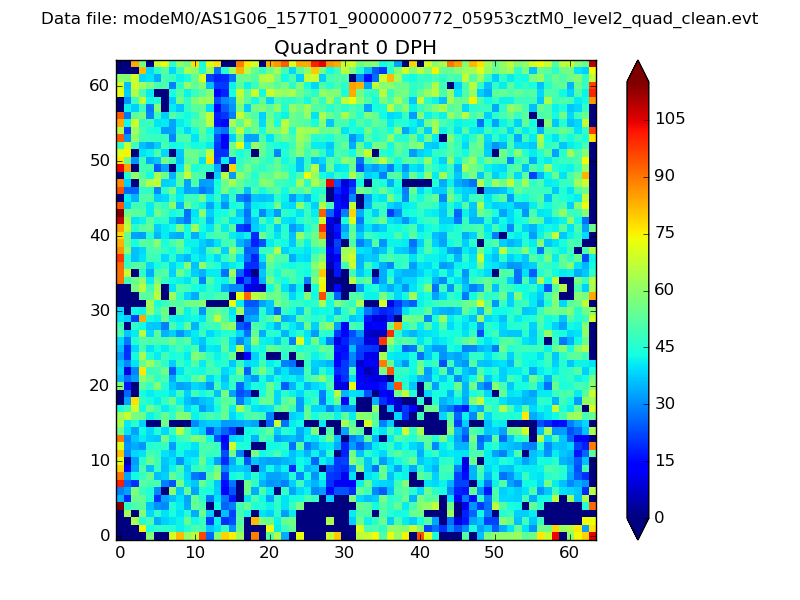 |
 |
Quadrant B |
|---|---|---|---|
| Quadrant D |  |
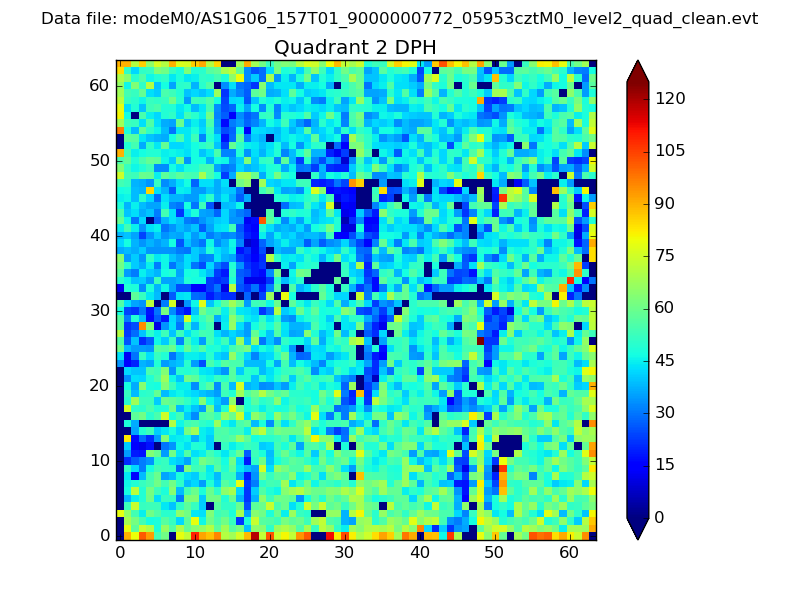 |
Quadrant C |
| Plot type | Count rate plots | Images |
|---|---|---|
| Comparison with Poisson distribution Blue bars denote a histogram of data divided into 1 sec bins. Red curve is a Poisson curve with rate = median count rate of data. |
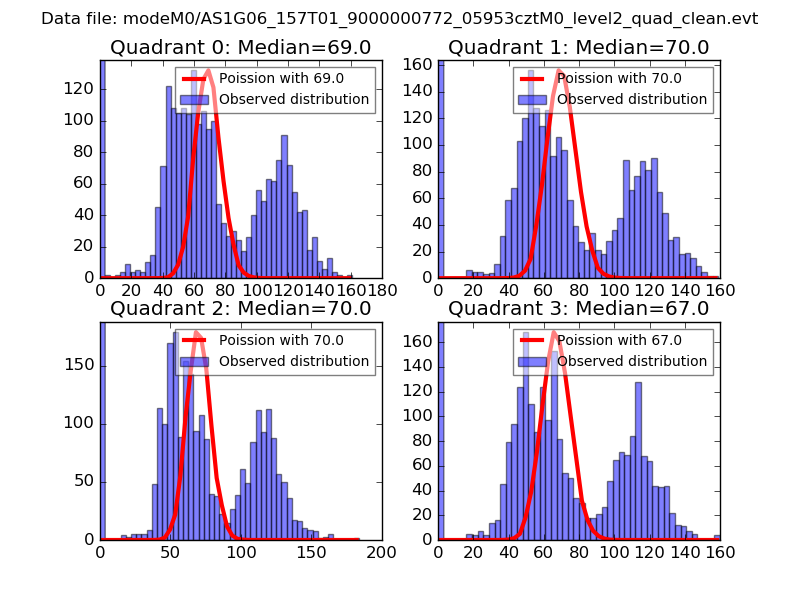 |
 |
| Quadrant-wise count rates Data is divided into 100 sec bins |
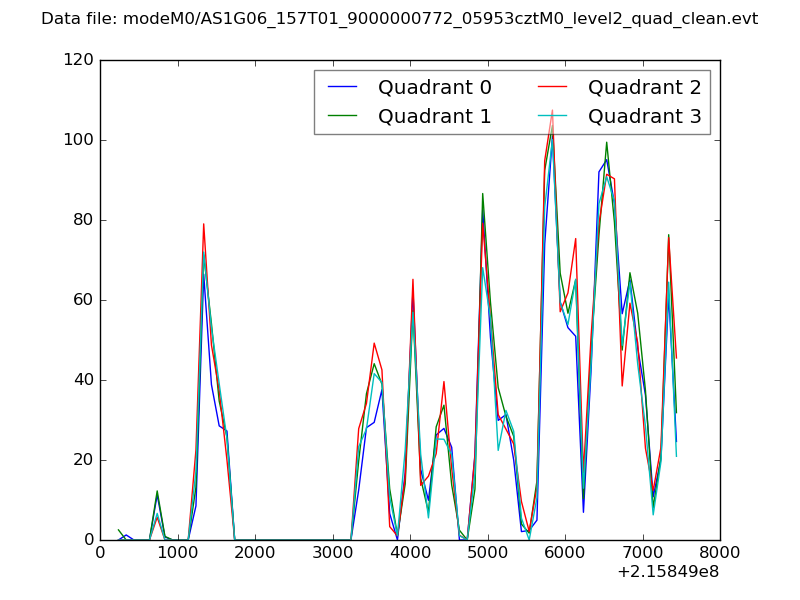 |
|
| Module-wise count rates for Quadrant A Data is divided into 100 sec bins |
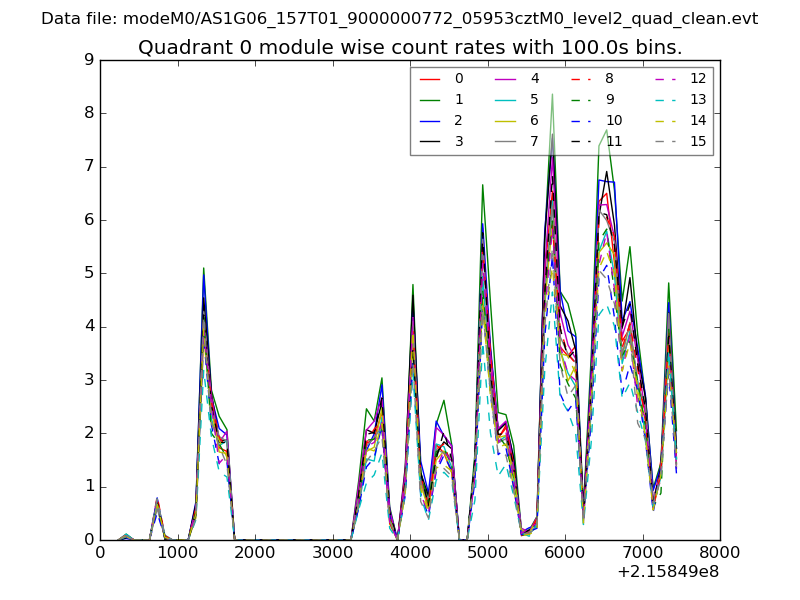 |
 |
| Module-wise count rates for Quadrant B Data is divided into 100 sec bins |
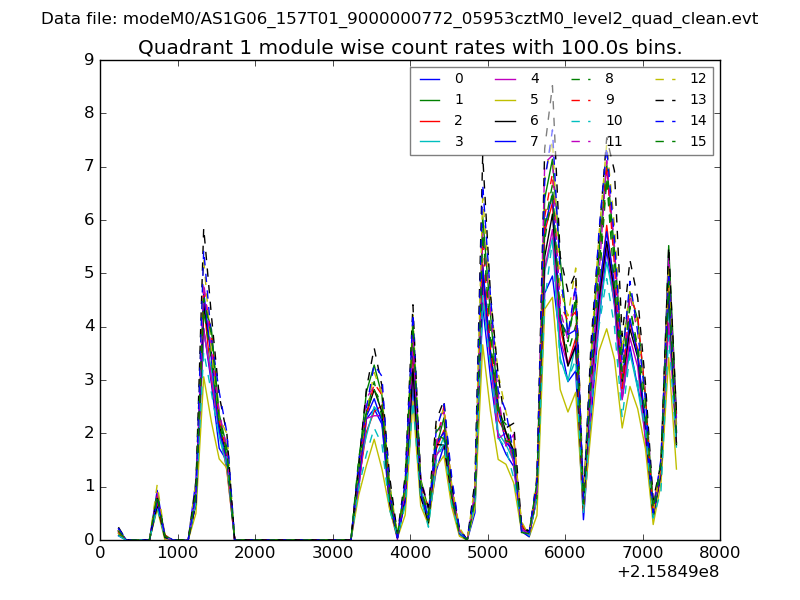 |
 |
| Module-wise count rates for Quadrant C Data is divided into 100 sec bins |
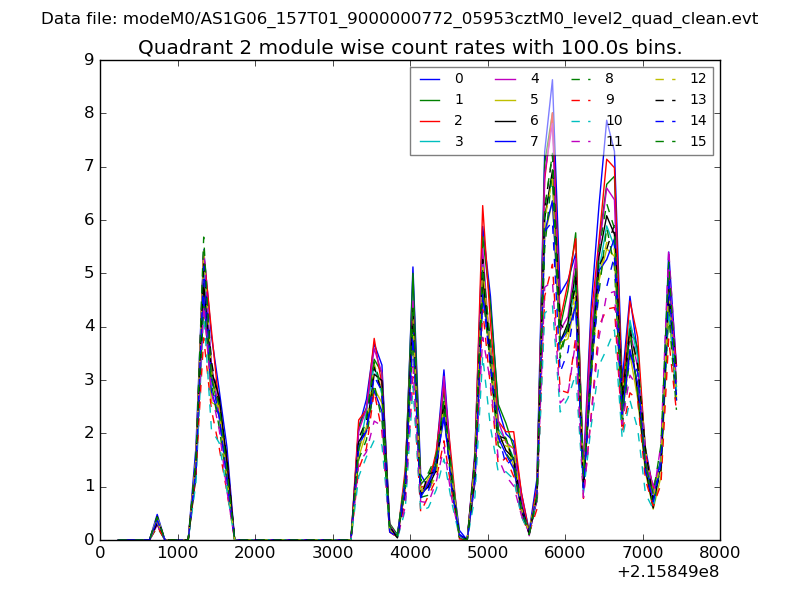 |
 |
| Module-wise count rates for Quadrant D Data is divided into 100 sec bins |
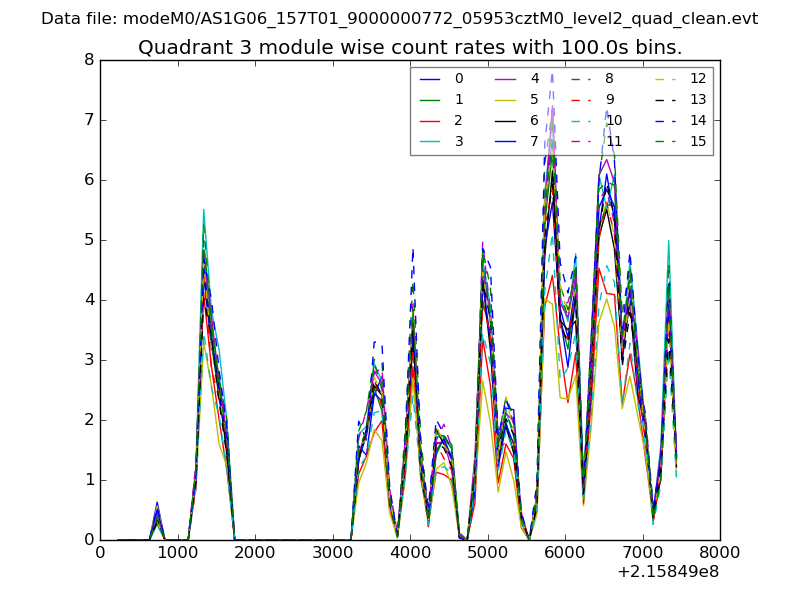 |
 |
| Parameter | Plot |
|---|---|
| CZT HV Monitor | 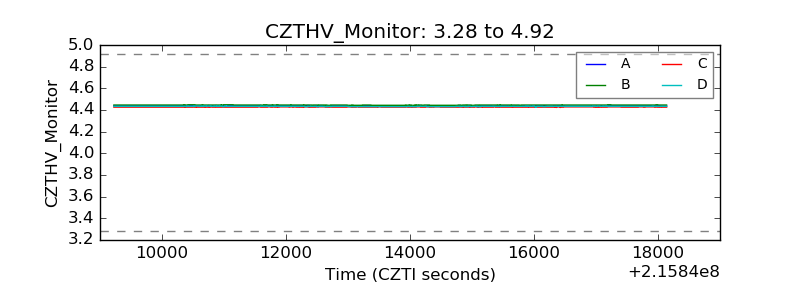 |
| D_VDD | 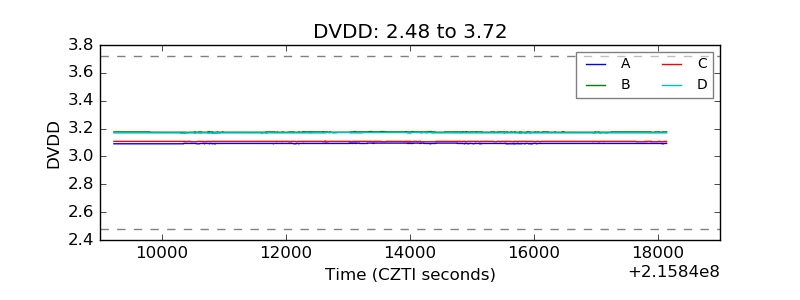 |
| Temperature 1 | 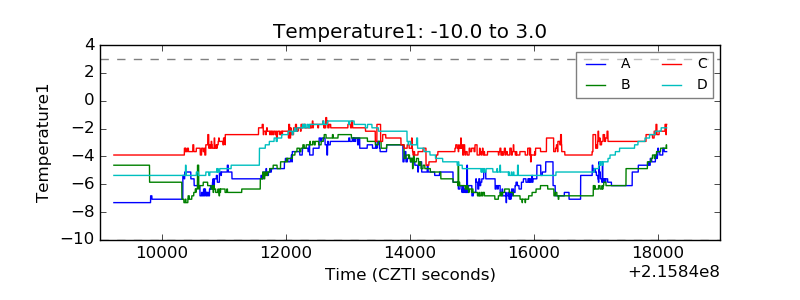 |
| Veto HV Monitor | 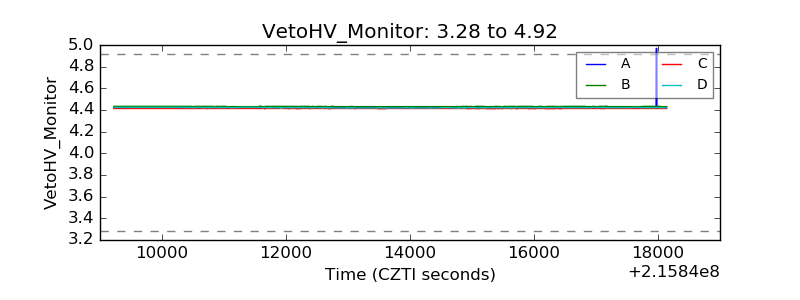 |
| Veto LLD | 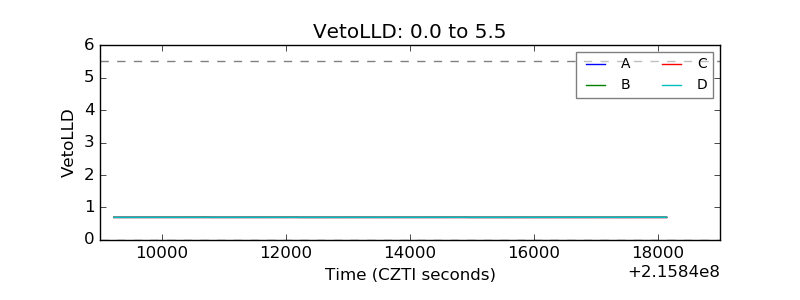 |
| Alpha Counter | 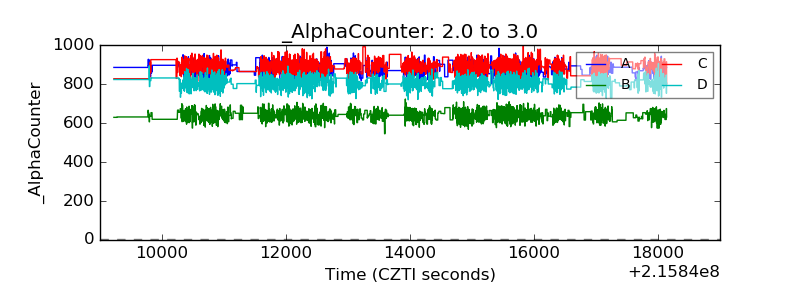 |
| _CPM_Rate | 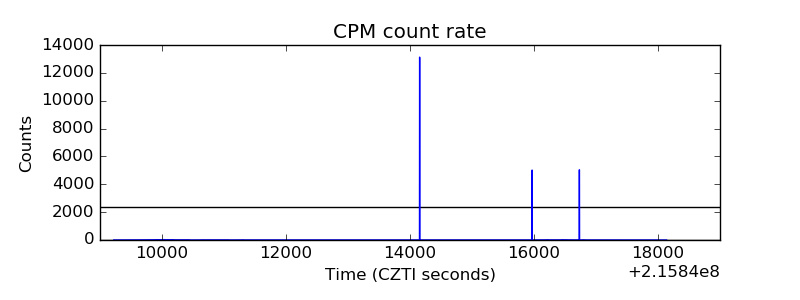 |
| CZT Counter | 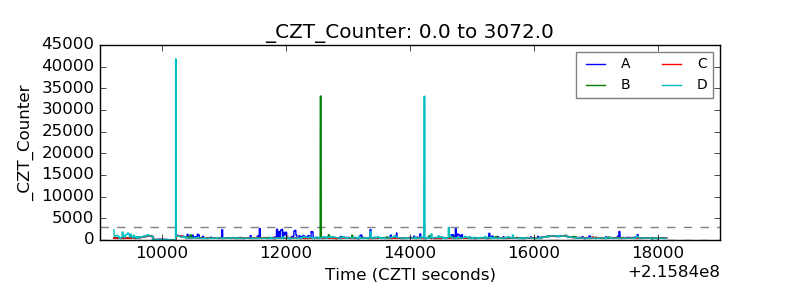 |
| +2.5 Volts monitor |  |
| +5 Volts monitor |  |
| _ROLL_ROT | 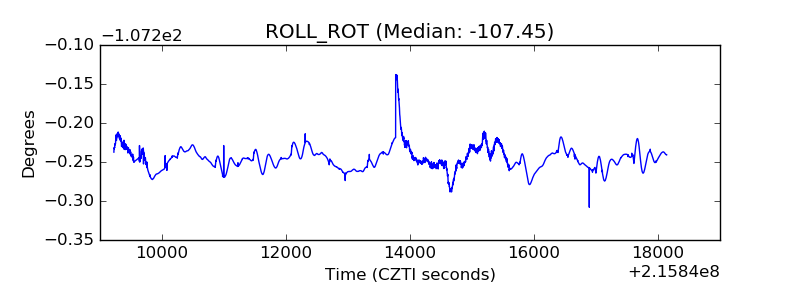 |
| _Roll_DEC | 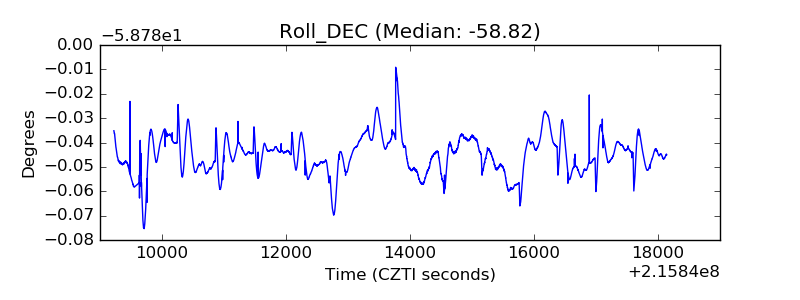 |
| _Roll_RA | 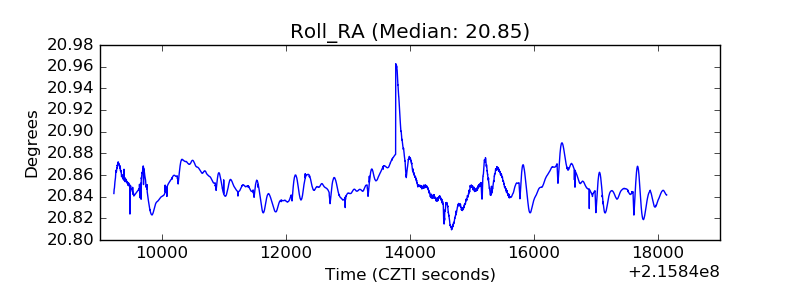 |
| Veto Counter | 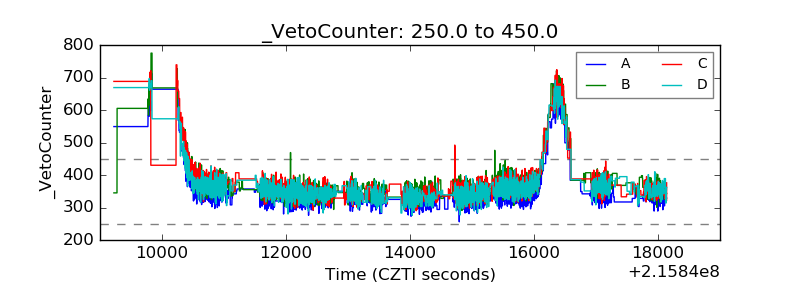 |